The modern industrial complex typically includes various motors and pumps. Maintenance of these motors and pumps is of utmost importance in the industrial field. Typically, a motor or pump fault brings many failures in production and causes secondary troubles, including material damage and harm to workers. Therefore, it is very important to detect fault signals in motors and pumps before failure occurs.
During the past few decades, various studies of fault diagnosis have been conducted for motors and pumps [1–11].
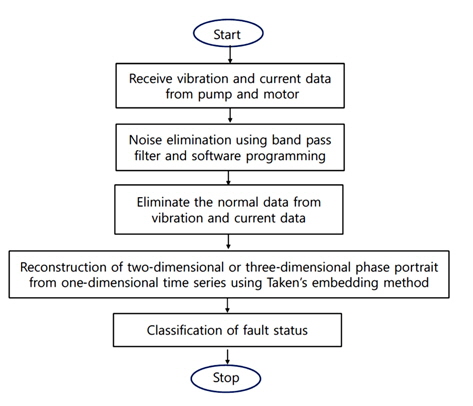
Generally, the fault signs of motor and pump are judged by current and vibration signals. In this paper, we measure the current and vibration signals of one-dimensional time series that occur in a motor and pump, respectively. These are representatives of rotary and pumping machines and are used for diagnosing faults. We also eliminate unnecessary component such as noise by pre-processing the current and vibration signals. Then, in order to diagnose fault signs for the pump and motor, we transform from the one-dimensional time series to a twodimensional phase portrait using Takens’ embedding method [12]. After this transformation, we review the variation of pattern according to fault sign.
2. Data Acquisition of Current and Vibration Signals in Motors and Pumps
2.1 Configuration of the Data Acquisition System
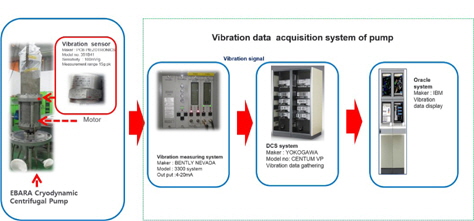
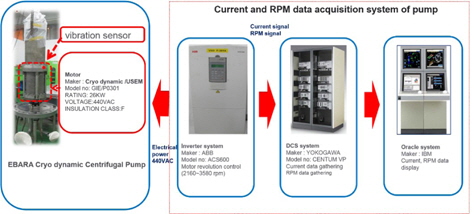
Figures 1 and 2 show the data acquisition system to acquire the current, RPM, and vibration signals from a motor and pump system. We use a seven-stage EBARA Cryodynamic centrifugal pump. This pump operates at temperatures as low as −150℃, with a rated rotational speed of 3580 rpm and a power supply of 440 VAC using an inverter.
This data acquisition system consists primarily of four systems, including the current and RPM measuring system for the motor, vibration measuring system for the pump, distributed control system (DCS), and analysis tool system.
The vibration measuring system (model 330, GE Bently Nevada, Minden, NV, USA) has an output current of 4–20 mA.
The motor is made by Cryodynamic/USEM. This 26-kW motor operates at 440 VAC and has class F insulation.
The current and RPM measuring system consists of an inverter, a DCS, and an analyzing tool. The inverter system was made by ABB and has a resolution control of 2160–3580 RPM.
The CENTUM VP DCS system, made by Yokogawa, Japan, gathers vibration data from pumps and motors.
The IBM analysis tool system displays the current and vibration data in the main console. We do not use the function of the analysis tool in this study because we need only onedimensional data of the motor and pump in order to apply chaotic theory and analyze the fault status in motors and pumps. Hence we use only the data acquisition system to collect the current, RPM, and vibration signal data.
2.2 Row Data for Analysis of Current and Vibration
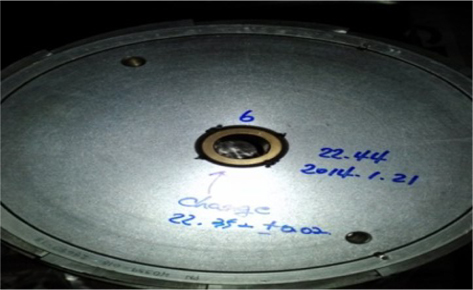
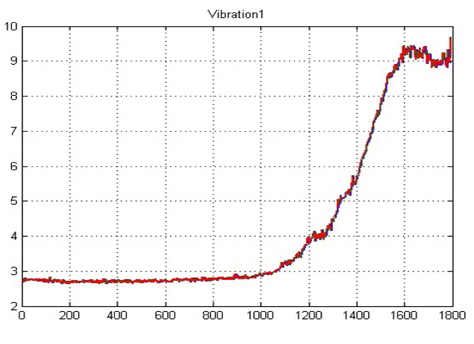
Figure 3 shows the bushing abrasion status. The reference is 22.44 mm but the abrasion is 22.35 ± 0.02 mm. From this situation, we obtain the vibration data and current data from pump and motor, respectively.
2.2.1 Vibration data
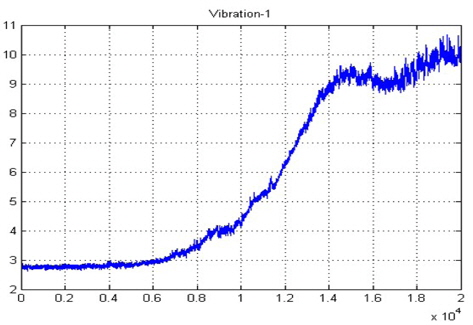
Figure 4 shows the vibration data extracted for the bushing abrasion status from the vibration sensor of the pump as shown in Figure 1. Figure 4 shows the time series that are composed as a single variable of one-dimensional vibration data acquired from pump.
2.2.2 Current data
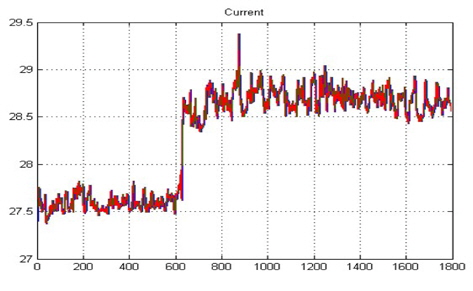
Figure 5 shows the current data extracted from the motor, which is located under the pump as shown in Figure 2. Figure 5 shows the time series that are composed as a single variable of one-dimensional current data acquired from the motor.
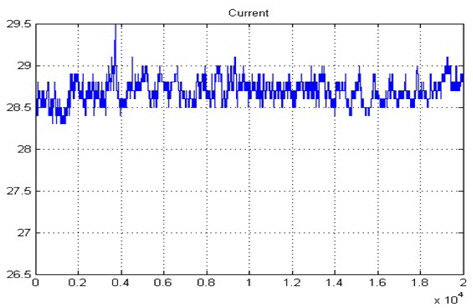
The vibration and current data shown in Figure 4 and Figure 5 contain noise. In order to obtain data with excellent qualification, we must eliminate the noise from the data. Using filter and software processing, we achieve the elimination of noise. Hence, we obtain Figure 6 and 7 after we eliminate the noise from time series of vibration and current from Figure 4 and 5, respectively.
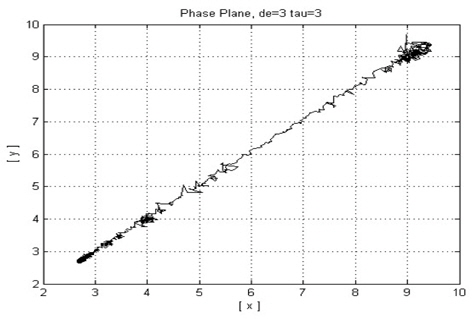
3. State Reconstruction Using Takens’ Embedding Method
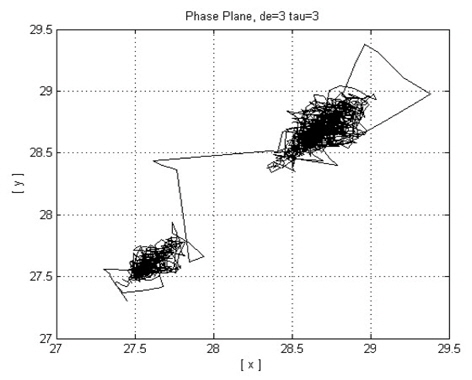
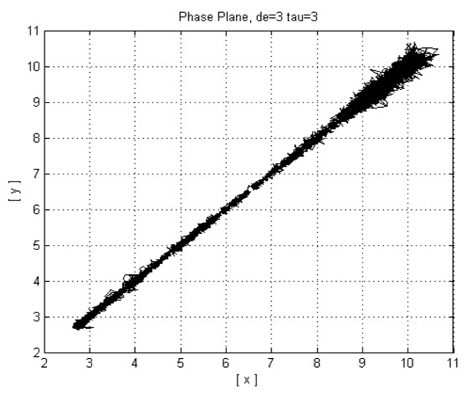
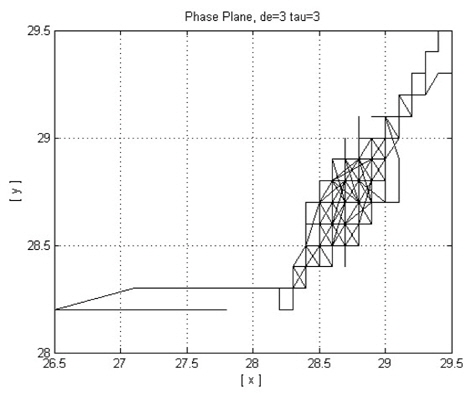
Because we cannot judge between the normal and fault status using one-dimensional time series of vibration and current data for the pump and motor, we need to transform the time series into a two-dimensional phase portrait. In order to reconstruct a two dimensional phase portrait, we apply an embedding method proposed by Taken [5]. The embedding method refers to the process by which a representation of the attractor is able to reconstruct the state from a set of scalar time series. The form of such reconstructed states is given by

where x(t) is the vibration and current of the bushing abrasion status of the pump and motor.
Although there is no difference in the time series between pre-filtering and post-filtering for the vibration and current signals, we recognize that there is a complete difference in the phase portrait between pre-filtering and post-filtering for both the vibration and current signals of the pump and motor.
In this paper, we measured the current and vibration signals of one-dimensional time series that occur in a motor and pump, respectively. These are representative of rotary machines and pumping machines. We also eliminated unnecessary components such as noise by preprocessing the current and vibration signals. Then, in order to diagnose the fault signal for the pump or motor, we transformed the one-dimensional current and vibration signals to a phase portrait of two or three dimensions using Takens’ embedding method. After this transformation, we reviewed the variation of pattern according to the fault signal.