검색 전체 메뉴
PDF
맨 위로
OA 학술지
Evaluation of MALDI Biotyping for Rapid Subspecies Identification of Carbapenemase-Producing Bacteria via Protein Profiling
  • 비영리 CC BY-NC
  • 비영리 CC BY-NC
ABSTRACT
Evaluation of MALDI Biotyping for Rapid Subspecies Identification of Carbapenemase-Producing Bacteria via Protein Profiling
KEYWORD
MALDI-TOF MS , Carbapenemase , Enterobacteriaceae
  • Introduction

    The considerable time and labour requirements of existing methods of microbial identification with the gradually relevant and pressing need for rapid and reliable techniques to identify microorganisms have inspired interest in the development of alternative microbial identification approaches.1 Polymerase chain reaction (PCR) of microorganisms remains the gold standard and although reliable, it is more expensive and requires a higher degree of expertise.1,2

    Mass spectrometry-enabled methods have been the subject of intense interest over the past decades.3-10 The wide and rapid applicability of mass spectrometry have inspired optimism that this technology has unique potential to revolutionize microbial identification. MALDI TOF MSbased approaches have been one of the most popular expertise used in this field, first due to the relatively simple sample preparation required and secondly because of the short analysis time, high sensitivity accuracy and the speed at which data can be acquired and analysed.11,12 Straintyping can allow for discrimination of pathogenic from non-pathogenic strains and drug resistant from drug susceptible bacteria.1 A recent review demonstrated that although identification of bacteria to the strain level has been achieved after 17 years of development, several difficulties with the conventional method still pose a major challenge for wider application.1 We believe that the utility of this technology at strain-typing level requires a paradigm shift from conventional methods. We propose expansion and optimization of a recent approach that has the potential to realize the aspiration to routinely discriminate between bacteria at the strain level. This will require more flexible software control of mass spectral profiling methods by focusing on unique matchless low intensity peaks.

    Studies focusing on the protein MS profiling to identify antimicrobial resistance have also been published, such as for methicillin resistant Staphylococcus aureus (MRSA),13,14 which can be applied to the MALDI Biotyper as a conventional method for biotyping of drug susceptibility. To the best of our knowledge, this is the first publication reporting any attempt at differentiating drug resistant bacteria strains via MALDI Biotyping; and none has been done on carbapenemase producing bacteria.

    The aim of this study was to explore the potential of mass spectral protein profiling for the identification of Enterobacteriaceae at the subspecies level and to rapidly discriminate carbapenemase-producing Enterobacteriaceae. Thus, we provide proof of principle for a MALDI Biotyper solution through modified MSP methods by focusing on matchless low intensity peaks, (i.e. consistent and unique peaks) to improve discrimination between strains of bacteria. This provides a rapid method to differentiate between bacteria producing different carbapenemases and can potentially serve as a point of care diagnostic tool.

    Experimental

      >  Bacterial isolates and preparation of intact cell

    Bacterial isolates of Klebsiella pneumoniae, Enterobacter cloacae, Enterobacter asburiae, Escherichia coli and Serratia marcescens expressing different, and well characterized carbapenemases, viz., (KPC-2, KPC-3, GES-5, NMC-A, VIM-1, VIM-2, VIM-19, NDM-1, NDM-4, IMP-1, IMP-8, IMP-11, SME-1, SME-2, OXA-48, OXA-181) belonging to the molecular classes A, B and D were purchased from France (Institut National de la Santé et de la Recherche Médicale, Paris, France). This group had previously characterized these isolates for their betalactamase content at molecular level.15 All isolates were sub-cultured in Nutrient Agar medium (OXOID England) at 37℃ for 24 h. Fresh bacterial cells were transferred into protein LoBind tubes (Eppendorf, Germany) containing sterile MilliQ water which was adjusted to an optical density of OD600 = 0.8, then protein extraction method was adapted from that described by Wang et al..14 Mass spectra were acquired in duplicate batches for each isolate.

      >  Mass spectrometry tests

    Mass spectra were acquired using a MALDI-TOF mass spectrometer (Bruker Daltonics) equipped with the nitrogen laser. Spectra were registered in the linear mode of positive ions (20 kV) in the range of molecular masses m/z 2000-20000. The spectra were externally calibrated using the Bruker Bacterial Test Standard (BTS) obtained from Bruker Daltonics Germany. Each spectrum was acquired with 240 laser impulses (40 impulses with various spot points). The programmed software (flexControl version 3.4 build 119, flexAnalysis version 3.4 build 70 and ClinProTools version 2.2 build 83) was employed for acquiring, treatment, and analysis of mass spectra for differentiation of isolates at the strain level to differentiate drug resistant strains from the susceptible ones investigated. This clustering version of mass spectra is an approach based on the use of algorithms of the ClinProTools software, which was initially developed for search of protein markers of various oncological diseases.16,17 Identification was performed using the MALDI Biotyper 3.1 software (Bruker Daltonics) by comparing experimental spectra with the reference library of the database containing 4613 spectra of various microorganisms. Species identification was considered reliable, when the score calculated exceeded 2.300. The score from 2.000 to 2.299 provided reliable genus identification only.

    Results and Discussion

      >  Optimisation of the method with carbapenemase-producing E. coli

    MALDI-Biotyper identification with standard methods

    Primary bacteriological species identification of all selected E. coli15 was confirmed by MALDI-TOF MS profiling. The database was reliable in identifying the E. coli species with confident scores of 2.4 to 2.5 when the standard methods for MSP creation and identification were employed (between the mass ranges of m/z 2000 to 20000). The carbapenemase enzymes IMP-1, NDM-1 NDM-4, OXA-48 and VIM-2-producing E. coli were best matched to E. coli DH5alpha, while KPC-2 and VIM-1 was best matched to E. coli MB11464 when analysed on the current database of the Biotyper method with scores between 2.5 and 2.7. In all cases, E. coli ATCC 25922 was the second or third best matched with scores between 2.3 and 2.4. These scores leave no room for incorporating a subspecies identification profile. The obtained results corresponded with that from the rapid detection of CRE.15

      >  ClinProTools analysis of spectra

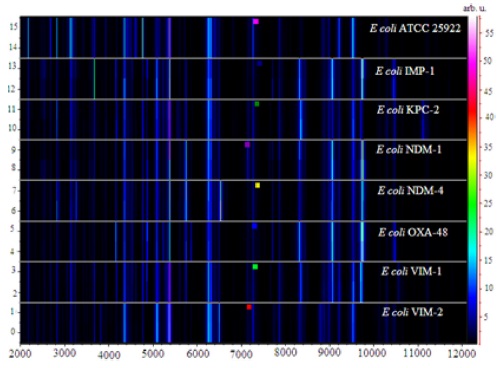
    A virtual gel view representation of data derived from E. coli isolates is shown in Figure 1a and a zoomed in view can be seen in Figure 1b. Its clear from Figure 1a that there are pertinent differences in the presence and intensity of peaks between the spectra that should allow for subspecies identification. All individual spectra are shown on a density scale and this gel view shows the intensity distribution of the relevant signals in the different samples much better than just the raw spectra.

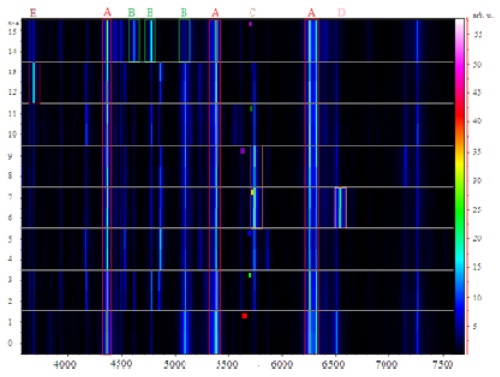
    The common peaks generated by these isolates appearing at m/z 4364, 5383, and 6256 were used for normalization of the raw spectra to provide a gel view (Figure 1b). We selected a region that incorporated the common peaks to illustrate the effectiveness of visual peak picking to assist in differentiating between the isolates. The drug susceptible E. coli ATCC 25922 control strain was visually differentiated from the carbapenemase-producing bacteria and the most notable being the presence of high intensity bands at m/z 4612 and 4769 while there was an observed lower intensity band at m/z 5096. NDM-1 and NDM-4 were distinguishable by high intensity bands at m/z 5755 while the latter also displayed an exclusive high intensity signal at m/z 6538. IMP-1 exhibited a distinctly stronger band at m/z 3673 that is present in all of the other isolates but with much lower intensities. This procedure appears therefore to be capable of generating significantly different m/z signals that may be employed in the differentiation of these isolates via a biomarker approach.14

    Three groups of isolates were chosen randomly to investigate the significance of using this biomarker approach to identify several mass peaks that could result in a fingerprint. ClinProTools provides a list of peaks selected according to statistical importance based on the intensity and/or the presence of peaks only, to differentiate between the selected isolates. The visual peak picking was based on the presence of identifying exclusive peaks between spectra, and this enabled the detection of significant differences amongst E. coli isolates producing the carbapenemases (Table 1). The comparison of drug susceptible E. coli ATCC 25922 and E. coli producing VIM-2 enzyme showed seven peaks distinctive to the standard strain while thirteen peaks unique to the carbapenemase-producing bacteria. Within the carbapenemase-producing bacteria, we compared VIM-1 to KPC-2 and NDM-1 to OXA-48 as an illustration. Five peaks were matchless to KPC-2 and two to VIM-1 by visualization, while NDM-1 versus OXA-48 showed two and four exclusive peaks respectively.

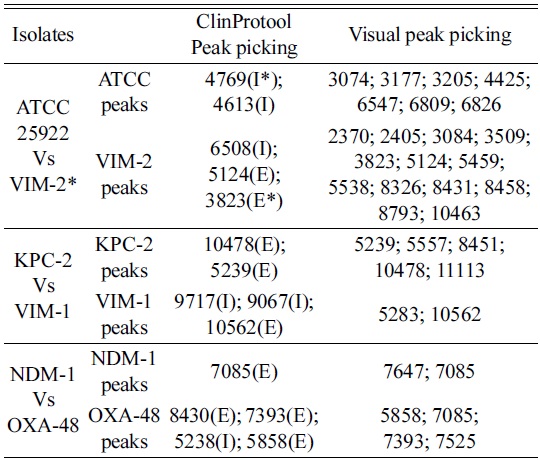
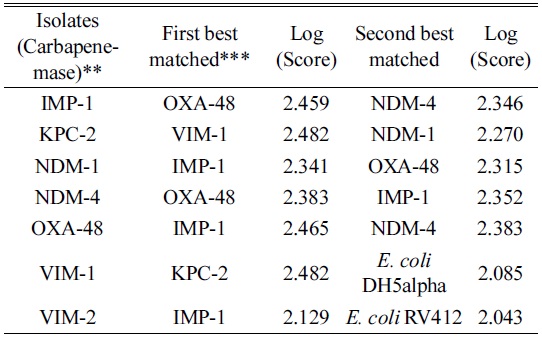
    [Table 1.] Comparison of ClinProTools statistics vs visual peak picking randomly

    label

    Comparison of ClinProTools statistics vs visual peak picking randomly

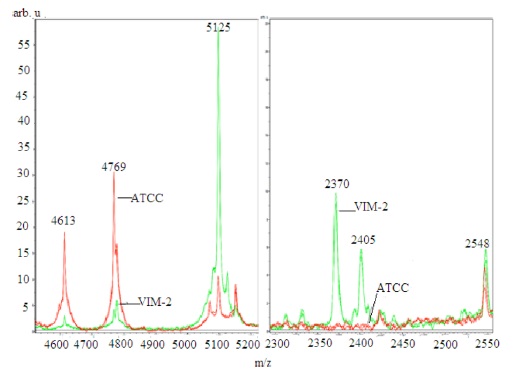
    In order to differentiate the selected isolates, the ClinProTools specified a list of peaks arranged according to the statistical significance where the notified distinction was the changes of intensity in general, Figure 2 (left). Moreover the visual investigation was based only on the exclusive unique peaks Figure 2 (right). The default statistical peak lists did not provide enough significance to the lower intensity exclusive peaks as compared to intensity differences between common peaks. Current software does not allow manual changes to the default method.

      >  MALDI-Biotyper identification with modified MSP methods

    We generated a mass spectrum profile (MSP) of the standard control strain ensuring that the creation method included all of the peaks that were identified as exclusive between the species. MSP is a reference spectrum or more accurately a reference peak list that is assigned to a species or strains. Subtyping MSPs are used to distinguish between closely related species. In addition to extracting information on peak frequency and peak intensity distribution, subtyping MSPs apply additional weighting to distinguish unique peaks. The desired mass error for the MSP creation method was changed from 250 ppm to 2000 ppm and the desired peak number from 70 to 100. The mass error of the raw spectra for the identification method was restricted to be 250 ppm as compared to the standard of 2000 ppm. The modifications of the mass error were based on maximizing the inclusion of all relevant peaks (including low intensity peaks). VIM-2 was scanned against the existing Biotyper database to compare the standard methods with the modified version and, with the inclusion of the newly created MSP of the E. coli ATCC 25922 - type strain. The standard identification method gave a score of 2.5 indicating a false positive for the species but modified version gave a score of 1.7. Since the modified method represented a result closer to reality, these settings were used for the generation of the data in Table 2. Database entries were created for all of the carbapenemase-producing E. coli with the new MSP creation method and found that this was warranted as more than 70 peaks were identified for each isolate.

    [Table 2.] Evaluation of carbapenemase-producing E. coli isolates by the modified MSP* creation and identification methods

    label

    Evaluation of carbapenemase-producing E. coli isolates by the modified MSP* creation and identification methods

    We scanned the CRE producing E. coli against the extended database (including isolates from this study) and ensured that the identification and MSP creation methods were matched to give full scores for the isolates against their own entries (score of 3.000) to ensure that parameters for the MSP creation and MSP identification matched with respect to inclusion of peaks. The scores of the first matched identities (other than the full score of 3 for itself) were found to all be below 2.5 even for closely related isolates and below 2.1 for non-carbapenemase producers. These results suggest that carbapenemase-producing bacteria could be identified via Biotyper with inclusion of all entries of the Bruker database and the carbapenemaseproducing bacteria. This method was able to give an improved difference between carbapenemase and non-carbapenemase producers, according to the score of best-matched identities. The best scores were always carbapenemase-producers illustrating that the modified method would allow for rapid subspecies identification. The significantly large difference in scores between isolates used for identification and the best matched indicates that a score above 2.5 could be used for “highly probable” subspecies identification.

      >  Application of the optimised method to differentiate CRE strains

    The second part of this study involved an application of this strategy for potential identification of different strains of carbapenem resistant bacteria.

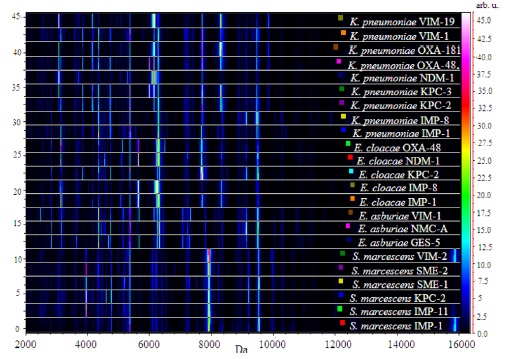
    The gel view representation of the acquired spectra from K. pneumoniae, E. asburiae, E. cloacae, and S. marcescens are shown in Figure 3. All individual spectra are shown on a density scale and this gel view shows the intensity distribution of the relevant signals in the different samples. In each group of bacteria, common bands were observed at m/z 7706 for K. pneumoniae, m/z 7890 for S. marcescens, m/z 7068 for E. asburiae and at m/z 5474 for E. cloacae.

    Within carbapenemase-producing K. pneumoniae distinguishable bands could be observed at m/z 3060 with high intensity level for VIM-19 that was also present in NDM-1 but easily separable by the presence of bands at m/z 2505 for NDM-1 and with a low intensity bands at m/z 6450 in VIM-1. IMP-1 and IMP-8 were identifiable by the presence of bands at m/z 8209 and 3843 in IMP-1. KPC-2 and KPC-3 exhibited a distinct band at m/z 6011. OXA-48 and OXA-181 could be distinguished at m/z 5977.

    Specific bands could also be observed in the group of E. asburiae at m/z 4685 and 2318 for GES-5, m/z 2469 and 3392 for VIM-1. NMC-A was distinguishable by the presence of low intensity bands at m/z 10794.

    In the group of E. cloacae, OXA-48 is observable by the band at m/z 6484, IMP-1 at m/z 5993, KPC-2 with a thin band at 8511 and NDM-1 at m/z 10290 having low intensity.

    S. marcescens carrying VIM-2 and IMP-1 enzyme were distinguishable by the band at m/z 15854 from others, and a particular band at m/z 2015, a tiny band also appeared at m/ z 1584 and absence of band at m/z 9974 with IMP-11. Four consecutives bands were observable at m/z 3046, 3112, 3177 for KPC-2. The differences between SME-1 and SME-2 could be observed at m/z 6830 and 7501. This procedure appears to be capable of generating significantly different bands signals that may be optimized and included in the differentiation of these isolates.

    Conclusions

    Thus, based on our data, MALDI Biotyper has potential as a tool for rapid detection and diagnosis of carbapenemase-producing bacteria. This potential can be further enhanced if the software would allow for manual weighting of the desired biomarker peaks. Alternatively, specific protein targets (biomarkers) can be used. The differentiation of carbapenemase-producing Enterobacteriaceae remains a challenge using MALDI Biotyper MS based on the protein profiling due to the close relationship between the CREs. Visual observation of peaks demonstrated that the differences within the carbapenemases could be better emphasised with the modified MSP methods by focusing on matchless low intensity peaks since the non-consideration of these peaks resulted in less significant scores. In our study we show the flaws of complete dependence on the Biotyper software and the necessity for visual peak picking as a tool of peak discrimination in such closely related bacterial strains. This work was able to take this field of subspecies identification forward by demonstrating how the optimization of the software protocols that incorporate consistent distinct low intensity peaks can also be utilized in the discrimination of different carbapenem resistant bacteria.

참고문헌
  • 1. Sandrin T. R., Goldstein J. E., Schumaker S. 2013 [Mass Spectrom. Rev.] Vol.32 P.188
  • 2. Poirel L., Walsh T. R., Cuvillier V., Nordmann P. 2011 [Diagn. Microbiol. Infect. Dis.] Vol.70 P.119
  • 3. Maier T., Klepel S., Renner U., Kostrzewa M. 2006 [Nat. Methods] Vol.3 P.i
  • 4. Gao Y., McLuckey S. A. 2013 [Rapid Commun. Mass Spectrom.] Vol.27 P.249
  • 5. Gao Y., McLuckey S. A. 2012 [J. Mass Spectrom.] Vol.47 P.364
  • 6. Pieroni L., Finamore F., Ronci M., Mattoscio D., Marzano V., Mortera S. L., Quattrucci S., Federici G., Romano M., Urbani A. 2011 [Mol. BioSyst.] Vol.7 P.630
  • 7. Gao Y., Yang J., Cancilla M. T., Meng F., McLuckey S. A. 2013 [Anal. Chem.] Vol.85 P.4713
  • 8. Seng P., Rolain J.-M., Fournier P. E., La Scola B., Drancourt M., Raoult D. 2010 [Future Microbiol.] Vol.5 P.1733
  • 9. Webb I. K., Gao Y., Londry F. A., McLuckey S. A. 2013 [J. Mass Spectrom.] Vol.48 P.1059
  • 10. TeKippe E. M., Shuey S., Winkler D. W., Butler M. A., Burnham C.-A. D. 2013 [J. Clin. Microbiol.]
  • 11. Murray P. R. 2010 [Clin. Microbiol. Infect.] Vol.16 P.1626
  • 12. Fagerquist C. K., Garbus B. R., Miller W. G., Williams K. E., Yee E., Bates A. H., Boyle S., Harden L. A., Cooley M. B., Mandrell R. E. 2010 [Anal. Chem. (Washington, DC, U. S.)] Vol.82 P.2717
  • 13. Kornienko M. A., Il'ina E. N., Borovskaia A. D., Edel'shteimn M. V., Sukhorukova M. V., Kostrtzewa M., Govorun V. M. 2012 [Biomed Khim] Vol.58 P.501
  • 14. Wang Y. R., Chen Q., Cui S. H., Li F. Q. 2013 [Biomed Environ Sci] Vol.26 P.430
  • 15. Nordmann P., Poirel L., Dortet L. 2012 [Emerg Infect Dis] Vol.18 P.1503
  • 16. Qiu F., Liu H.-Y., Dong Z.-N., Feng Y.-J., Zhang X. J., Tian Y.-P. 2009 [Am. J. Biomed. Sci.] Vol.1 P.80
  • 17. Ketterlinus R., Hsieh S.-Y., Teng S.-H., Lee H., Pusch W. 2005 [Biotechniques] P.37
OAK XML 통계
이미지 / 테이블
  • [ Figure 1a. ]  Gel view of a susceptible strain type with carbapenem resistant E. coli isolates. The gel view shows all of the loaded spectra files arranged in a pseudo-gel like style. The x-axis records the m/z values from 2000 to 12000. The y-axis displays the running spectrum number initiating from subsequent spectra loading. The peak intensity is expressed as a colour scale. The colour bar and the right y-axis indicate the relation between the colour with which a peak is displayed and the peak intensity in arbitrary units.
    Gel view of a susceptible strain type with carbapenem resistant E. coli isolates. The gel view shows all of the loaded spectra files arranged in a pseudo-gel like style. The x-axis records the m/z values from 2000 to 12000. The y-axis displays the running spectrum number initiating from subsequent spectra loading. The peak intensity is expressed as a colour scale. The colour bar and the right y-axis indicate the relation between the colour with which a peak is displayed and the peak intensity in arbitrary units.
  • [ Figure 1b. ]  Zoomed in gel view comparing a susceptible strain type and carbapenem resistant E. coli isolates. A) common bands used for normalization of spectra; B) bands that differentiate susceptible strains from resistant isolates; C) biomarker bands for NDM-1 and NDM-4; D) band exclusive to NDM-4; E) higher intensity band for IMP-1.
    Zoomed in gel view comparing a susceptible strain type and carbapenem resistant E. coli isolates. A) common bands used for normalization of spectra; B) bands that differentiate susceptible strains from resistant isolates; C) biomarker bands for NDM-1 and NDM-4; D) band exclusive to NDM-4; E) higher intensity band for IMP-1.
  • [ Table 1. ]  Comparison of ClinProTools statistics vs visual peak picking randomly
    Comparison of ClinProTools statistics vs visual peak picking randomly
  • [ Figure 2. ]  Comparison of ClinProTools peak picking (left) versus the visual peak picking (right). The ATCC 25922 type strain peaks are represented in red color and the carbapenemase producing VIM-2 in green color.
    Comparison of ClinProTools peak picking (left) versus the visual peak picking (right). The ATCC 25922 type strain peaks are represented in red color and the carbapenemase producing VIM-2 in green color.
  • [ Table 2. ]  Evaluation of carbapenemase-producing E. coli isolates by the modified MSP* creation and identification methods
    Evaluation of carbapenemase-producing E. coli isolates by the modified MSP* creation and identification methods
  • [ Figure 3. ]  Gel view comparing carbapenem resistant isolates expressing different enzymes.
    Gel view comparing carbapenem resistant isolates expressing different enzymes.
(우)06579 서울시 서초구 반포대로 201(반포동)
Tel. 02-537-6389 | Fax. 02-590-0571 | 문의 : oak2014@korea.kr
Copyright(c) National Library of Korea. All rights reserved.