The relationship between foreign direct investment (FDI) and growth has been much debated in recent literature. Many endogenous growth models supported the idea that FDI enhances total factor productivity and consequently stimulates economic growth, especially through advanced technology transfer from the North to the South receiving countries (Lichtenberg & van Pottelsberghe de la Potterie, 1996).
This is, however, a macroeconomic belief that leads many developing countries to offer various incentives in order to attract FDI. But, in the face of the inclusiveness of many empirical findings on the micro effects of FDI presence, particularly with regard to technology spillovers and firms’ efficiency, a move from the macro approach to a micro level analysis is recommended. As pointed out by Lipsey (2002), a global evaluation of aggregate FDI contribution to country productivity through spillovers would be insufficient if more detailed analysis is not conducted. In this detailed analysis, one should understand how the circumstances and policies of countries, industries and firms may promote or impede technology spillovers. It is also important to describe the main factors affecting technology spillovers and local firms’ efficiency in the presence of FDI. These are the main theoretical aspects we propose to develop in a first step.
In a second step, the empirical strategy that we should perform must integrate recent advances in micro econometrics dealing with the two-stage strategy method in order to evaluate the existence, the sign and the magnitude effects of FDI presence on firms’ technical efficiency. Since critics mainly address the two-stage approach based on the parametric estimation of an efficiency frontier, although this was adopted in the case of Morocco (Haddad & Harrison, 1993) and India (Kathuria, 2000), we choose in this paper to use a standard econometric protocol based on DEA analysis (Simar, 2003; Simar & Wilson, 2007) as applied recently by Kravtsova (2008) for transition economies. Moreover, as we have Tunisian micro panel data at our disposal, we think that this possibility allows us to take into account the conclusion reached by Görg and Strobl (2001) who performed a meta-analysis of the literature on productivity spillovers and concluded that the results do not seem to be affected by whether the studies use sector or firm level data, but that it is important whether the data used are cross-sectional or panel data.
The remainder of the paper is organised as follows: section 2 presents briefly the Tunisian FDI policy orientation. Section 3 develops with some details the theoretical determinants of FDI technology spillovers. Technical efficiency measures and two-stage estimation are discussed in section 4. The representativeness of the sample used is examined in section 5. Dynamic DEA technical efficiency scores analysis is detailed in section 6. Second stage regression results are commented upon in section 7. Section 8 concludes.
2. Tunisian FDI Policy Orientation
During the last few decades, many measures have been adopted by Tunisian policy-makers to attract FDI spurred on by the belief that foreign investment inflows will introduce modern technology, enhance efficiency and stimulate export-led growth. Tunisia provided a wide range of incentives such as tax relief up to 35% on reinvested revenues and profits (30% starting from 2007), exemptions from customs duties and a 10% reduction in Value Added Taxes (VAT) for imported capital goods having no Tunisian manufacturing equivalent, a suspension of VAT and sales tax on locally produced equipment at company start-up and an optional depreciation scheduling for capital equipment older than seven years. Additional incentives were provided to offshore industries or totally exporting industries such as full exemption on corporate profits earned on export for the first ten years and 50% reduction thereafter (granted also to partially exporting firms), full tax exemption on reinvested profits and income, total exemption from customs duties on imported capital goods, raw materials, semi finished goods and services necessary for business.
By the 1990s, the net FDI flows to GDP reached 2.2%. FDI distribution by sector reveals that until the first half of the 1990s, FDI was mainly oriented to the petroleum and gas sector (about 80% against 8% for the manufacturing sector). By 1998, and with regard to the privatization program, an increasing share of total FDI in the manufacturing sector compared to petroleum and gas was observed (35% and 58% respectively). At the firms’ level, the manufacturing sector concentrates almost all the enterprises and jobs creation. In 2002, 84% of foreign-owned-firms and 90% of the jobs created by them were in this sector.
This FDI shift to the manufacturing sector has been certainly beneficial for the local industry and for the economy as a whole, particularly with regard to employment, infrastructure modernization, and exports.However, in the absence of a concrete evaluation that goes far beyond what officials declare about the merits of FDI in terms of technology transfer, we are not yet sure that this FDI shift has induced intensive FDI technology spillovers and we ignore empirically to what extent local firms have been integrating these spillovers to enhance their technical efficiency.
3. Theoretical Determinants of FDI Technology Spillovers
In the theory of Multinational Enterprises (MNEs), FDI technology spillovers analysis starts with the behaviour of MNEs in terms of technology transfer. According to Hymer (1976), MNEs are more productive because of their superior organization and production techniques. These transnational firms transfer their technological advantage to subsidies they create abroad. Support for this idea is also found in Dunning (1993) and Blomstrom and Kokko (1998)who consider FDI technology spillovers as basically a concept that embodiesMNEs’own technology transferred to their subsidies.Through this process,MNEsinternalize technology and limit the extra cost they would incur when technology is externalized. By creating affiliates, MNEs also improve control over FDI technological spillovers (Caves, 1996).
It bears mentioning that externalities are possible if the knowledge spilling over has a public good nature. Under this strong hypothesis, FDI technology spillovers are diffused in horizontal or vertical schemes from foreign affiliates to local firms, the latter will adapt technology in a mimetic fashion to their specific needs in order to sustain competition. In all circumstances, the technology transferred would take different forms including product and process technology, distribution technology, management and marketing capabilities (Lall, 1997).
However, as pointed out by Kinoshita (2001), FDI technology spillovers seem to be more complex than their simple definition. In fact, empirical findings suggest that these spillovers are not automatic and depend on country specific factors, policy environment, sector specificities and local firm characteristics. Consequently, one should examine in some details the main channels that contribute to the occurrence of FDI technological spillovers and the determinant factors allowing their exploitation.
Crespo and Fontoura’s (2007) survey on FDI spillovers describes five channels allowing spillovers to occur: demonstration/imitation effects, labour mobility, export activity, competition, and backward and forward linkages of foreign firms with domestic firms. Beginning with the demonstration/imitation effects channel, it is assumed that if a technology is costly to develop by locals firms while foreign firms are already using it successfully, local firms will be encouraged to adopt this technology particularly when both local and foreign firms produce the same goods. Concerning labour mobility, this channel is supposed to enhance FDI spillovers if local firms have the possibility to hire skilled workers previously working in foreign firms. The effectiveness of this channel depends however on the wage gap between foreign and local firms. Local firms will not be able to benefit from labour mobility if the wage gap is high. A third channel from which a local firm would benefit more FDI spillovers is export activity. As has been demonstrated in Aitken
The last channel is related to backward and forward linkages between foreign and local firms. These linkages are assumed to contribute not only to more FDI spillovers but also to local firms’ efficiency. In the particular case of backward linkages, FDI technology spillovers are assumed to be vertical in nature. Moreover, Javorcik (2004b) assumes that this type of linkage should exist because MNEs have normally no incentives to prevent technology diffusion to their input suppliers. Following Lall (1978, 1980) and Dunning (1993), backward linkages refers to the relationship between local firms considered as input suppliers and foreign firms supposed to be their customers. For the authors, backward linkages induce FDI technology spillovers and enhance local firms efficiency in several ways: through scale effects as foreign firms increase their demand for local inputs, through technical, organizational and managerial support given by foreign firms to local firms in order to increase their quality of inputs and through competitive pressures incurred by local firms motivated by the opportunity to be an exclusive input supplier to foreign firms. FDI technology spillovers resulting from forward linkages are nevertheless more complex to evaluate as they depend on the way high quality inputs sold by foreign firms affect the cost structure of local firms using these inputs (Javorcik, 2004b).
After describing the channels underlying FDI technology spillovers, we should nowfocus on the arguments dealing with the ability to internalize these spillovers. The main arguments discussed are the following: absorptive capacity of local firms and technology gap between foreign and local firms; domestic firms’ characteristics, FDI characteristics and policy environnement.2
Following Narula and Marin (2003), absorptive capacity includes the ability of local firms to internalize knowledge created by others. Since R&D expenditures is the common measure of firms’ absorptive capacity, this means that the ability of local firms to exploit spillovers must be sustained by a learning process, which is one of the two faces of R&D.3
In the case of some developing countries and particularly in Tunisia, local firms do not engage enough in R&D.4 Hence, a majority of local firms relies mainly on qualified workers to develop their absorptive capacities. However, as pointed out by Findlay (1978) and Wang and Blomstrom (1992), absorptive capacity of local firms could not be sufficient if the technology gap between local and foreign firms is high. Technology transfer would happen if a moderate technology gap exists between local firms and MNEs. Otherwise, local firms will not be able to integrate high technology developed by foreign firms.
Let us turn now to domestic firms’ characteristics. Export capacity and size of local firms are assumed to be determinant factors for a greater capacity to absorb foreign technologies. When local firms are exporters, their ability to absorb foreign technologies is enhanced by international competition (Costa&de Queiroz, 2002).With regard to the size criterion, it is expected that large size firmswill probably benefit more from the presence of foreign firms compared with small firms, the latter will be less motivated by technology imitation since their production scale is low (Aitken & Harrison, 1999).
The third argument related to FDI technology spillovers integration is more specific to FDI characteristics. Nationality of investors, entry mode and the degree of FDI ownership are supposed to affect the intensity and the quality of FDI technology spillovers benefiting local firms. According to Javorcik
Trade policy is another argument that deserves a deeper analysis since it represents one of the environmental factors conditioning FDI technology spillovers.6 Trade policy argument also called ‘the Bhagwati hypothesis’ refers essentially to the contribution of outward oriented trade regimes to the attractiveness of FDI. The more a host country is opened to trade, the more it will attract foreign investors looking for markets free from distortions (Bhagwati, 1978, 1994). Since an opened economy is assumed to attract more FDI,we could assert that FDI technology spillovers will probably be important in this case. In his empiricalwork on Thai Manufacturing Industries, Kohpaiboon (2006) confirms this assertion and concludes that an open policy trade going hand in hand with a liberalized foreign investment regime maximizes FDI technology spillovers. But does this mean that inward oriented trade regimes will prevent the benefit of these spillovers? According to Kokko
1For Aitken and Harrison (1999), the competition effect would also generate an opposite effect on local firms’ efficiency. According to the authors, a ‘market stealing effect’ could be induced by the entry of foreign firms. In such circumstances, local firms will be crowded out from the market or at least loose a large part of their market share. Hence, local firms’ production scale will be reduced and their technical efficiency will decrease. 2Following Audretsch and Feldman (1996) and Crespo and Fontoura (2007), regional effects are to be considered as a determinant factor for FDI technology spillovers. The argument is based on the distance effect explaining both inward FDI and international trade. We consider that, in the Tunisian case, regional effects do not play so strongly since 80% of Tunisian FDI inflows come from the European Union. It is worth noting that the predominance of European investments in Tunisia is quasi structural. Geographical proximity but also cultural and language proximity explains European inward FDI in Tunisia. Moreover, the preferential trade agreement signed in 1995 by Tunisia and the European Union has reinforced Tunisian inward FDI coming from this region. 3In Cohen and Levinthal (1989), R&D is not only considered important for innovation but also for learning. 4Even though R&D spending in Tunisia reaches 1.25% of Tunisian GDP in 2009 and it is projected to reach 1.5% in 2014. 5The authors found a positive association between American and Asian company’s presence in downstream sectors in Romania and the productivity of Romanian local firms in the supplying industries. The same correlation turns out to be negative when European investors are present in downstream sectors. These results are mainly attributed to the preferential trade agreement signed by Romania with the European Union. The agreement gives incentives to American and Asian investors to use Romania as a platform country in order to comply with the rules of origin for their sales on the European market. In these conditions, the nationality of investors creates a greater potential for FDI spillovers. 6Beside trade policy, intellectual property protection (IPP) is another determinant environmental factor that affects FDI spillovers. Depending on IPP, foreign investors will decide whether they will invest in local production (high IPP) or reduce their investments to a simple distribution presence (low IPP). In the latter case, few or negligible FDI spillover will be induced. Moreover, foreign firms’ entry in a host country will depend on the guarantee offered by local authorities concerning the respect of intellectual property rights. As explained by Markusen, a moral hazard problem arises when the MNE hires a ‘local agent’ to represent it in the host country. Since the local agent knows the technology used by the MNE, he could defect to start his own business. This situation could prevent the MNE from adopting a direct implementation in the host country (for more details on these aspects, see for example Markusen, 2001, and Javorcik, 2004a). With regard to the Tunisian case and despite recent efforts made by authorities to comply with the international copyright rules through the implementation of an appropriate legislation, it seems very hard to give any empirical measure specific to the Tunisian IPP.
4. Technical Efficiency Measures and Two-stage Method
Technical efficiency has been measured and interpreted in different ways. The literature offers a large choice of methodologies, each one with its strengths and weaknesses. In their discussion on core methods, Kalirajan and Shand (1999) regrouped them in three major approaches: programming or deterministic, statistical or stochastic and Bayesian methods. In all these approaches, the frontier concept is used to define firm-specific technical efficiency for a group of firms using the same technology, assuming firm’s technical efficiency to be related to its own potential. Two important points emerged from their literature review and the comparative studies performed by Gong and Sickles (1992) and Kalaitzandonakes
The choice of the DEA approach in our work is motivated by the two-stage empirical method we use to evaluate the impact of FDI and other environmental variables on firm’s technical efficiency.The two-stage method,which is commonly adopted in many empirical studies, consists of DEA estimated technical efficiency scores for each firm

where

denotes DEA estimated efficiency score of firm
However, as pointed out by Simar and Wilson (2007), a serious problem in all of the two-stage studies adopting equation (1) arises because

estimated in the first stage are most likely serially correlated for finite samples. This serial correlation is explained by the fact that perturbations of observations lying on the estimated frontier induce changes in efficiencies estimated for other observations. The bias on

is defined as follows:

with

denoted

with:

where
is the estimated bias of efficiency measures. Maximumlikelihood estimation yields consistent estimates of

5. Tunisian Firms Case: Sample Representativeness and Description
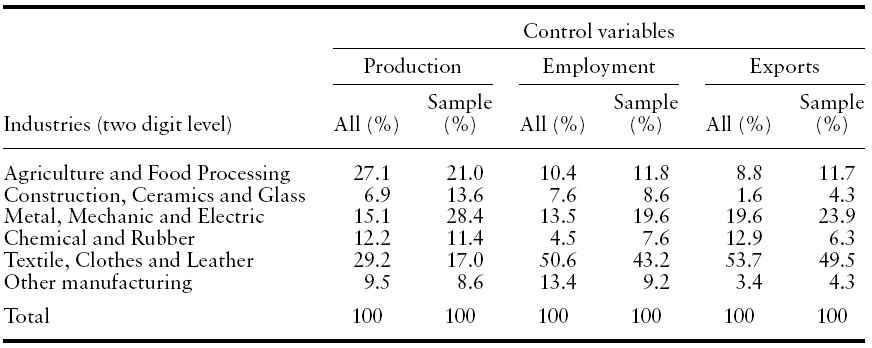
To evaluate the contribution of FDI to Tunisian firm’s technical efficiency, we use data derived from the annual national survey on enterprises realized by the Tunisian National Institute of Statistics (INS). The sample reduces to 674 manufacturing firms for which observations are available over the whole period 1997–2001 (balanced panel). As shown in Table 1, the sample is quite representative of the Tunisian manufacturing sectors with regard to control variables such as production, employment and exports.
It is worth noting that the theoretical application of the quotas method means that the sample should be formed according to the importance of each industry with regard to control variables defined and evaluated with respect to overall manufacturing industries (‘All %’). The fact that our sample distribution (‘sample %’) does not exactly coincide with the theoretical distribution is due to the unavailability of key variables for some firms in the original INS sample, which obliged us to eliminate them.
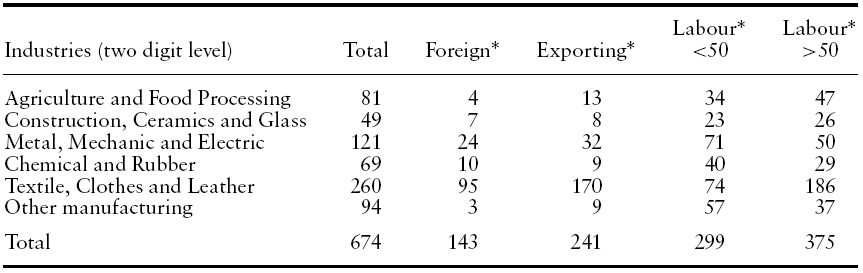
As reported inTable 2, firms belonging toTextiles, Clothing and Leather (TCL), and Metal, Mechanics and Electrics (MME) are predominant in our sample. For the objective of this paper, this predominance is logical because these two industry sectors are characterized by important FDI inflows: in 2001, the amount of FDI inflows was respectively 75.2 million DT and 79.8 million DT forMMEand TCL which corresponds to circa 60% of total FDI inflows realised for the same year.7
[Table 1.] Sample representativeness (mean value of control variables over the period 1997?2001)

Sample representativeness (mean value of control variables over the period 1997?2001)
[Table 2.] Sample distribution (674 firms)

Sample distribution (674 firms)
Firms included in the sample are considered as foreign if foreign equity participation reaches 10% or more following IMF definition of foreign-owned firms (IMF’s Balance of Payments Manual, 1993). As our data is of panel type, this definition will be applied on a year-by-year basis. It is important to note that over the period considered in this study and for some firms included in the sample, changes were observed with regard to foreign capital presence. Hence, between the beginning and the end of the period, some firms keep their initial status as locals or foreignwhile others move from one status to another, becoming locals in some periods or foreign in others.8 This foreign capital dynamic should be taken in account in order to see how it affects Tunisian firms’ technical efficiency.
7According to data provided by Tunisian Foreign Investment Promotion Agency (FIPA). 8The number of foreign firms moved from 124 in 1997 to 137 in 2001. At the same time, the number of local firms moved from 550 in 1997 to 537 in 2001.
6. DEA Technical Efficiency Scores Estimation (First Stage)
In their basic presentation, DEA technical efficiency measures involve the following assumptions: a production technology may be defined using the output set, P(

The output distance function is defined on the output set, P(

The distance function,
[Table 3.] DEA annual mean technical efficiency scores (TES) by industry
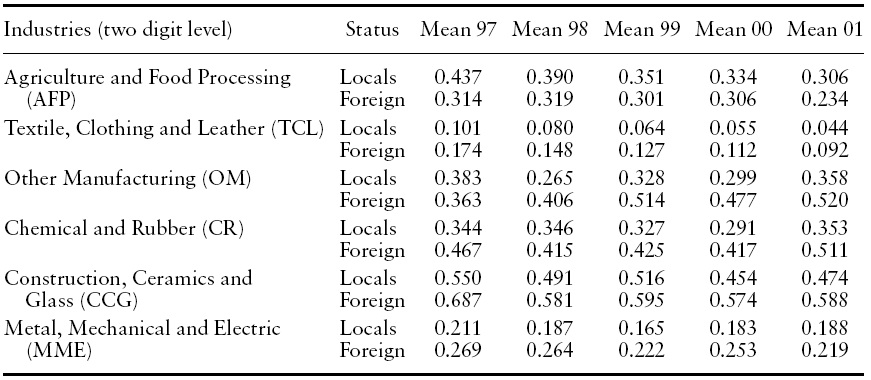
DEA annual mean technical efficiency scores (TES) by industry
In our DEA efficiency scores measures (output oriented), firms are assumed to produce a single output using two inputs: capital and labour. Variables corresponding to output and input measures are respectively real production (RP), capital stock (KS) and labour (L). These variables are defined in the Appendix.
Before estimating efficiency scores, we proceed first by detecting possible outliers using the semi-automatic procedure recommended by Simar (2003). The principle of order
Except for AFP, Table 3 indicates that over the period of estimation, foreign firms are, on average, more efficient than local firms. Moreover, looking at the mean values of technical efficiency, some differences exist across industries. Mean scores are, for example, very low in TCL and this is probably due to the quality of FDI in this industry, particularly in the clothing subsector. As mentioned in a report made by Chaponnière and Perrin (2005) for the Tunisian textile industry, only Benetton Multinational could be considered as a high-quality FDI greenfield investment, the other foreign investors in this branch are essentially small business affairs made by old migrants coming from Europe. High mean efficiency scores observed for CCG could be attributed to the intensive privatization program of public cemeteries during the period considered. According to Table 3, it is also interesting to note that for most of the industries, the presence of more efficient foreign firms has a positive influence on local firms’ efficiency.
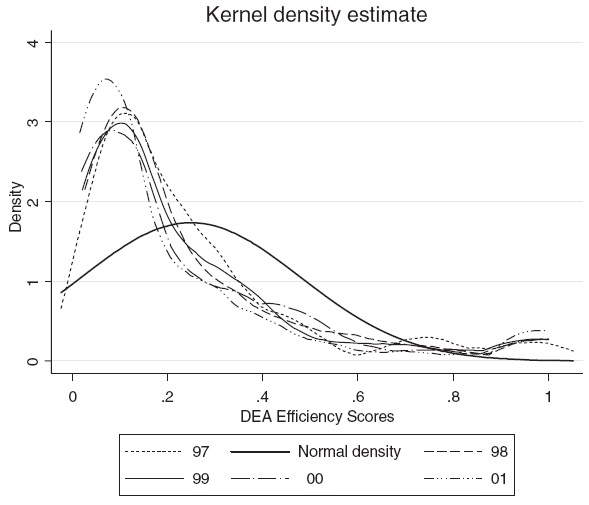
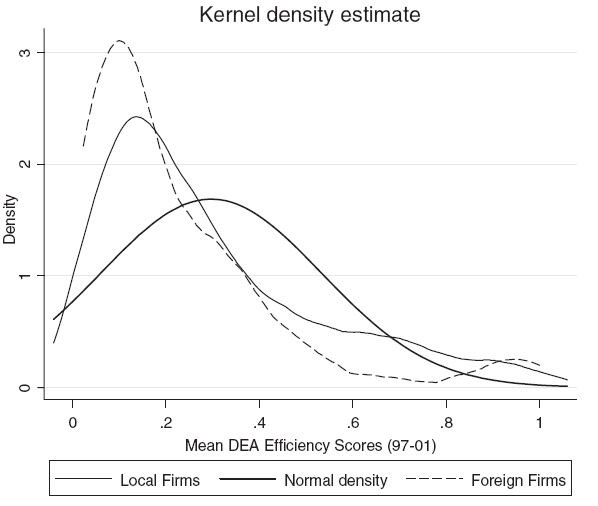
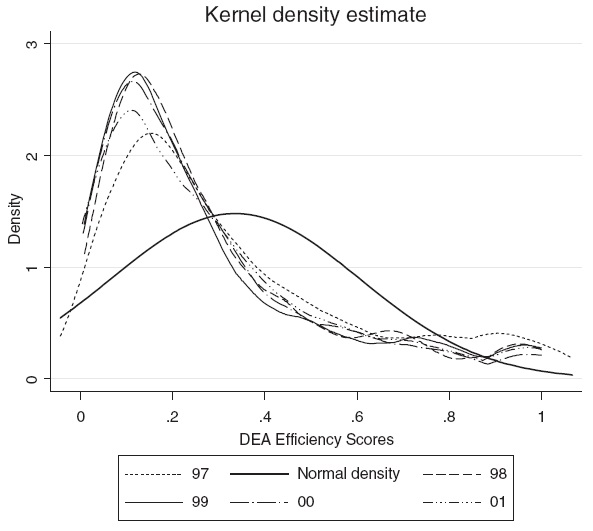
Going over the mean efficiency scores analysis, which could be insufficiently informative, a firm-oriented analysis of technical efficiency scores is performed through the exploitation of dynamic technical efficiency scores. Figures 1 and 2 present the dynamic of kernel density estimates of local and foreign firms’ efficiency scores in Tunisian manufacturing over the period 1997–2001. Surprisingly, these two figures contradict our expectations.
Hence, the dynamic of technical efficiency scores does not seem to be so different between locals and foreign. Moreover, some kernel density curves indicate that low technical efficiency firms are concentrated in a quasi similar fashion both for locals and foreign. Comparing kernel density of mean technical efficiency scores between locals and foreign as shown in Figure 3 leads us to the same conclusion. These findings could be explained by the strong presence in our sample of firms with low efficiency scores belonging to TCL and MME industries. However, our dynamic analysis of kernel density of efficiency scores would be more accurate if conducted particularly on TCL and MME subsectors taken separately, as we found strong differences in mean efficiency scores between Clothes (low scores) and Leather (high scores) TCL subsectors, and Metal (low scores) and electric and electronic (high scores) MME subsectors.10
9To estimate order m output efficiency scores and the corresponding standard deviation values for different values of m, we adopt the Matlab program proposed by Simar in the appendix of his article. As the exercise is hard to perform for panel data, order m output efficiency scores were computed on mean values of the basic variables (output and inputs). Matlab 6.0 was used and a specific algorithm was defined for re-sampling in order to realize the Monte Carlo loop. 10To avoid overloading the paper with detailed results and graphics, we decided to limit our presentation to a more aggregated analysis.
7. Technical Efficiency and FDI: Panel Data Estimates (Second Stage)
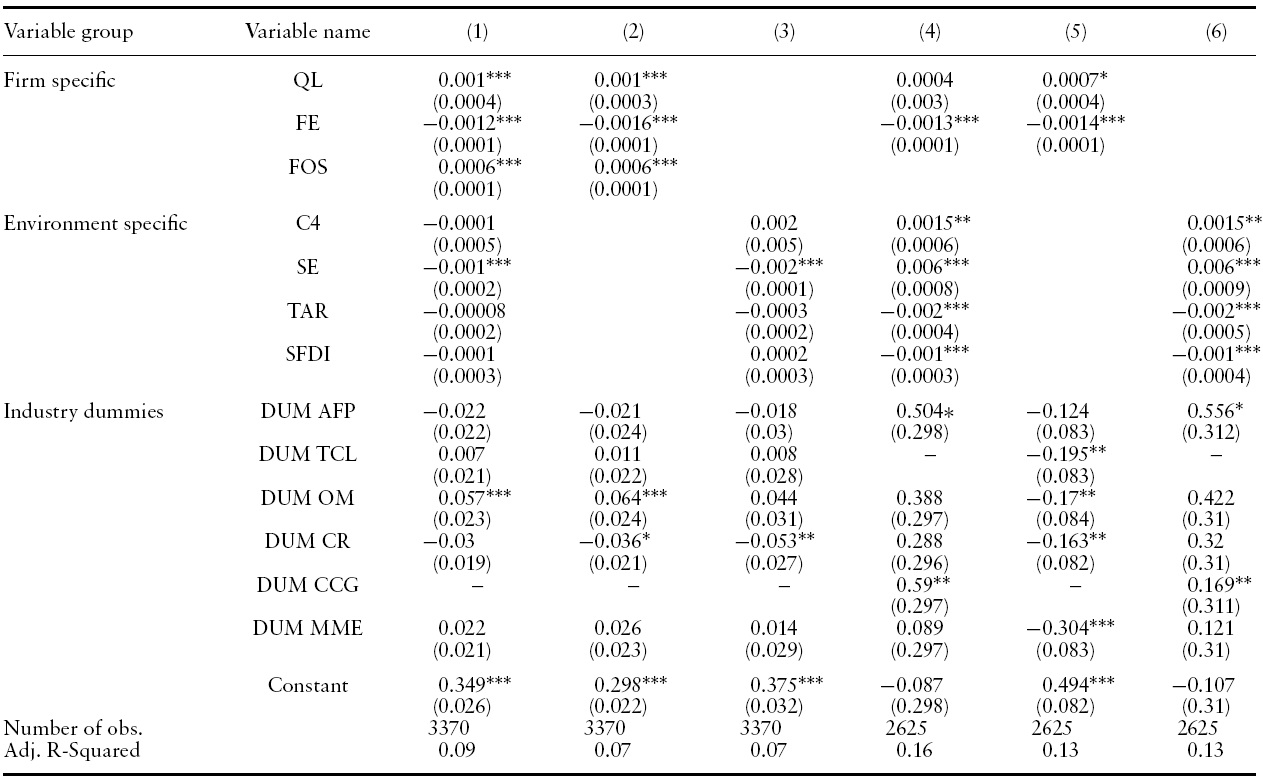
Second-stage econometric investigations are based on the estimation of equation (4) as expressed above. In our work, the bootstrap procedure is applied on the following model:

with
As reported in Table 4, six models are considered with models 1, 2 and 3, including the overall sample, while models 4, 5 and 6 include only local firms. Initially, all the variables are introduced (firm and environment specific). When the entire sample is considered, the results obtained indicate that absorptive capacity as measured by qualified labour significantly enhances technical efficiency, although an explicit measure of technology capabilities (like R&D) is not introduced. 11 Moreover, FDI presence as a firm specific spillover variable appears to be the determinant for technical efficiency. This result corroborates the findings of Blomstrom and Sjoholm (1999) concerning the degree of foreign ownership as an FDI technology spillover vector. However, some counterintuitive results are obtained. This is particularly the case for export activity variables both at the firm and sectoral level.The negative and significant sign associated with these variables in models 1, 2 and 3 could be explained by some arguments developed in Clerides
When considering only local firms such as in models 4 and 6, sectoral exports turn out to be positively and significantly correlated with technical efficiency.This result, previously validated in Aitken

FDI and technical efficiency: bootstrap estimates (1000 replications). (DEA Technical Efficiency Scores (TES): dependant variable)
The last hypothesis we test is the Bhagwati hypothesis. As models 4 and 6 show, tariff reduction exerts a positive and significant effect on Tunisian firms’ technical efficiency. However, this result should be interpreted with some caution for two reasons: the tariff dismantling calendar, which started in 1997,14 has contributed to higher effective protection as tariff reduction had firstly concerned intermediate and capital goods imported from European trading partners. In this case, improved technical efficiency of local firms should be interpreted as resulting fromthe use of modern technologies imported at a lower cost. Moreover, models 4 and 6 do not indicate to what extent European investors has been preferring Tunisian tariff reduction over other investment opportunities offered by Central Europe countries during the period 1997–2001. We think that deeper investigations on this aspect are crucial for a better interpretation of the Bhagwati hypothesis in the Tunisian case.
11Qualified labour also enhances firms’ technical efficiency when only local firms are considered but to a lesser extent (see model 5). 12According to the authors, low competitive firms could export and continue to pass through the international market ‘screen’ as long as they don’t reach a maximum costs threshold ‘not tolerated’ by this market. When this threshold is reached, these firms will be excluded. 13In the sense of Ekholm et al. (2003). 14Two years after the preferential trade agreement signed with the European Union.
In this paper, we proposed a two-stage empirical method to check for the robustness of FDI impact on Tunisian firms’ technical efficiency. Second-stage bootstrap estimates lead us to validate the contribution of FDI presence at the firm level as a technology spillover source while horizontal FDI spillovers are not evidenced. Further investigations on the learning process underlying the exploitation of FDI technology spillovers at the firm level will allow us a better understanding of technology diffusion process inside Tunisian firms. Further investigations are also needed, especially for vertical FDI spillovers as in recent years, and for some industries, such as the automobile industry, Tunisian firms are becoming increasingly privileged input suppliers for prestigious multinationals operating in this domain.
Taking into account the fact that FDI contribution to technical efficiency is more evident in sectors where organizational capabilities of local firms already exist, the Tunisian Industrial Restructuring Program15 intervention should then target sectors characterized by a great potential of FDI attractiveness but where, unfortunately, local firms are lacking absorptive capabilities. Developing these capabilities with the help of this National Programwould make it easier to attract strategic FDI.
In a broader sense, it is also the Tunisian fiscal incentives policy that should be reviewed because this policy has shown its limits in some cases. A notable deviation of this policy is the behaviour of some foreign investors engaging just for the fiscal ‘privileges’ and leaving the country after the period of ‘grace’. In the Tunisian textile industry, such behaviours exist. It may therefore be time to rethink the fiscal incentive mechanism specific to FDI promotion.
15Launched in 1996.