The last century witnessed a marked change that the world shipbuilding industry underwent as its centre of gravity gradually shifted from European dominance to the Asian battlefield where South Korea, Japan and China gained an increasing market share as major players in terms of delivery.
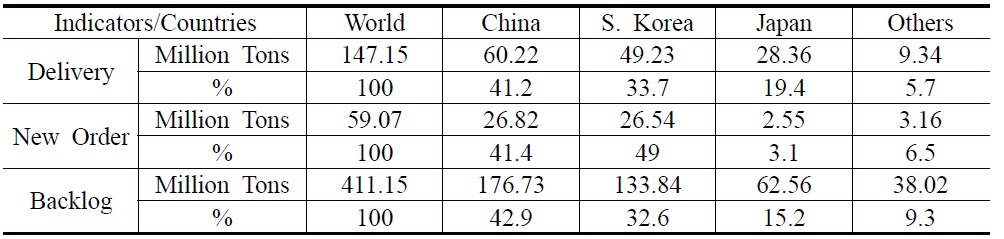
[Table 1] Three Indicators of World Shipbuilding from Jan. to Nov. in 2011

Three Indicators of World Shipbuilding from Jan. to Nov. in 2011
With the EU’s slide down the largest shipbuilding country list, the top three shipbuilders as shown in Table 1 have been the honey that attracts the major ship owners in recent years.
Europe is the originator of the world shipbuilding industry and has dominated the market for almost five decades. However, its leading position was challenged successively by Japan and South Korea thanks to their economic boom. What’s more, China is also not lagging behind and is catching up as a dark horse in the shipbuilding market, showing a rapid increase in shipbuilding output, which in turn will challenge the top-slot positions of Japan and Korea. In this context, the top three shipbuilding countries are still vying with each other for global leadership in this competitive sector. As such, it is imperative that research be carried out to compare the shipbuilding competitiveness of the three countries in a systematic and comprehensive manner.
The objective of this paper can be three fold. To begin with, a myriad of data and information in the extant literature is old fashioned as the current situation is changing on a daily basis and presents itself as a complicated one. On this point, the research can refresh the database and fill a gap in the shipbuilding literature. Secondly, this research proposes a scientific methodology for a shipbuilding competitiveness assessment and contributes to maritime studies by generalizing the approach above and beyond this study. Last, but not least, the research aims at revealing the strengths and weaknesses of the top three shipbuilding countries which serve as references for the decision making of ship owners and also as mirrors for the shipbuilders to benchmark their competitive positions in the world shipbuilding market and better establish their development strategies in this key period of development.
Structured around the three principal objectives, the paper is organized with Section II spreading out a holistic literature review after this introductory part. Section III presents a generic research methodology with a focus on its implementation steps, followed by a case application in a shipbuilding competitiveness evaluation in Section IV. Last comes Section V in which the discussions and conclusions will be given.
The shipbuilding business, as a dynamic and complex industry, not only appeals to aggressive entrepreneurs and speculative investors, but also attracts a number of scholars wishing to unveil its mysterious cover. However, only a handful of literature pertaining to shipbuilding ever made a record and can be amassed to facilitate the research in such a field. Stopford (1997) depicts it as, in terms of shipbuilding economics, a heavy engineering business which entails a substantial capital investment and a high level of technical expertise to design and produce a merchant ship.
Since as early as the 1930s, the shipbuilding business cycle has been studied by Tinbergen (2006), which remains an influential and classical model in the economic literature. He referred it to the dynamics of business cycles albeit the cycle phases have been unbalanced since the Second World War. However, it cast light on one characteristic of the shipbuilding industry - volatility. Dougan (1975) even made a similar statement and the essence of such an opinion was also echoed by Volk (1994), holding the viewpoint that shipbuilding is characterized by heavy fluctuations of demand over the short-term and by the high inertia of supply. This fact leads to a brief phase of prosperity and long phases of depression.
The shipbuilding domino effect has been observed by the industry as the types of ships and the yards building them are widely different. However, the prices of different types of ships tend to co-move over time. This shows the information transparency of the shipbuilding market, namely, a perfectly competitive market put forward by Dikos (2004). As Dobler (1993) studied, the shipbuilding business is perceived as inseparable from other maritime markets, namely the freight, second hand tonnage, scrapping and insurance markets. Jiang et al. (2012) employ a principal component regression analysis to investigate the price formation of Chinese dry bulk carriers based on historical shipbuilding contract prices. The results from their study indicate that the time charter rate has the most significant positive impact on shipbuilding price.
With the elapse of the UK’s commanding position in the shipbuilding market, the current scene has been dominated by three major players accompanied by their increasing market share in recent years, all coincidentally in the Far East–South Korea, Japan and China. Specifically, several scholars with great interest have explored the beauty of these three shipbuilding countries as the rising roles caught their eyes. Stopford (1997) noted the British sliding position in the shipbuilding market and the robust development in Japan and S. Korea. He also noticed China, the rising star in the shipbuilding industry. Bruce
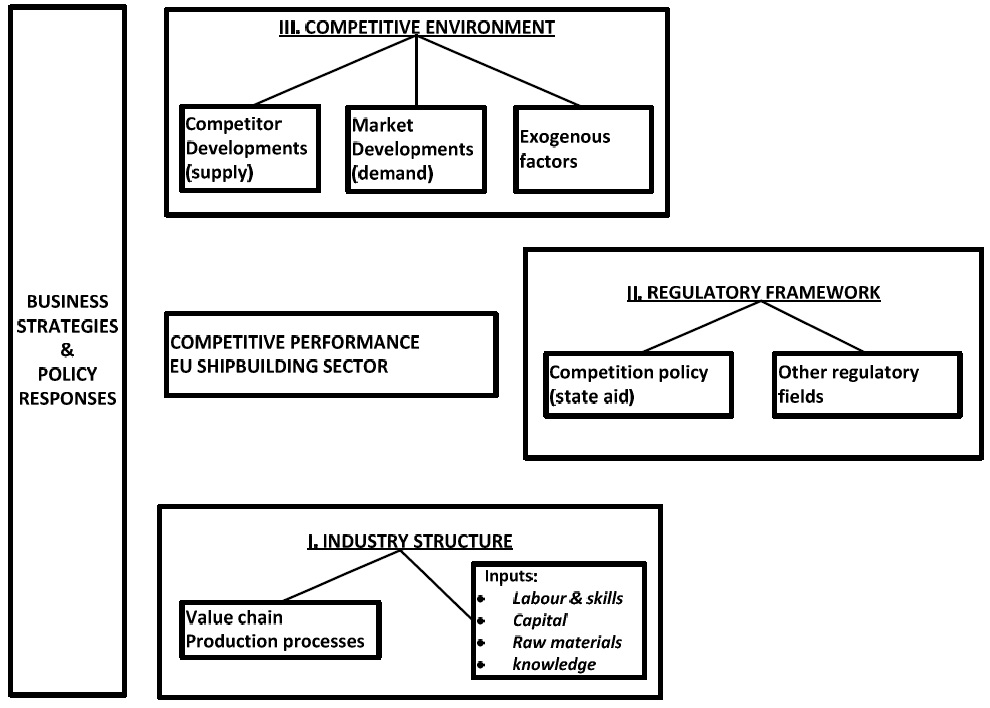
However, any specific methodology applicable to the shipbuilding industry is quite rare in academic circles. Notably, the ECORYS Research and Consultancy presented a schematic framework for a competitiveness analysis of the European shipbuilding and marine equipment sector (shown in Figure 1), which can be generically summarized into three main blocks affecting the competitiveness performance of the EU shipbuilding industry: industry structure, regulatory framework and competitive environment. In addition, input-output analysis was employed to examine the role of the maritime industry in the national economy of South Korea for the period 1975-1998, as studied by Kwak
These few but focused findings provide a traceable reservoir of references, paving the way to this comparative study. However, the extant literature with regards to the shipbuilding industry almost becomes a legacy since most of them are comparatively old, and in particular, the data does not seem robustly convincing if put into the present research. Moreover, few fruitful and authoritative discussions of the current top three shipbuilding countries can be seen. This may be attributable to the lack of complete statistics and difficulty of making a valid multinational comparison. In view of the above limitations, the specialized academic field still needs substantial research. This paper seeks to bridge this gap and to shed light on the recent developments in the shipbuilding market by placing immediate emphasis on the three major shipbuilding countries in the following sections.
The AHP developed by Satty (1980) is a method for organizing and analyzing complex decisions. It aims at quantifying relative priorities for a given set of alternatives on a ratio scale, based on the judgment of the decision-maker, and stresses the importance of the intuitive judgments of the decision-maker as well as the consistency of the comparison of alternatives in the decision-making process. When finding the best choice of decision alternatives subject to a number of different criteria, AHP is a well-known and frequently used method (Ramanathan et al., 1995; Frei et al., 1977). It has particular application in group decision making, and is used around the world in a wide variety of decision situations, in fields such as government, business, industry, healthcare and education. The strength of this approach is that it organizes tangible and intangible factors in a systematic way, and provides a structured yet relatively simple solution to decision-making problems (Skibniewski et al., 1992). Furthermore, by decomposing a problem logically from the large issues to small, descending in gradual steps, one is able to connect the small to the large through simple paired comparison judgments.
As a result, AHP helps policy makers and shipbuilders find out the most competitive shipwright and their understanding of the shipbuilding market, by focusing on applying the AHP to the specific topic. It provides a comprehensive and rational framework for structuring the problem of shipbuilding competence, for representing and quantifying its criteria and sub-criteria, for relating those criteria contributing to the ultimate goal, and for evaluating the relative merits of shipbuilding members in a set of alternatives.
In general, the AHP approach consists of the following steps with a view to solving complex decision problems.
1. Define the Problem and Build up the Hierarchy
The AHP procedure starts with modeling the problem as a hierarchy containing the decision goal. When it comes to resolving problems in any discipline, it is better to have a clear idea of the problems to spell out the core issue and the alternatives for reaching it. To attain the specific objective, key indicators are selected as the decision criteria in a reasonable manner. As such, the hierarchy can be properly structured from the top (the desirable objective) through the intermediate levels (criteria on which sub-sequent levels depend) to the lowest level.
It is self-explanatory from the above that shipbuilding competitiveness has set itself as the core issue of this paper. Competitiveness, as the name implies, is a comparative concept to evaluate the ability and performance of a person, firm, sub-sector or country in a given context. When discussed against the background of the shipbuilding industry, the criteria of competitiveness differ among academicians.
As a pioneering scholar in the shipping sector, Stopford (1997) put forward six key variables as vital influences on shipbuilding competitiveness–material supply, facilities, skilled labour, wages, labour productivity, exchange rates and in some cases, subsidies also count. In the commercial shipbuilding industry, competitiveness can be represented from different aspects, such as cost, delivery time, quality, after-sales services and financing conditions, suggested by Bertram (2003), Goldan (1995) and Rashwan
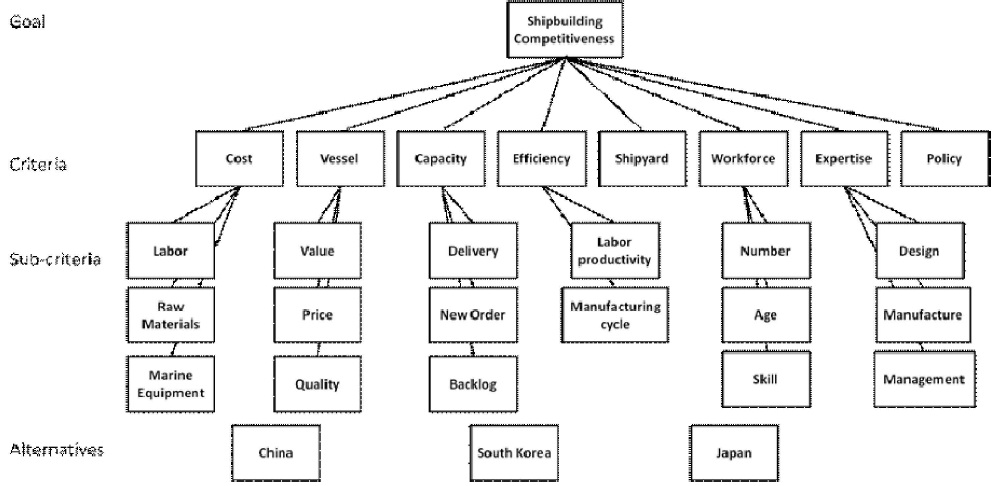
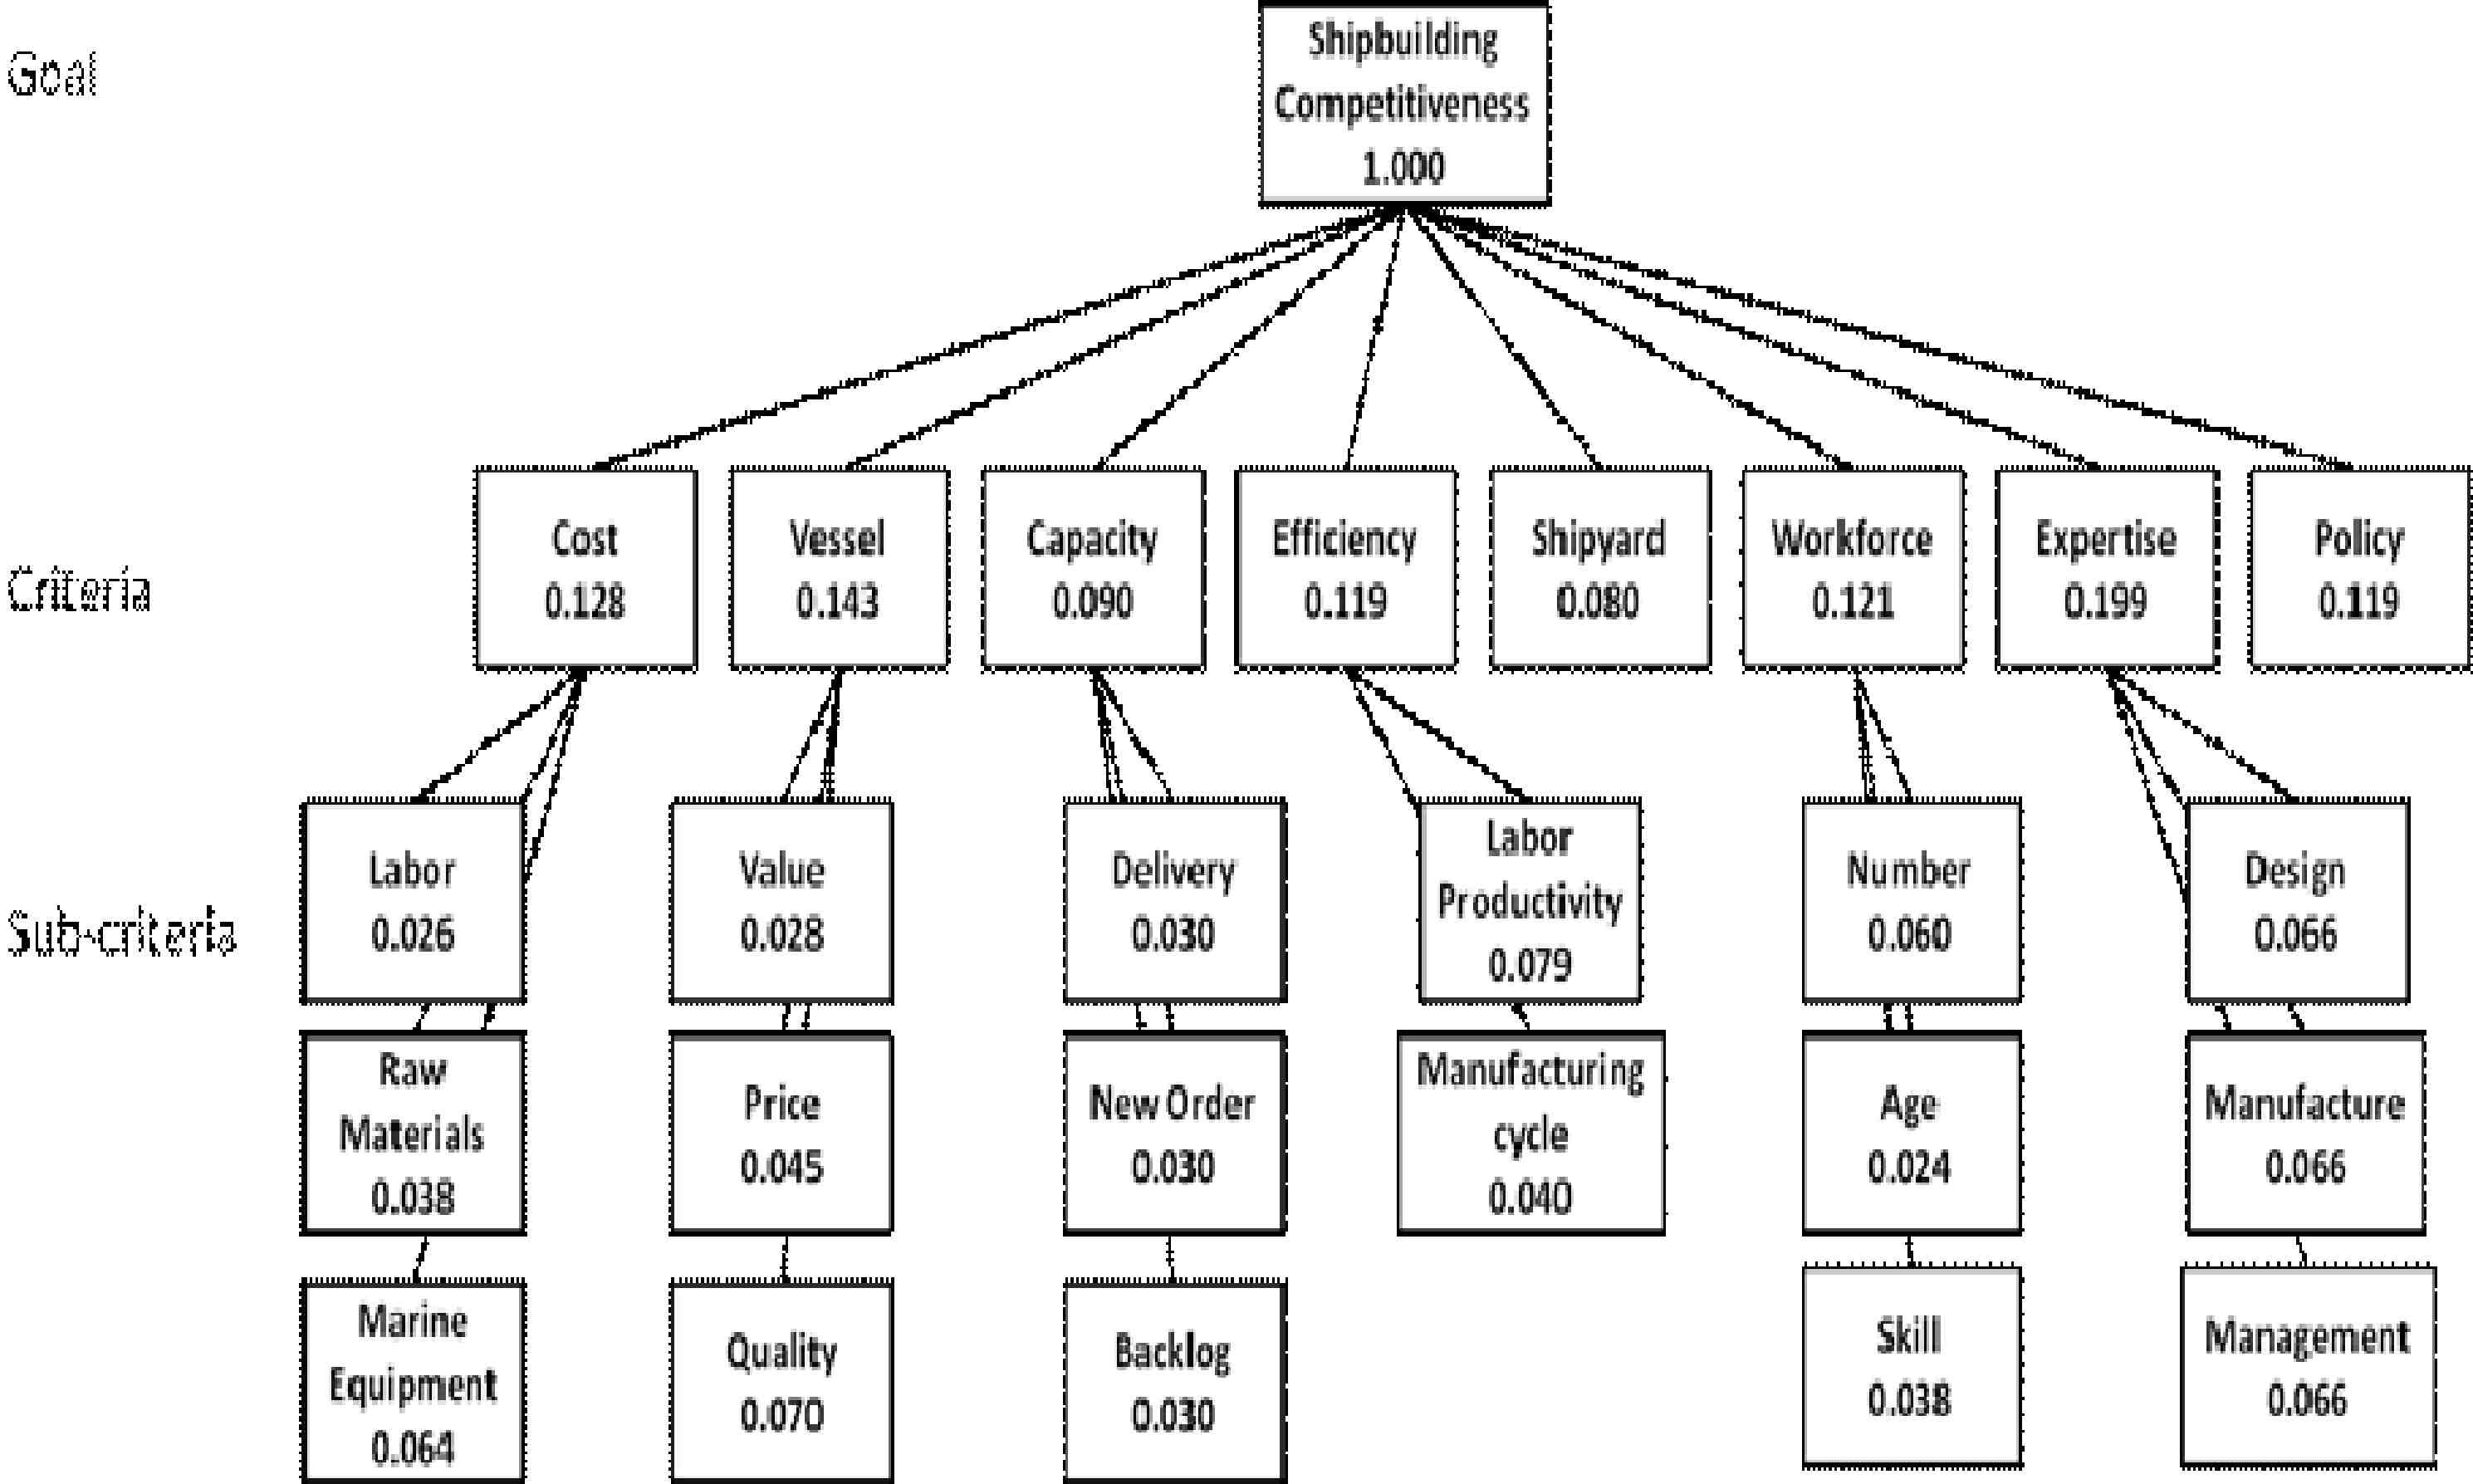
Building on the previous literature review, eight critical success factors are screened as the shipbuilding competitiveness criteria–cost, vessel, capacity efficiency, shipyard (scale), workforce, expertise and policy in terms of their contributions. On a lower level, each critical factor is supported by several subfactors. In addition to the support of the enriched literature review, five experts have been carefully selected to undertake the survey and affirm the selection of the criteria and sub-criteria. The experts with extensive experiences in the area under investigation include a manager from a renowned ship owning company in HK, some newbuilding managers and directors of shipping firms based in HK and Singapore and a distinguished scholar in maritime studies from HK PolyU. The factor selection process spans several months and involves a combination of literature review and expert opinions. On that basis, eight critical success factors are identified as a consensus to influence the shipbuilding competence and thereby the hierarchy can be structured as shown in Figure 2.
1) Determine the Criteria Weightings
Guided by the hierarchy, the relative importance of these criteria (both the criteria and sub-criteria levels) are evaluated with pair-wise comparisons. These criteria were selected from the literature review and weighting was ranked by expert interview results during the China Shipbuilding Forum 2011: a Dialogue with Hong Kong Ship Owners. As the name implies, the method refers to any process of comparing entities in pairs to judge which one is preferred, or has a greater amount of some quantitative property. Through comparison and calculation among different factors, the weightings of each criterion will be obtained, thus giving a clue to the optimal option. The implementation steps are separately discussed below.
(1) Set up the pair-wise comparison matrix
At the very beginning, a decision matrix is established by taking into consideration the relative importance of criteria concerned in the same level against some criterion in the upper level. In the course, the decision-makers have to indicate preferences or priorities for each decision criterion, with the aid of a pair-wise comparison scale ranging from 1 to 9 as shown in Table 2.
[Table 2] Pair-wise Comparison Scale for AHP Preferences
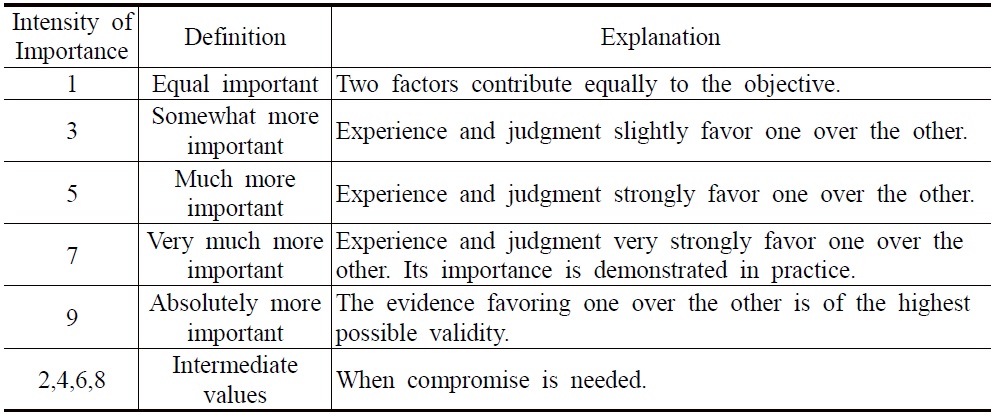
Pair-wise Comparison Scale for AHP Preferences
After these pair-wise comparisons are carried out for all criteria to be considered, the matrix is completed in the form of Table 3, noted as Matrix B (size n×n), where bii=1 and bji=1/bij(i, j=1,2,3 … n). It is worth noting that bij in the Matrix B shall be rated in line with information and data, opinions from experts and analysts’ experiences as the consistency of the mindset is vital to the application of the AHP approach.
[Table 3] The Standard of Pair-Wise Comparison Matrix for Experience
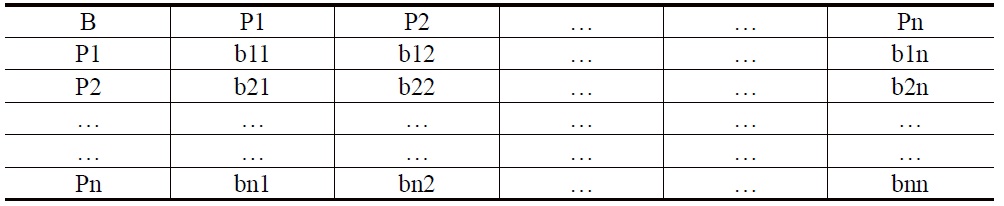
The Standard of Pair-Wise Comparison Matrix for Experience
(2) Calculate weighting vector
The weighting vector, indicating the priority of each element in the pair-wise comparison matrix in terms of its contribution to the overall risk, can be obtained by a synthesization procedure, according to Anderson
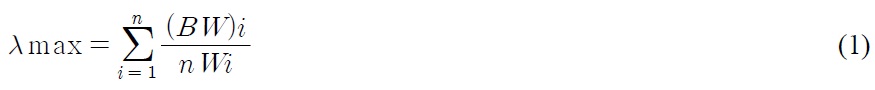
where n represents the matrix size, W=(W1, W2…Wn)t stands for the weighting vector of a specific element in the pair-wise comparison matrix and i=1, 2 … n. Here Matrix B particularly refers to the original one instead of the synthesized one. (BW)i refers to the result of Rowi in Matrix B being multiplied with W and nWi of matrix size being multiplied with Wi.
(3) Check the consistency
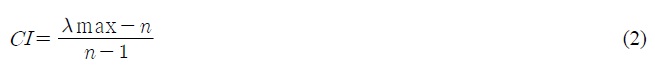
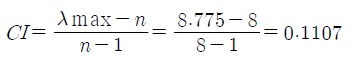
Given the importance of consistency, it is crucial to examine the pair-wise judgements provided by the decision makers. Having made all the pair-wise comparisons, the consistency is determined by using lmax to calculate the consistency index (CI) which can be obtained using Equation (2).

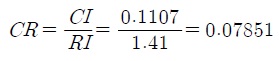
In the next step, a Consistency Ratio (CR) is calculated in Equation 3 to measure how consistent the judgements have been relative to large samples of purely random judgements.
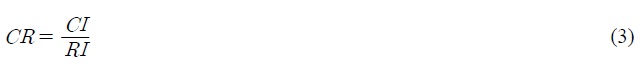
where CI can be obtained from Equation (2) and the value of RI refers to Table 4 in which the upper row is the order of the random matrix and the lower row is the corresponding index of consistency for random judgements.
[Table 4] Average Random Consistency (RI)

Average Random Consistency (RI)
When numerous pair-wise comparisons are evaluated, perfect consistency is difficult to achieve, and some degree of inconsistency could be expected to exist in almost any set of pair-wise comparisons. If the CR is greater than 0.1, the judgements are untrustworthy when the pairs are too close for comfort to randomness and the exercise is valueless or must be repeated. In this regard, judgments should be reviewed and improved to obtain a consistent matrix. Otherwise, the CR is acceptable.
2. Perform Step 2 for All Levels in the Hierarchy
In case the hierarchy contains multiple levels where several sub-criteria may exist under each criterion, Step 2 shall be repeated until the weights of the criteria for all levels are figured out. Two principal concepts apply when a hierarchy has more than one level of criteria: local and global priorities. The former ones represent the relative weights of the nodes within a group of siblings with respect to their parent. The local priorities of each group of criteria and their sibling sub-criteria add up to 1.000 while the global priorities for all the sub-criteria in the level add up to 1.000. They are obtained by multiplying the local priorities of the siblings by their parent's global priority.
Through the above steps, it can be easily observed that deriving numerical weights for each element of the hierarchy allows diverse and often incommensurable elements to be compared to one another in a rational and consistent way, which apparently serves as a distinctive merit of the AHP approach.
In the final phase, the relative ranking of the alternatives under investigation is determined in terms of the criteria of achieving the ultimate goal at the top of the hierarchy. In the process, the targeted alternatives are graded with reference to the authoritative information, still by virtue of pair-wise comparisons. Eventually, the weighting vectors of alternatives under each criterion are sorted out. The relative scores for each criterion under each alternative are multiplied with the relative weights for each criterion. It comes out with the relative scores for each alternative. Based on the results of this process, a final decision can be reasonably reached.
In this section, a comparative study on shipbuilding competitiveness among the top three shipbuilders will demonstrate in a detailed way the case application using the AHP steps addressed in the research methodology.
1. Define the Problem and Build up the Hierarchy
In this research, the problem is to conduct a comparative study among China, South Korea and Japan in terms of shipbuilding competitiveness. The hierarchy for addressing the problem is readily structured and shown in Figure 2.
2. Determine the Criteria Weightings
Since a full set of criteria to the shipbuilding competitiveness have been selected, the next step is to calculate their particular weightings in contributing to the goal. The eight factors may work in a concerted effort, shaping the reversal of the shipbuilding fortunes, but still differentiate from each other delicately in priorities when achieving the objective.
1) Set up the pair-wise comparison matrix
By taking the eight criteria into account, the pair-wise comparisons are performed with the grades ranging from 1 to 9. The results are presented in Table 5. To make the comparison credible, the grading system is reviewed with reference to the previous literature review. What is more, the final grades are also reviewed by the five chosen experts from the shipbuilding sector, as mentioned previously. It is evident from Table 5 that criteria are rated rather close to each other, which to some extent implies the competitive importance among them.
[Table 5] The Pair-wise Comparison Matrix B for Shipbuilding
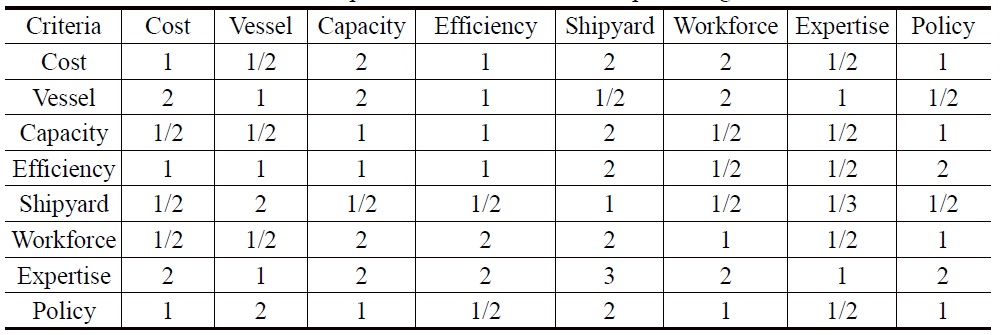
The Pair-wise Comparison Matrix B for Shipbuilding
2) Calculate weighting vector
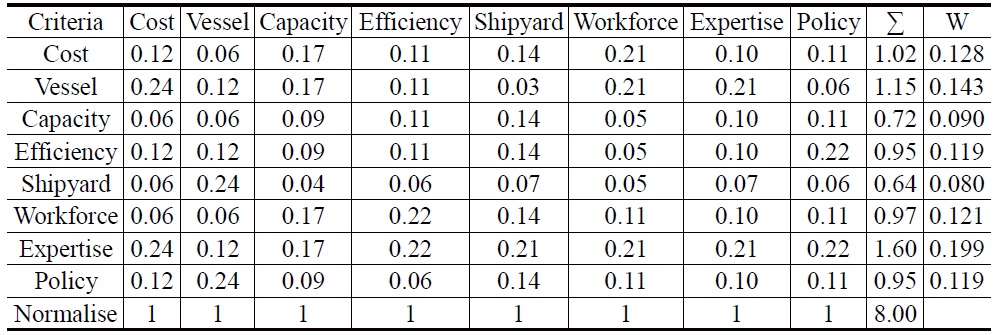
Based on the established Matrix B in Table 5, the column sum of each criterion is needed in the first place for the sake of synthesization to achieve the weighting vector. In Table 6, the column sum represented by the denotation of Σ occupies the last row and represents the sum of every single criterion.
[Table 6] Matrix B Containing Column Sum
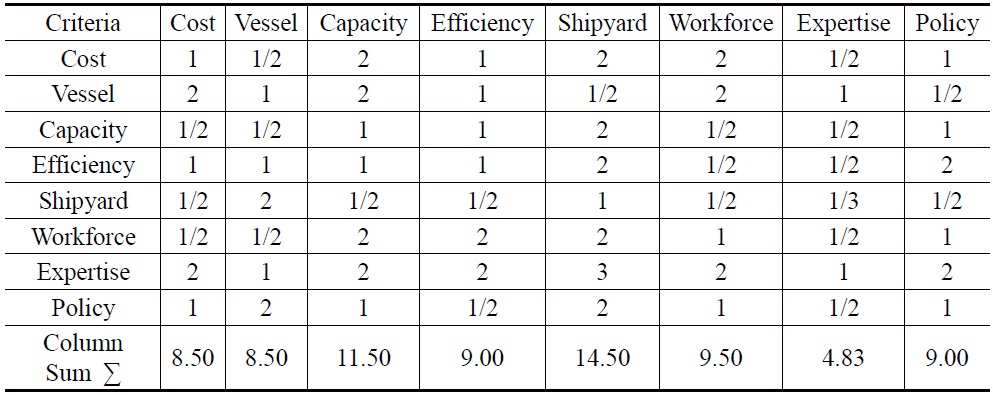
Matrix B Containing Column Sum
Then, the synchronization is making progress through dividing each criterion of the matrix by its column total. For example, the value of 0.12 in the first unit under Cost Column is obtained through dividing 1 by 8.5. Likewise, the row sums under each criterion can be obtained after the synchronization is completed. Then, the weightings of each criterion are finalised by dividing the row sum by the total, all of which constitute the weighting vector in the last column of Table 7. For example, the value of 0.128, representing the weighting of cost, is obtained by dividing 1.02 by 8.00.
[Table 7] Synthesisation and Weighting Vector Calculation

Synthesisation and Weighting Vector Calculation
Therefore, the weighting vector can be obtained from Table 7, denoted as W = (0.128, 0.143, 0.090, 0.119, 0.080, 0.121, 0.199, 0.119)t. Then, λmax, as the maximum eigenvalue of the comparison matrix, is calculated. Applying Equation 1 to the case, λmax is

Where BW1 = 1 × 0.128 + 0.5 × 0.143 + 2 × 0.09 + 1 × 0.119 + 2 × 0.08 + 2 × 0.121 + 0.5 × 0.199 + 1 × 0.119 = 1.12, and the results of the other items can also be obtained by the same approach.
3) Check the consistency
Having obtained the value of λmax, the priority for this step is to check the consistency for such random judgments. The matrix size is 8×8. The CI can be obtained through applying Equation 2:

Accordingly, by referring to Table 4, it is observed that the value of RI is 1.41 when n equals to 8. Then, the value of CR can be obtained using Equation 3:

In this case, the final result of CR is figured out as 0.07851, which is smaller than 0.1, indicating that the judgement is acceptably consistent.
3. Perform Step 2 at the Sub-criteria Level
As the shipbuilding competence presents itself as a complicated issue, the modelling hierarchy inevitably contains a sub-criteria level. At this level, in order to simplify the process, the weightings of some sub-criteria are directly derived from reliable sources such as the recognized book and the common quotation in the field of shipbuilding while the pair-wise comparison is repeated for the remainder with regard to local priorities.
[Table 8] Sub-Criteria Weightings of Cost, Capacity and Expertise
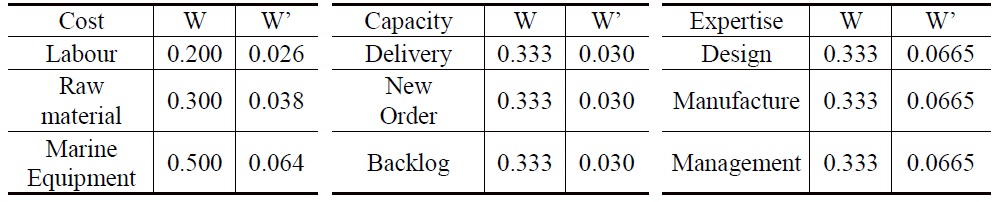
Sub-Criteria Weightings of Cost, Capacity and Expertise
Table 8 displays the sub-criteria weightings of cost, capacity and expertise in terms of both local priorities and global ones. According to Stopford (1997), steel represents about 13% of the cost, the main engine 16% and other materials 25-35%. The remainder of the cost is direct labour and overhead. However, the cost structure only provides a basic idea of the main cost items and differs among different shipbuilding countries. Here, the local priorities of labour, raw material and marine equipment, denoted as W, is compensated into 0.2, 0.3 and 0.5 by considering the circumstances of three shipbuilding countries. Then, the weighting of cost by referring to Table 7 is multiplied with it, turning out the global priorities denoted as W’ = (0.026, 0.038, 0.064)t. In addition, the local priorities of delivery, new order and backlog are simply assumed equal as the shipbuilding capacity is decisively measured by the three key indicators in the worldwide market. The same presumption goes to design, manufacture and management in terms of technical expertise as it is usually embodied in these three main segments. Therefore, their global priorities follow the rule applied previously.
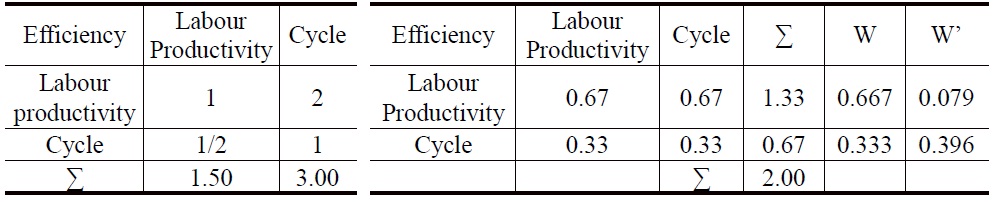
In Tables 9-11, the pair-wise comparison is repeatedly performed for the criteria of Vessel, Efficiency and Workforce. Once the local priorities are determined, the global priorities will follow by taking their parents’ weightings into account.
Since all the weightings are determined, the hierarchy of shipbuilding competitiveness can be redrawn. In Figure 3, all the criteria and sub-criteria of shipbuilding competitiveness are put together with their specific weightings within the hierarchy.
[Table 9] Sub-Criteria Weightings of Vessel, Efficiency and Workforce
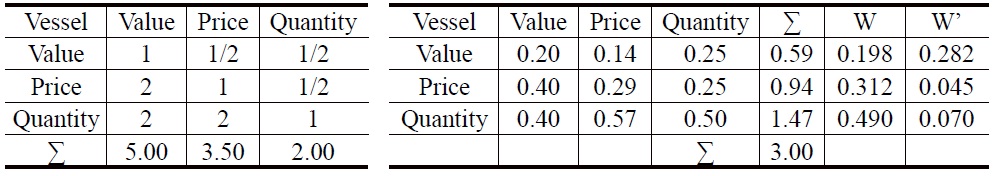
Sub-Criteria Weightings of Vessel, Efficiency and Workforce
[Table 10] Sub-Criteria Weightings of Vessel, Efficiency and Workforce

Sub-Criteria Weightings of Vessel, Efficiency and Workforce
[Table 11] Sub-Criteria Weightings of Vessel, Efficiency and Workforce
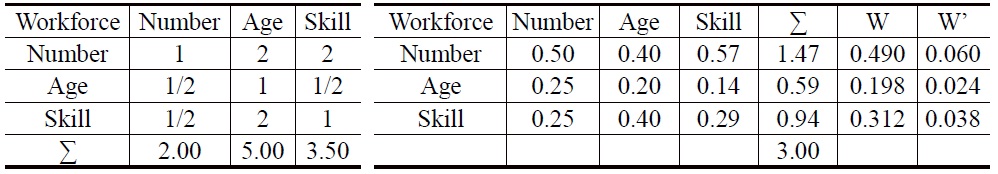
Sub-Criteria Weightings of Vessel, Efficiency and Workforce
4. Ranking the Shipbuilding Countries
After all the criteria weightings are determined, each criterion for the three shipbuilding countries will be scored on the ground of data collected from official channels and authoritative sources, e.g. KOSHIPA, SAJ and CANSI, and supplemented with shipping reports and first hand survey feedback. As far as shipbuilding competitiveness is concerned, the grading system really plays a pivotal role in the case application. However, the grading process is rather tedious, here only the criterion of Vessel is illustrated in detail for example. It is apparent from Figure 3 that ship value, price and quality mainly constitute the evaluation of Vessel. Therefore, the three sub-criteria are scored one by one to assess the competitiveness of South Korea, Japan and China.
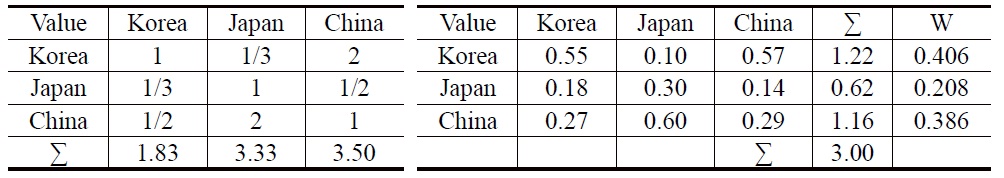
In terms of ship value, a better measurement of construction profitability than sheer numbers of hulls being built or even carrying capacity, different profiles of those countries’ recent shipbuilding activities can be delineated, according to the order book revealed by Clarkson (Table 12). Thus, the competitiveness of the three shipbuilders on ship value can be scored in compliance with such a convincing data source in Table 13.
[Table 12] Orderbook Value by Builder Country/Vessel Type
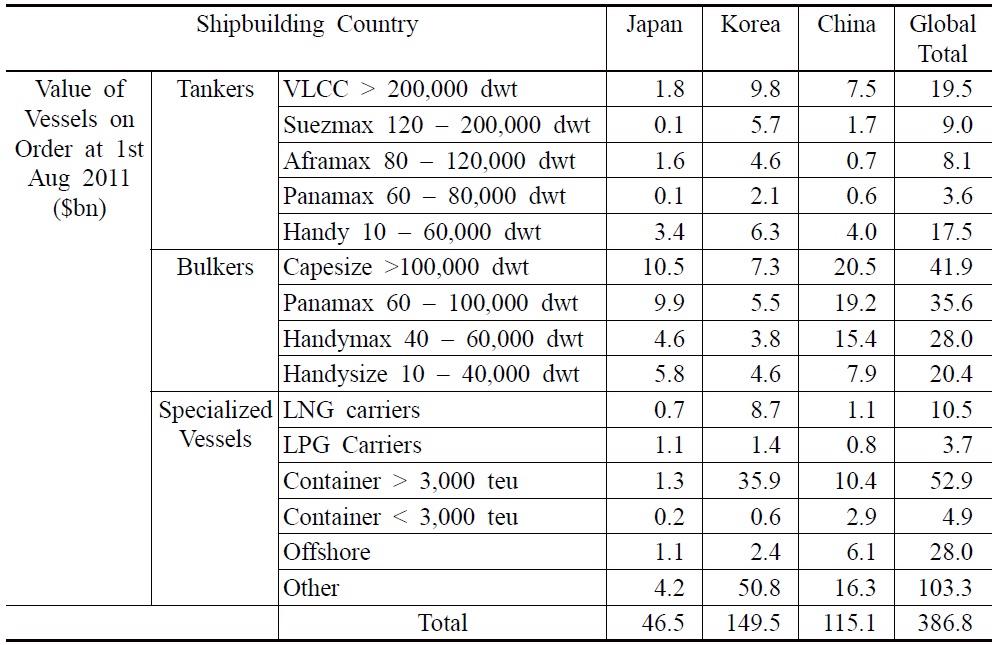
Orderbook Value by Builder Country/Vessel Type
[Table 13] Scores of South Korea, Japan and China on Ship Value

Scores of South Korea, Japan and China on Ship Value
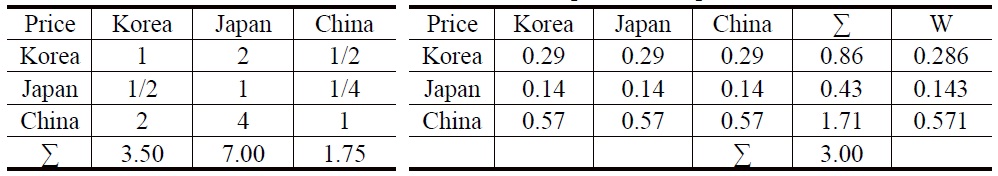
According to BRS (2011), price differences between the shipbuilding countries and also between builders within the same country, widened in proportion to the quality and reputation of the yard so that for the same class of vessel, we could record up to a 20% difference in newbuilding prices, challenging the notion of a single market price. For example, during 2010, the price offered for a Kamsarmax bulker, a class of ship which is particularly well defined, ranged from $32m to $36m in China, and between $36m and $39m in South Korea, equivalent to a 10% price differential within the same country, and a 20% divide across the market as a whole. On the other hand, the ship price in Japan is always skyrocketing, especially as the Japanese Yen is increasingly appreciating against the US dollar at the present time. By virtue of the evidence, the grading on ship price is shown in Table 14.
[Table 14] Scores of China, South Korea and Japan on Ship Price
Scores of China, South Korea and Japan on Ship Price
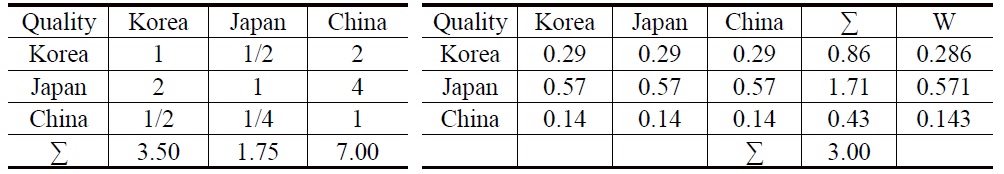
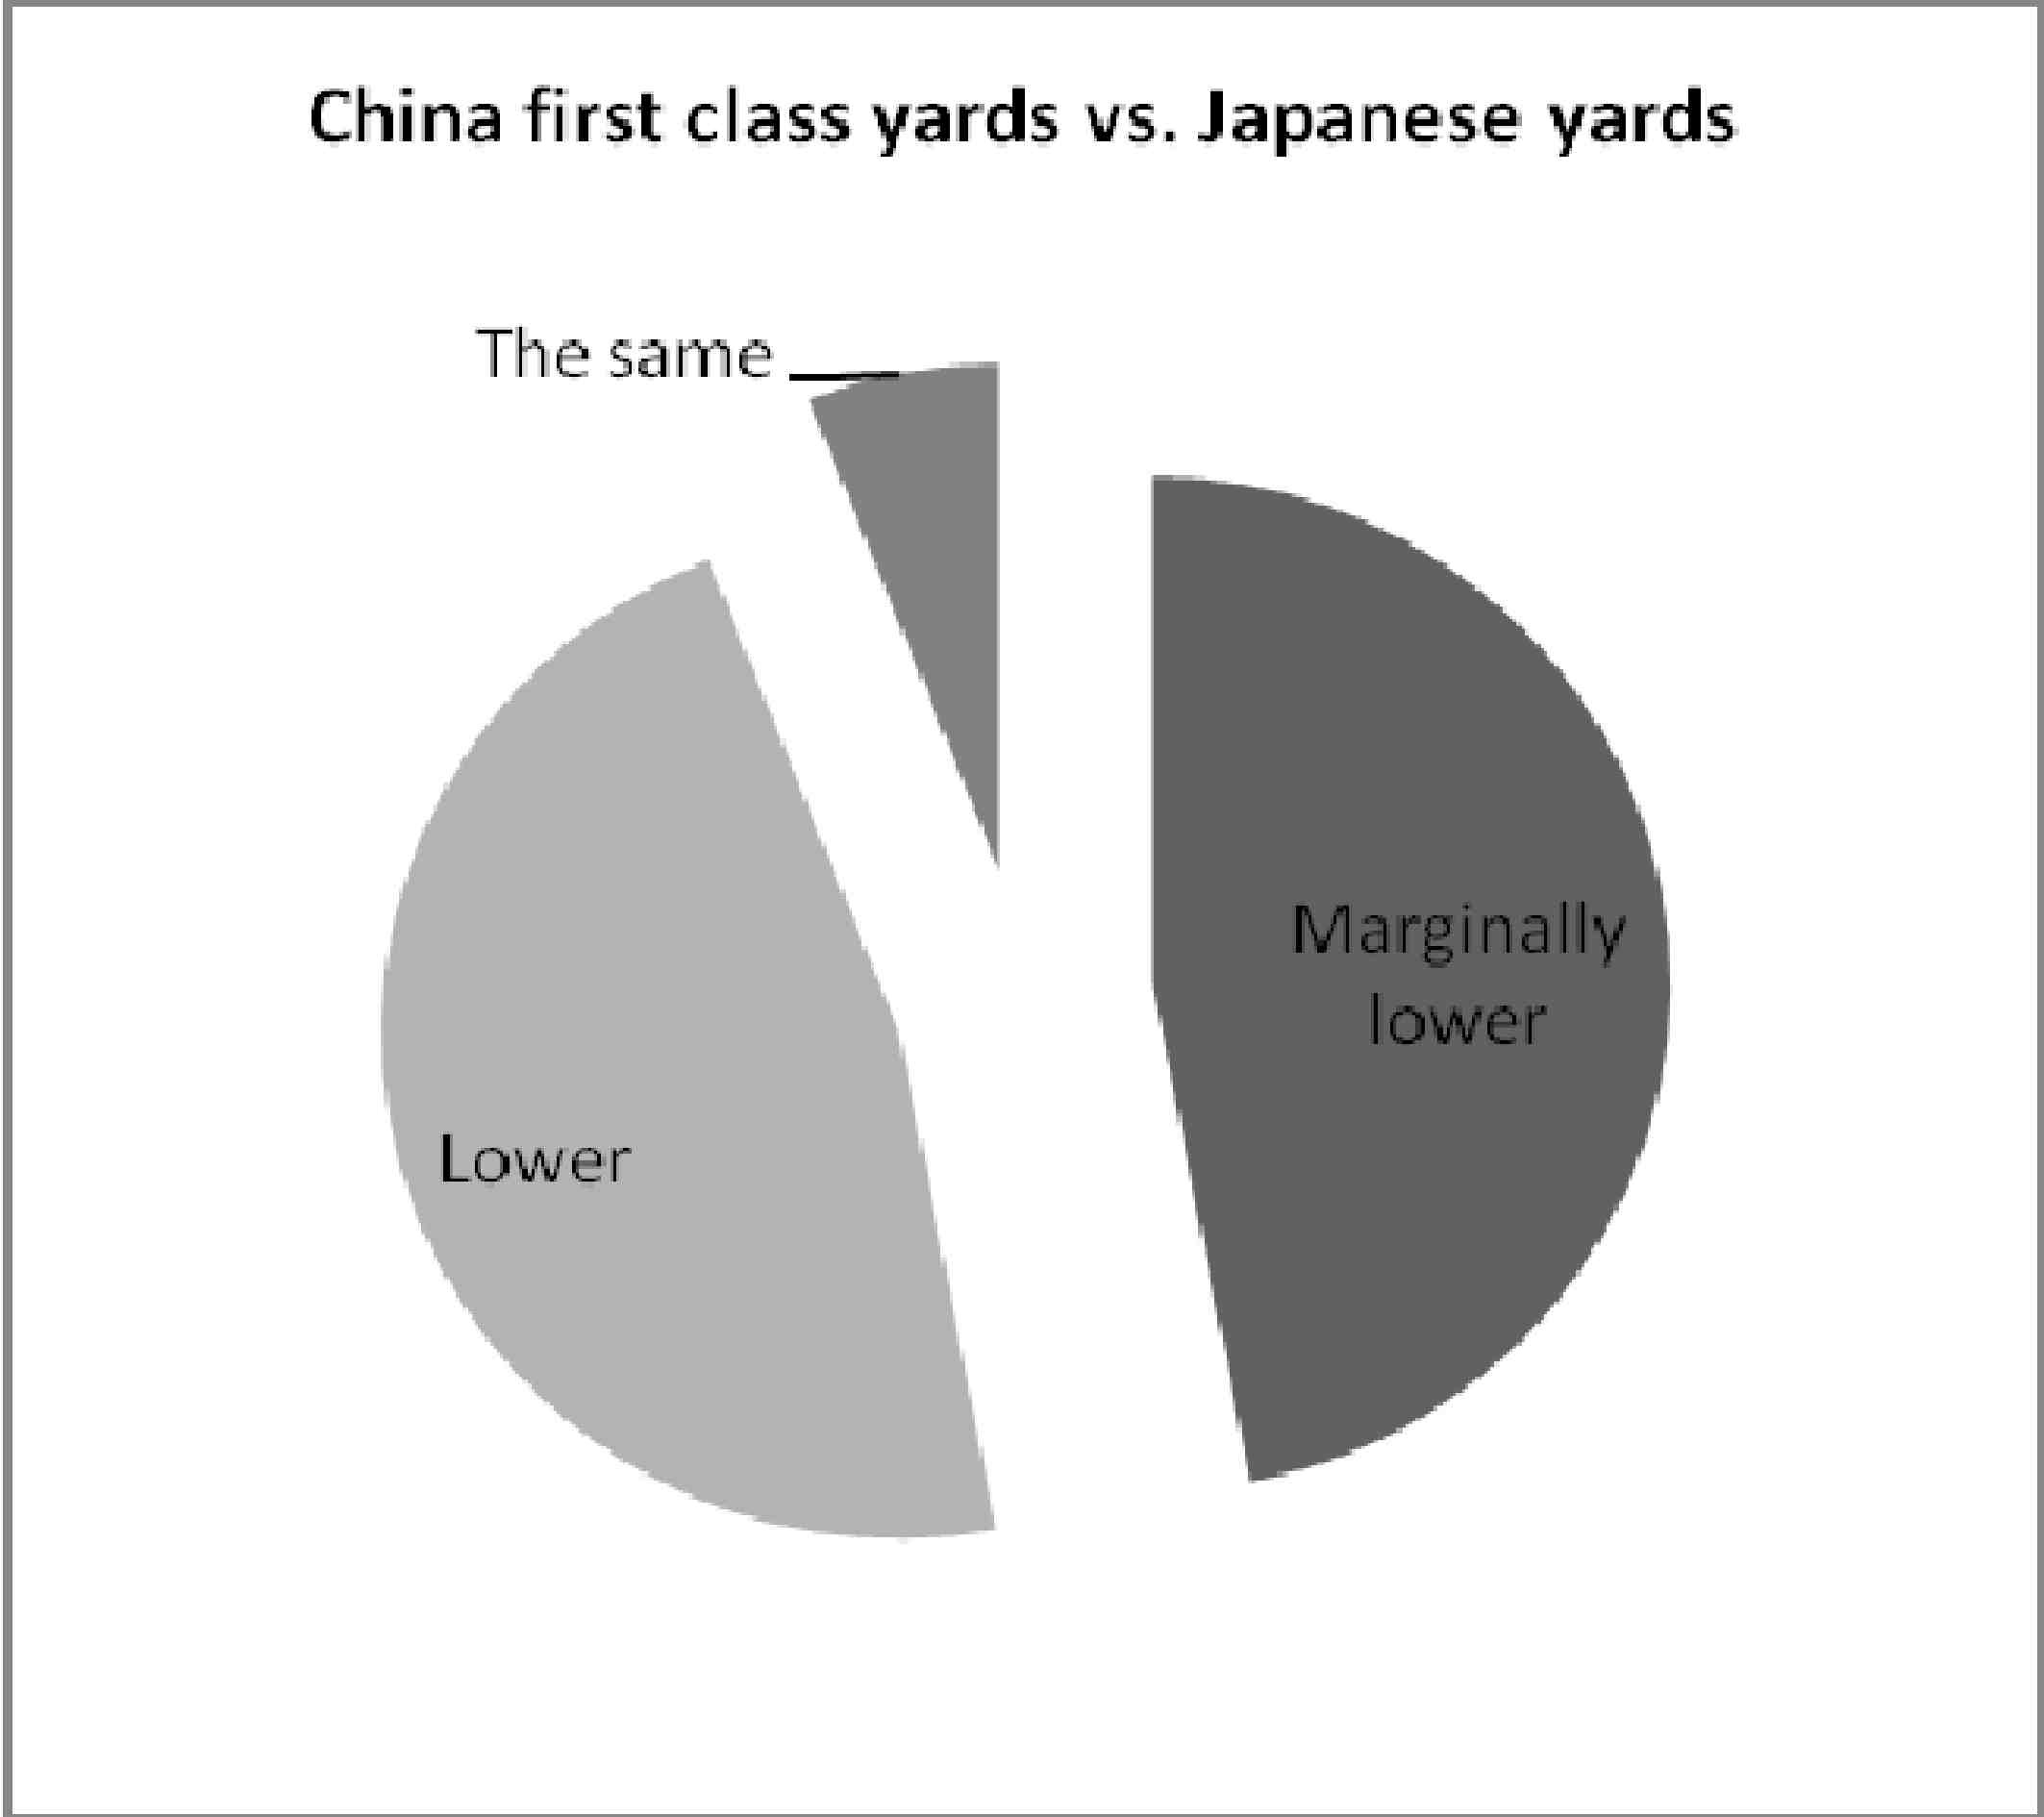
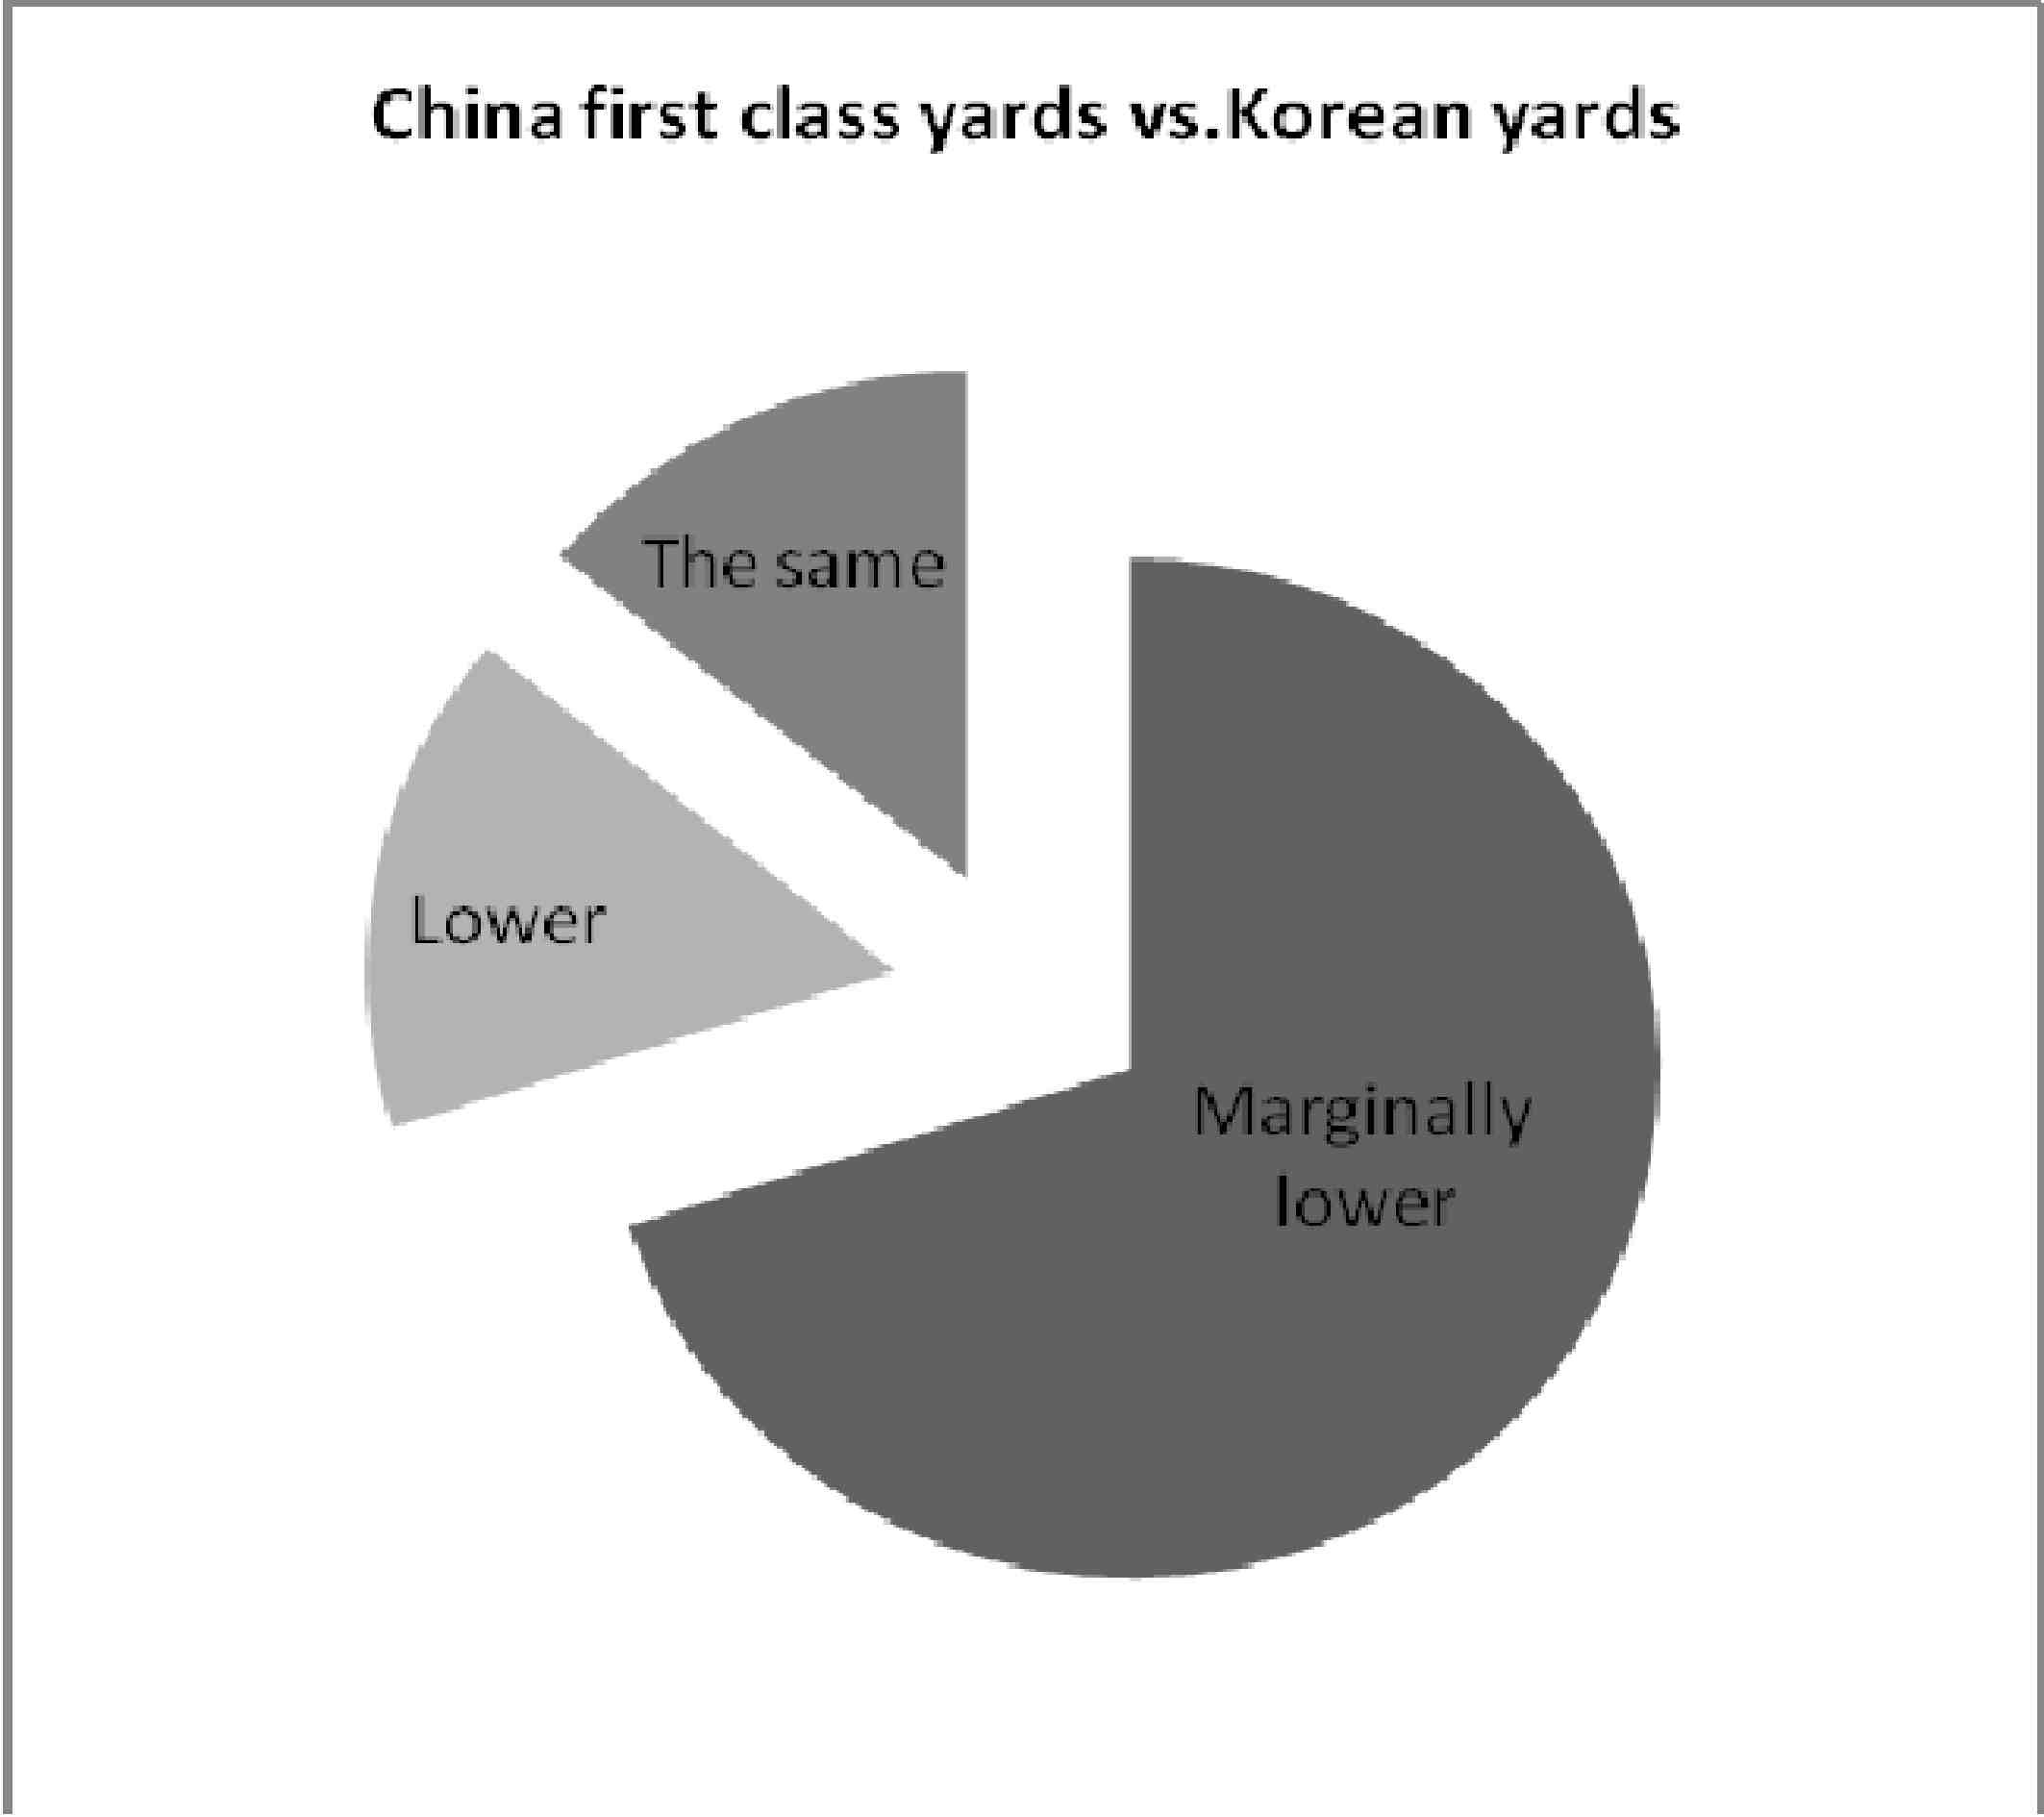
Without doubt, 2010 ushered in a “buyers” market and owners understandably tended towards the well established shipyards, where high-quality can be assured. However, among the three dominant shipbuilding nations, the individual situations vary widely. According to the statistics (shown in Figure 4 and 5), 47% believe that China’s first class yards quality is “marginally lower” than Japan’s yards while another 47% think that it is “lower”. Instead, most reckon China’s first class yards quality is marginally lower than Korean yards. Based on this, the grading is also conducted accordingly in Table 15.
[Table 15] Scores of South Korea, Japan and China on Ship Quality

Scores of South Korea, Japan and China on Ship Quality
Adopting the same mind-set, it is possible to carefully score every one of the other criteria and sub-criteria and the obtained results have been added to Table 16.
[Table 16] Scores of South Korea, Japan and China on all Sub-Criteria
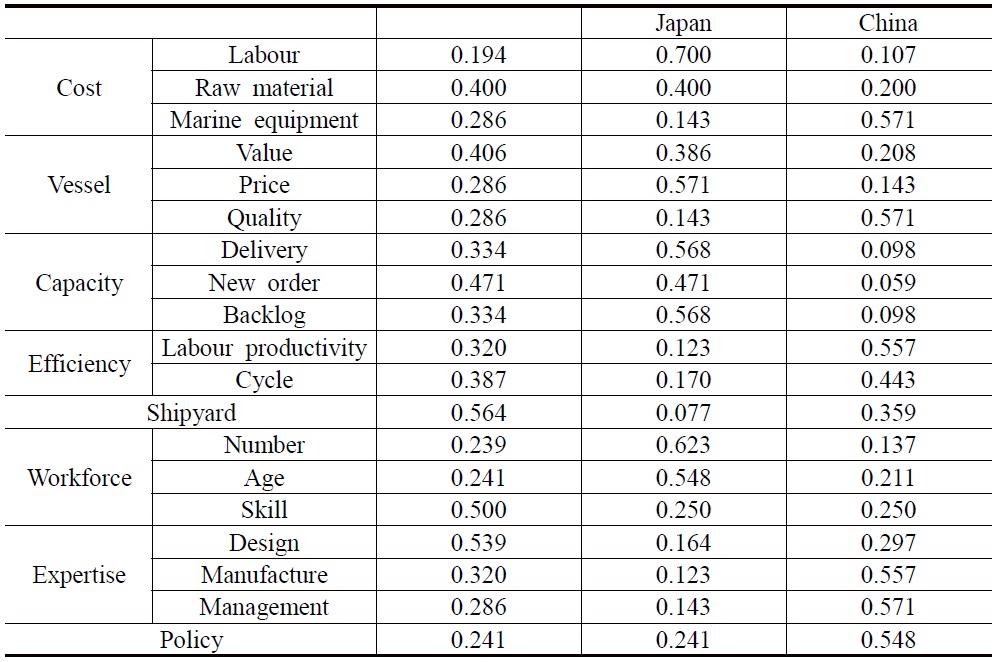
Scores of South Korea, Japan and China on all Sub-Criteria
By combining Figure 3 and Table 16, the ranking order of the three shipbuilding countries can be calculated. The basic method is to multiply the relative scores for each criterion under an alternative with the relative weights for each criterion. For example, the overall score for China can be obtained:
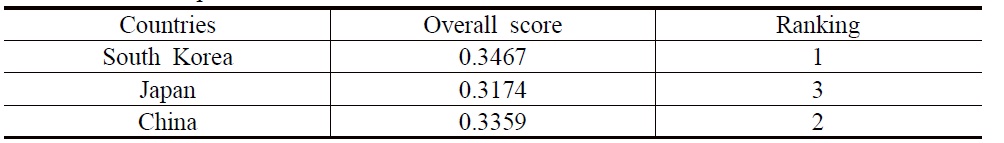
Applying the rule to the South Korean and Japanese cases, the overall scores can be obtained as 0.3467 and 0.3174 respectively (Table 17). According to the overall scores, South Korea tops among the three with China as second and Japan last.
[Table 17] The Ranking of South Korea, Japan and China on Shipbuilding Competitiveness

The Ranking of South Korea, Japan and China on Shipbuilding Competitiveness
In Table 17, it is noted that the overall scores for the three countries are not significantly different although a ranking order can be easily seen. The relatively close overall scores for the three countries may be largely due to the fact that they are all broadly competitive in shipbuilding at the same level. The absolute difference in the overall scores between South Korea and China is 0.0108, accounting for a 3% relative difference (0.0108/0.3359). The absolute difference in the overall scores between South Korea and Japan is 0.0293, accounting for a 9% relative difference (0.0293/0.3174). The absolute difference in the overall scores between China and Japan is 0.0185, accounting for a 6% relative difference (0.0185/0.3174). The gap in the overall scores between South Korea and China is comparatively small. This may be due to the fact that the competitiveness levels of the two countries are comparatively close. The gap in the overall scores between South Korea/China and Japan is relatively large, indicating that Japan is comparatively behind the other two in terms of shipbuilding competiveness.
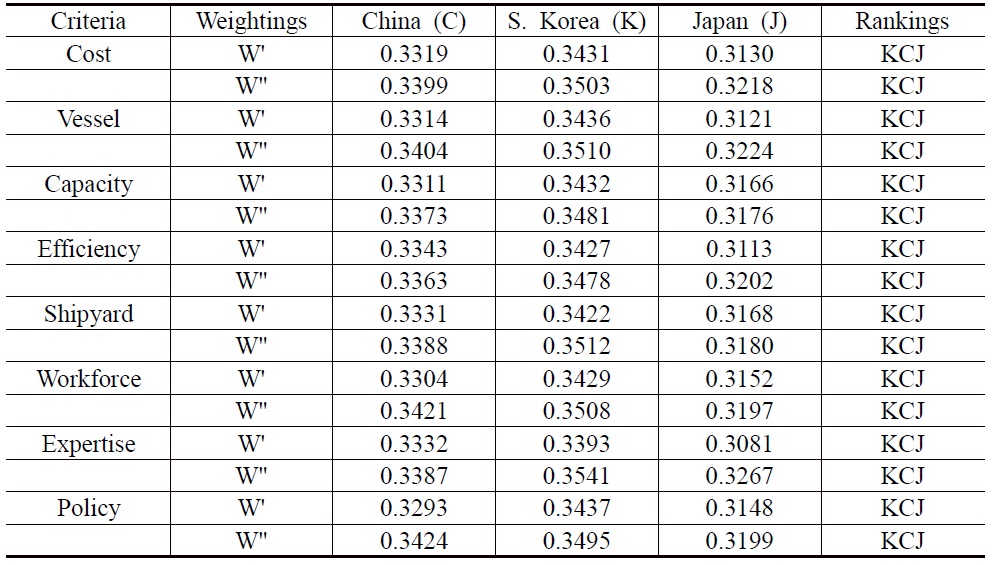
In this part, a sensitivity study is provided to demonstrate how sensitive each criterion is to the ranking order. The attempt is to alter the weightings of every criterion with a 10% reduction and increase to see how the ranking order will change when all the other parameters remain the same. The results are shown in Tables 18 and 19.
[Table 18] Criteria Weightings Changes
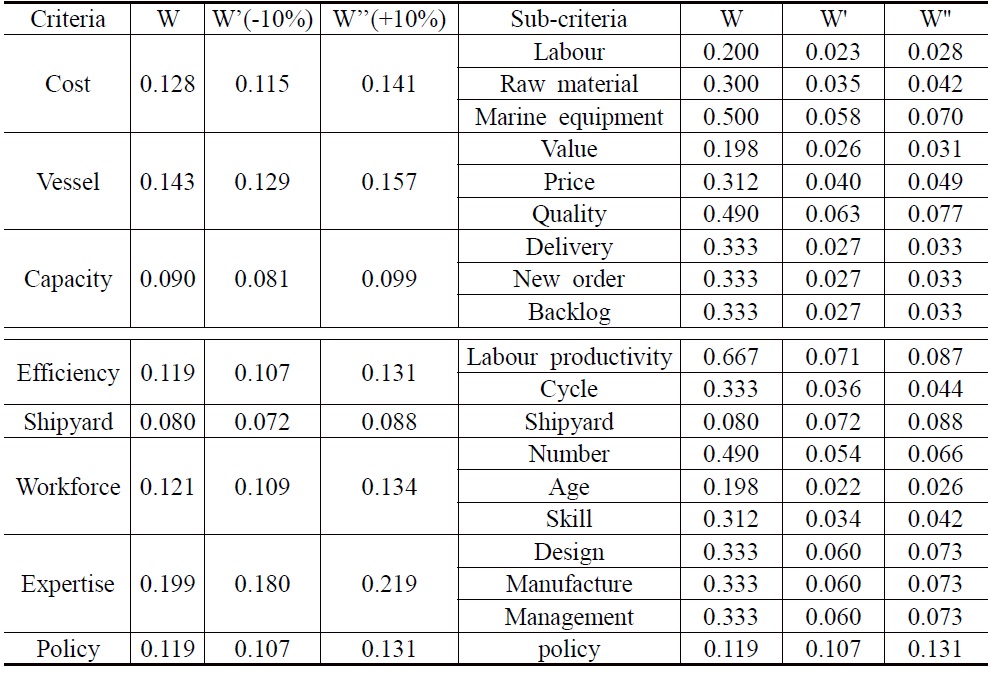
Criteria Weightings Changes
[Table 19] Rankings under Sensitivity Analysis

Rankings under Sensitivity Analysis
It is quite obvious from Table 19 that the produced ranking orders coincide with those in Table 18 when the weighting of cost is changed by 10% while the other parameters remain unchanged. Based on that, the congruity of the ranking order among the three countries under the sensitivity study with the original results proves to a larger extent that the model introduced in the paper is reasonable.
This paper makes a contribution towards the literature on shipbuilding policy and competitiveness by originally applying the methodology of AHP to this market to have a better appreciation of the strengths and weaknesses of the three shipbuilding countries. Another contribution is the implication that this study’s results would also provide valuable information to policy makers and ship builders notably. In the key period of strategic development, the study helps to realize the opportunities and challenges ahead and gives an orientation of future progress to maintain the competitiveness.
It is clear that South Korea has reached the forefront of shipbuilding leadership by holding the most competitive position among the three. The development of South Korea has entered the type of maturing competitiveness with a dominant position in the market, which is expected to continue for a certain period. By excelling themselves in ship quality and contract execution, Korean shipbuilders maintain the competitiveness in both the number and value of securing new orders through targeting high value business as the core competence. However, the challenge for Korean shipbuilders is how to keep its competitive advantages in both technology and human resources with the development of Chinese shipyards. In this regard, closer cooperation between Chinese and Korean shipbuilders to explore a union of their strengths is highly suggested.
In contrast, China is taking off rapidly in the shipbuilding industry by moving from emerging to growing competitiveness in recent years. China, as a runner-up, boosts its quite impressive shipbuilding output and continued price advantage. However, Chinese shipbuilders capture more of the market for dry bulk carriers, tankers, and other commodity carriers at the low end of the commercial market and are confronted with lingering quality problems, comparatively low shipbuilding efficiency and backward technical expertise. It is a good direction for Chinese shipbuilders to explore ways of international cooperation with Korean and Japanese shipbuilders.
Enjoying the first mover advantage, Japanese shipbuilders can leverage their technology and productivity advantages to survive the fierce competition. Notwithstanding, competitive pressures of an aging and a more costly workforce are pushing Japan to third place. After levelling out at maturity, Japan has begun a gradual decline in market share since 2007, which is embodied in the marked slide down in the three key indicators of shipbuilding capacity. Instead, Japan has gradually positioned itself in a role in participating and formulating the international maritime laws. Affected by industry development rules and strategic transfer, the share of Japanese vessels in the global market has sustained a continuous slippery slide, which has accelerated the change of the competitive pattern. Without effective measures to respond, Japan will be in danger of falling further.
The landscape of the shipbuilding industry continues to evolve. Confronted with the evolution, discerning policy makers and entrepreneurs shall be equipped both in resources and personnel to cope with changes and ideally be ahead of the market in order to stimulate and be part of the change.