


East Asia is widely envisioned to have taken steps to promote financial market integration by liberalizing their financial sector during the past decades. Singapore and Malaysia were among the first economies to liberalize their interest rate controls. Thailand followed suit with major reforms in the 1980s, whereas Korea and China undertook more gradual measures towards financial liberalization that were intensified during the 1990s. See Baharumshah et al. (2005). There is a substantial body of empirical literature examining financial market integration and international capital mobility, but focuses narrowly on the already open and integrated economies. Tests of capital market integration in the context of East Asian emerging economies are relatively deficient albeit their scope is expanding. For instance, the estimation for six East Asian countries can be found in Montiel (1994), which measures saving-investment correlations for the 1970s-1990s. The uncovered interest parity (UIP) for Korea, Malaysia, Singapore and Thailand, respectively, is examined by Faruqee (1992).
The UIP, in essence, states that capital flows should equalize effective returns on assets with equal maturity. The UIP is considered to be an arbitrage condition and the parity conditions can be stated as the risk neutrality of investors, rational expectation, negligible transaction costs, perfect capital mobility, identical maturity and default risk. Departure from the UIP implies that at least one of these parity conditions does not hold. Earlier empirical literature on the UIP focuses mostly on the developed economies rather than on the emerging markets. The evidence presented in these studies is generally unfavorable, and robust to the estimation techniques and data sets as explored in the surveys of Froot and Thaler (1990). For example, Lewis (1995) and Engel (1996) document the forward discount anomaly and highlight the existence of a time-varying premium as a source of the forward premium puzzle. Sarno (2005) points out the importance of risk premium, expectations, and the use of survey data, while Chinn (2006) analyzes the robustness of the results with respect to the time horizon.
A broad survey on the empirical studies on the UIP condition for the emerging markets is provided by Alper et al. (2009). There are a number of recent empirical studies that analyze both the developed economies and the emerging markets in the context of the UIP. Bansal and Dahlquist (2000), and Flood and Rose (2002) report less unfavorable results for the emerging economies with lower per capita income and high inflation. Ferreira and Leon-Ledesma (2007) indicate that long-run mean deviations from the real interest parity are positive for emerging markets, but equal zero for the developed economies, suggesting a large risk premium for the emerging markets in the long-run. Although these studies come up with different results, there is one common-to-all result; there is too much heterogeneity between the two groups of countries and hence, the developed economies and the emerging markets should be treated separately.
The existence of relatively frequent structural breaks constitutes an econometric challenge in testing UIP for emerging markets. In this regard, Bekaert et al. (2002) and Goh et al. (2006) recognized the importance of determining the regime switch date endogenously and incorporated this in the UIP estimation. The second econometric problem with testing the UIP for emerging markets is the peso problem, which is dealt with by Flood and Rose (1996) and Sachsida et al. (2001). The central bank’s interventions may also distort the UIP. Chinn and Meredith (2004), and Poghosyan et al. (2008) show that the reaction by monetary authorities to exchange rate movements through policy rates leads to the joint determination of the expected depreciation and returns. This implies a simultaneity bias causing the failure of the UIP for emerging markets.
In testing the UIP, it is possible to consider the existence of an additional risk premium for the risks of an emerging market if investors are risk averse. These risks are attributable to default risk or political risk, which can be justified by incomplete institutional reforms, weaker macroeconomic fundamentals, more volatile economic conditions, and shallow financial markets. Recent increases in portfolio investment flows also emphasize the role of market risks as an alternative explanation for the failure of the UIP for emerging markets. Portfolio models developed by Portes and Rey (2005), Martin and Rey (2004), and Hau and Rey (2004, 2006) suggest that, as determinants of the international portfolio investment flows, there are several important market variables such as the degree of market integration, transaction costs, the distance between capital markets, and the size of the market. Intuitively, the magnitude of the market risks after the liberalization of financial markets is expected to decrease gradually along the path of market integration.
This paper explores a risk adjusted uncovered interest parity (RUIP) model to investigate the degree of market integration in China relative to the U.S., Japan, the U.K., and four Asian emerging markets from January 1994 to July 2008. Those four emerging markets were Korea, Singapore, Malaysia, and Thailand, which have been vulnerable to external market risks and experienced several currency and or financial crises during 1990s~2000s after the market liberalization. The UIP was revised to take into account portfolio equity flows and market risk within a framework of a portfolio rebalancing model. In addition, this study examined how the degree of integration of the Chinese capital market evolved over time, specifically after structural changes in the capital markets since 1999. Such an effect has not been examined in the earlier studies on China as well as the Asian financial integration. Examinations of capital mobility and tests of the UIP in the context of the Chinese capital market are found in Huang and Guo (2006) and Cheong et al. (2003). They indicate that financial integration remains significantly incomplete in China, even though there has been substantial integration of the Chinese capital market after liberalization. Although our theoretical model was in line with the recent portfolio models, it was distinct from them in that market risk was explicitly employed in the dynamic portfolio rebalancing process by domestic and foreign investors.
From the monthly data on the Chinese, Korean, Singaporean, Malaysian, and Thai markets from January 1994 to June 2008, evidence was found to strongly support this study’s hypotheses that the Chinese capital market has become more integrated with the other Asian markets after its structural changes in 1999. However, significant market risk still exists in the Chinese capital market, which can explain the failure of the UIP in China and in Asian emerging markets. It can be inferred from the evidence that there must have been some biased restrictions toward capital outflows by the Chinese government.
Ⅱ. Risk adjusted returns in the model
This study developed a risk adjusted uncovered interest parity model (RUIP) from the perspective of a portfolio model, which considers risk factors in determining the portfolio rebalancing process. To do so, a portfolio model by Hau and Rey (2006) was adopted to theoretically derive the RUIP model by explicitly utilizing market risk in capital flows. In the proposed model, it was assumed that hedging costs were too high to cover all risks. That is, the market trading risk is imperfect. Perfect hedging is impossible as well. Under the assumption of an inelastic supply of foreign exchange, the exchange rate is expected to respond to the changes in demand of foreign exchange. Let


where


In (3) and (4), dRt and dRt* are returns on domestic and overseas assets. The domestic and foreign returns are subject to shocks of prices and dividends. The foreign assets and the foreign returns are expressed in terms of their foreign currency, and the domestic investors are exposed to exchange risk when they hold overseas assets. Using the profits (3) and (4), the first order conditions are derived to maximize the expected utility for domestic and foreign investors. Then, the optimal demand for the assets could be derived by recursively substituting the optimal choice of each asset into the first order conditions.


where σ2R and σ2R* are the variances of the returns. δ* and δ are the relationships between the domestic and foreign returns, representing an inverse of the market risk in the international portfolio equity flows. i.e.,,
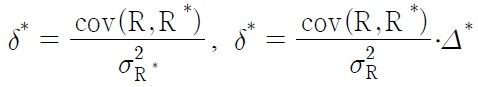
and δ are an increasing function of the covariance terms between the two returns. If the capital markets between two countries are well integrated with each other, then the two countries’ returns move together in the same direction. δ and δ* are positive in this case. The greater δ and δ* indicate a higher degree of capital market integration between the two countries, and thus, a decreased market risk.
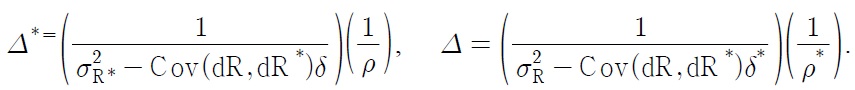
A risk adjusted differential of return is defined as a difference between domestic and foreign rates of returns adjusted by the market risk in the portfolio investment flows. It equals [E (dR ) — δ*E (dR *)] for foreign investors to purchase domestic assets, and is equal to E (dR *) — δE (dR )] for domestic investors to buy foreign assets. The optimal portfolio demands (
Market clearing conditions for home and foreign equity markets are Ath + Atf = 1, and At*h + At*f = 1. Here the equity supplies are normalized at home and abroad. From the market equilibrium conditions of the domestic and foreign assets, the equilibrium asset returns are derived,

Higher returns are expected as compensation for the higher variance of returns and higher degree of the risk aversion.
Let St be the exchange rate of the domestic currency per unit of the foreign currency. A rise in St depreciates the value of the domestic currency. Given the inelastic supply of foreign exchange, the exchange rate would increase with the greater demand for the foreign exchange, which is closely related to changes in the net demands for domestic and foreign assets. The net demand for foreign exchange is the sum of the overseas portfolio investment flows by the domestic investors less portfolio inflows by foreign investors.

where λ(۰) is the net demand elasticity of the foreign exchange given the inelastic supply of the foreign exchange. Pt and Pt* are prices of domestic and foreign assets. For simplicity, dividend flows from the net holdings of foreign (domestic) assets by domestic (foreign) investors are assumed to be exogenously determined. Substituting the optimal portfolio demands (

where
The terms of
According to theory, the relationship between returns, an appreciation rate of the exchange rates, and equity investment flows can provide a coherent theoretical explanation for the stylized puzzles presented by Hau and Rey (2004, 2006), using data from OECD countries in recent years. They show that higher returns in the home equity market relative to the foreign equity market are associated with a home currency depreciation, and that net equity flows into the foreign market are positively correlated with a foreign currency appreciation. Their findings are counter-intuitive since it contradicts the popular view of the UIP that a strong equity market should be mirrored by a strengthening exchange rate. A positive shock of domestic dividends will increase the domestic return and its variance at a same time. Investors consider risk as an increase in variance of the domestic return, and begin to rebalance their portfolio by reducing the demand for domestic assets. This portfolio rebalancing process makes the exchange rate of the domestic currency depreciate counter-intuitively in the foreign exchange market.
Ⅲ. The estimation of the revised uncovered interest parity model
Traditional UIP represents a negative relationship between interest rates and an appreciation rate in the exchange rate through interest arbitrage under the joint assumption of rational expectation and risk neutrality. According to theory, equation (11) is set up to propose a RUIP model, which considers market risk for the portfolio investment flows by foreign investors.

where

where b0 is constant representing the economic characteristics specific to each country. b1 is the effect of the return differential on the exchange rate. It is negative for the UIP, while positive for the RUIP model. It is notable in (12) that an appreciation rate of the exchange rates is expressed in terms of change in the current exchange rates instead of the future rates. A rise in the domestic interest rate causes capital inflows to home and, thus, appreciates the current exchange rates. b2 is the effect of market risk, which is equal to b2 = b1(1 — δ*). Market risks are different in magnitude and in statistical significance across countries. b2 will be zero when international capital markets are perfectly integrated(δ* = 1). In this case, the traditional UIP converges with the RUIP model. Note that b is the effect of macroeconomic information, while b2 represents the effect of micro-market information. See Chordia et al. (2001) and Hau and Rey (2006) for the importance of micro-market information for causing fluctuations of the exchange rates.
Following the recent portfolio models, let δ* cover overall market risks, e.g., a degree of market regulation, transaction costs, the distance between markets, and the size of market as well as default and political risks. Unlike the UIP assuming risk neutrality, the RUIP model emphasizes the existence of market risk in determining the international portfolio flows when investors are risk-averse. However, rational expectation of the market is still assumed to focus on the role of market risk, and the peso problem is not a major issue in testing the RUIP for the case of China, where the structural changes are at a gradual and expected pace.
In the empirical model of RUIP, a risk adjusted differential of return (rt — δ*rt*) facing foreign investors is not symmetric to a differential of return (rt* — δrt) facing domestic investors. That is, the risk adjusted differentials of returns must be separately considered according to the direction of the capital flows by domestic investors versus foreign investors. From a policy perspective, it was shown that Chinese capital controls and market policy would have a different attitude to inward and outward investments. So it is natural to examine whether the direction of the international capital flows would have different effects on the integration of the Chinese capital markets.
Three hypotheses will be tested for the RUIP model; 1) whether market risk exists in international capital flows, particularly for the Chinese capital market (
The monthly data of the stock returns and the exchange rates for China and four Asian countries, Singapore, Korea, Malaysia, and Thailand as well as developed markets, the U.S., Japan, and the U.K. were used from January 1994 to July 2008. The exchange rate was the rate of the domestic currency per unit of a foreign currency at the end of the month1. The stock returns were used instead of the interest rate in order to examine the effects of portfolio equity flows. The empirical tests of UIP using returns can be found in recent studies by Portes and Rey (2005), Martin and Rey (2004), Hau and Rey (2004, 2006), Pavlova and Rigobon (2003), and Wu (2000). The stock indexes were the China Shanghai index, U.S. Dow Jones index, Japan Nikkei index, U.K. FTSE 100 index, Singapore ST index, Korea KOSPI index, Malaysia KLCI, and Thailand SET index. Data for the exchange rate and stock indexes were obtained from Bloomberg, the central bank of each country, and the IMF’s International Financial Statistics
Before testing the RUIP model,
was primarily calculated for each country and its calculations are shown in Table 1. The numbers in the parenthesis underneath the values of δ* are the
[Table 1] The Values of from January 1994 to July 2008 in the Chinese Capital Markets
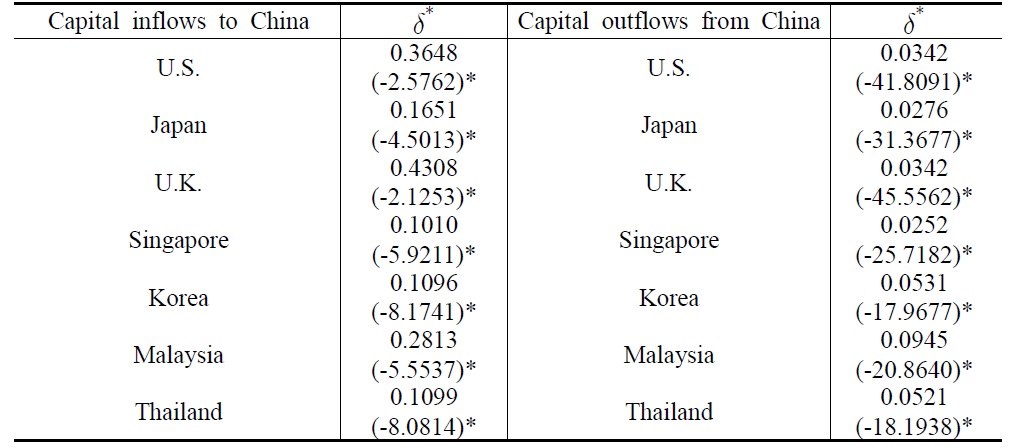
The Values of from January 1994 to July 2008 in the Chinese Capital Markets
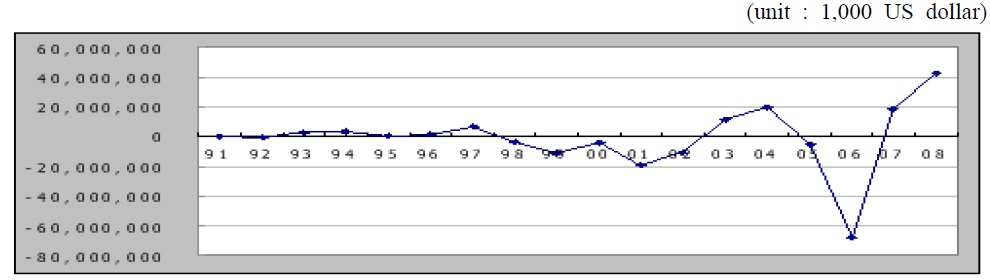
China has taken strong steps in the liberalization of the capital market in the 1990s, although there are still many restrictions on capital flows. One of the most important liberalization steps was the implementation of an official securities law to regulate the stock market in July 1999. The Chinese capital markets were actually liberalized after joining the WTO in December 2001. China started in May 2005 to eliminate more restrictions on the trading and distribution of Chinese stocks. The transition of the exchange system from the dollar peg into the basket system in 2005 resulted in additional volatilities in the net capital flows. Figure 1 shows that the net changes in the equity flows into China have increased rapidly since 1999.
The regime shifts in the Chinese capital market and its foreign exchange market are provided in
3. Testing of the revised uncovered interest parity vs. the uncovered interest parity
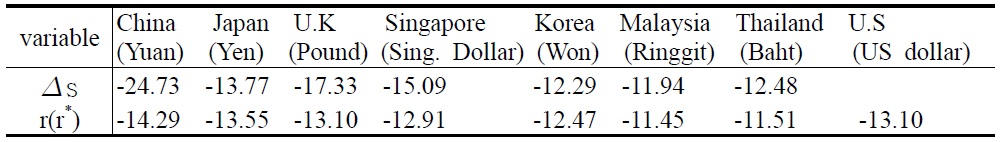
The traditional estimation technique is likely to produce spurious results if the dependent and independent variables are non-stationary. Thus, a test was initially done with the
[Table 2] Phillips-Perron (1998)’s Test for Changes in the Exchange Rates and Returns

Phillips-Perron (1998)’s Test for Changes in the Exchange Rates and Returns
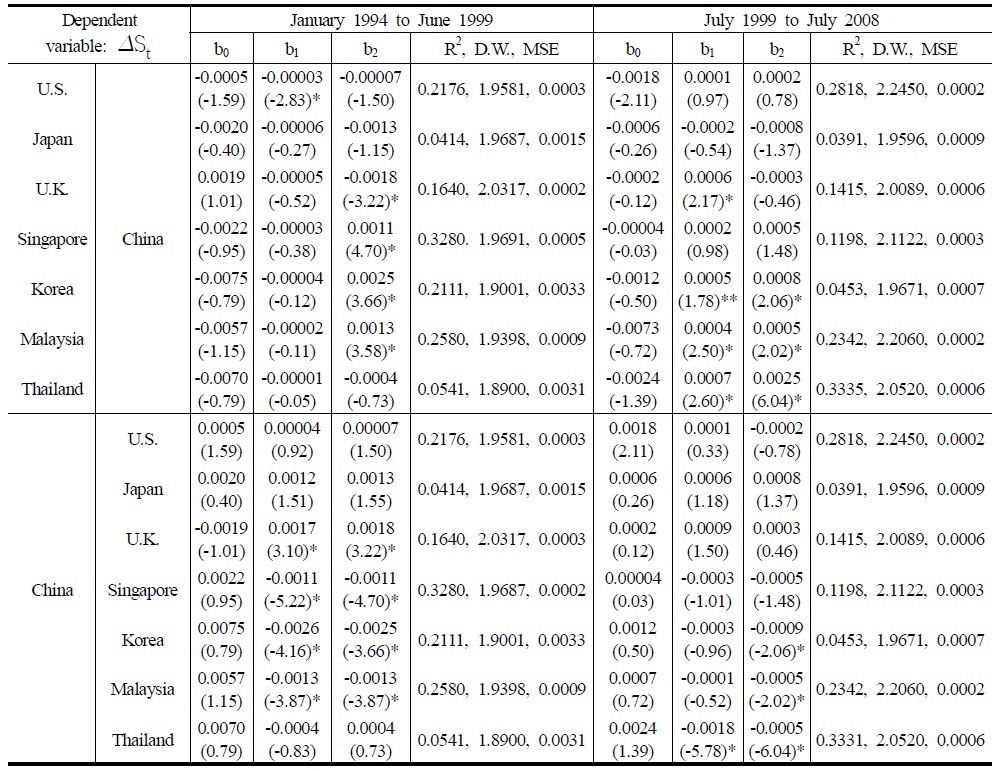
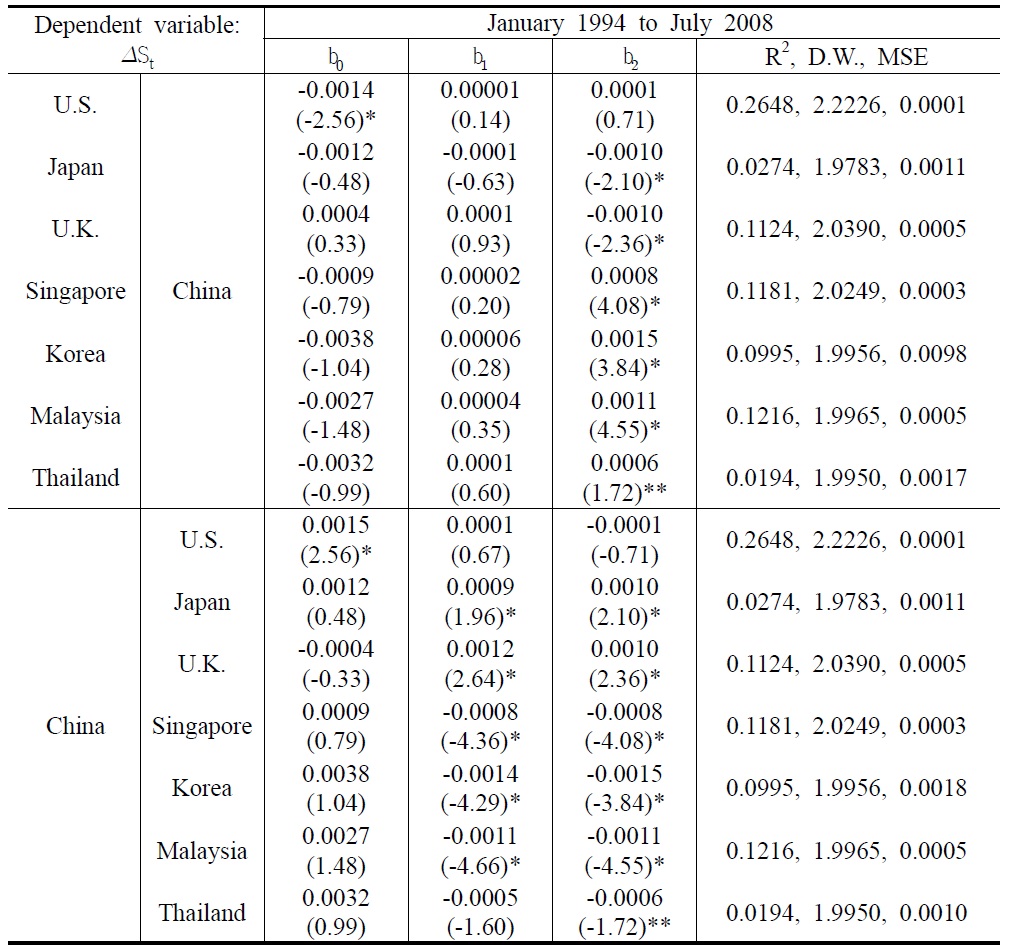
Tables 3a , 3b and 4 show the estimation results of the two RUIP models and UIP, which take China and the U.S. as benchmark economies, respectively. The numbers in the parenthesis are
In Table 3a, b1 was statistically insignificant for the capital inflows to China while being significant for the capital outflows from China. It seems that the returns were important determinants of capital outflows from China. The signs of b1 were positive for the capital flows to the developed economies, but negative to the Asian markets. This implies that capital flows to the developed markets had portfolio investment purposes while the capital flows to the Asian markets from China were for arbitrage purposes. b2 was statistically significant at the traditional level except in case of the U.S. This shows that market risk plays an important role for international capital flows between China and the other sample countries. The multi-collinearity test between the two explanatory variables, (rt — rt*) and rt* in testing the RUIP, indicates that there was no collinearity between the two variables by the criteria for the condition numbers. For all the cases of capital flows in China, the
[Table 3a] Estimation Results of the RUIP for Chinaa); st = b0 + b1(rt ― rt*) + b2rt* + et

Estimation Results of the RUIP for Chinaa); st = b0 + b1(rt ― rt*) + b2rt* + et
In most empirical UIP literature, a major developed country is used as the benchmark economy because the capital controls in these countries are low and stable. Hence, deviation from the UIP for an emerging market captures the extent of the capital account liberalization for the emerging market and how the liberalization has evolved over time. However, when an emerging country is taken as the benchmark economy, which might still be implementing capital account liberalization during the sample period, then the deviation from the UIP may be contaminated by the changes in the capital controls in the benchmark economy. To identify whether the test results of the RUIP are dependent on the benchmark economy, the RUIP was estimated again by taking the U.S. as a benchmark economy. The re-estimation results of the RUIP in Table 3b were favorable as before, implying that the choice of a benchmark economy did not affect the results significantly. Market risk seems to play an important role for international capital flows between the U.S. and the Asian sample countries, while returns and risks had different effects on the exchange rates, depending upon the direction of capital flows.
[Table 3b] Estimation Results of the RUIP for U.S.; st = b0 + b1(rt ― rt*) + b2rt* + et

Estimation Results of the RUIP for U.S.; st = b0 + b1(rt ― rt*) + b2rt* + et
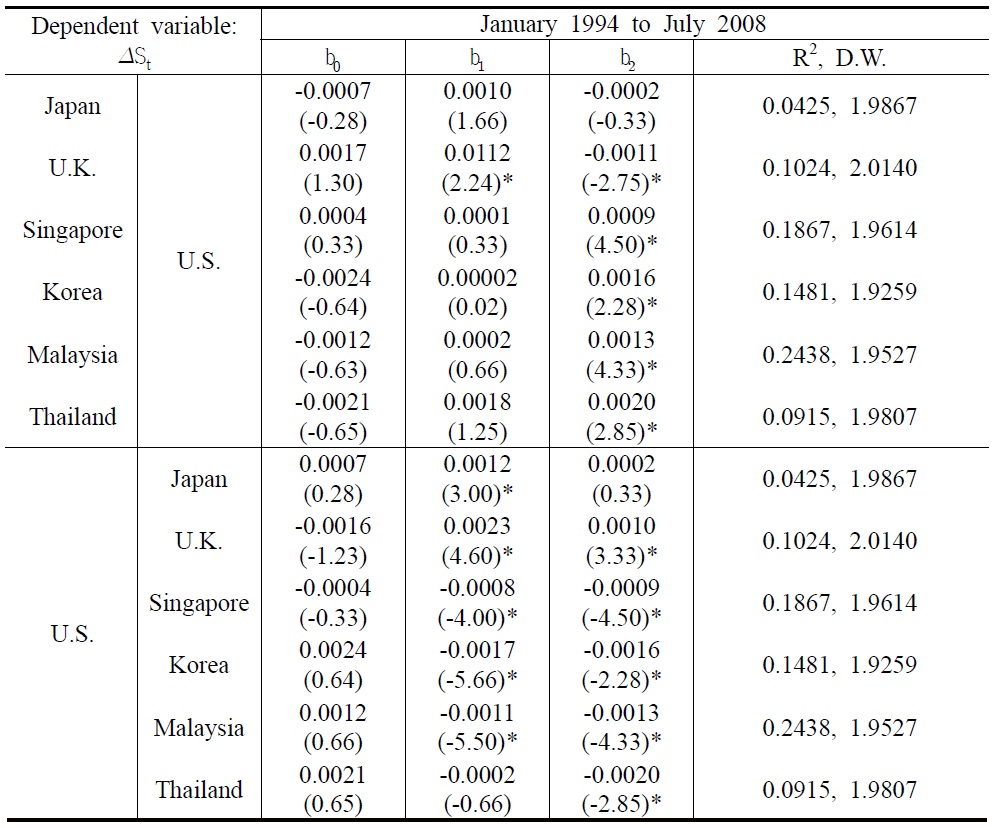
The estimation results for UIP are provided in Table 4 using three month deposit rates or the Treasury bill rates from the central bank of each country.
[Table 4] Estimation Results of the UIP a); Δst = b0 + b1(it ? it*) + et

Estimation Results of the UIP a); Δst = b0 + b1(it ? it*) + et
The sample period was from January 2001 to July 2008, because the Chinese interest rates were floated in the market since January 2001. In general, b1 was statistically insignificant at the traditional significance level, and
1Use of the average exchange rate in a period does not significantly yield any different results 2rt and r*t could be endogenously determined in the system so the predicted values of these returns are initially estimated to avoid the endogeniety problem by using the past returns and the exchange rates as explanatory variables. Then, the predicted returns were used as proxies for the actual returns in the second stage of the estimation.
Ⅳ. The effect of the structural changes on the revised uncovered interest parity
Considering regime shifts in testing RUIP could provide a better description of how RUIP deviations have evolved over time and how changes in the volatilities of the deviations have coincided with the major changes in financial liberalization. How the structural breaks in the Chinese capital markets have influenced the estimation results of the RUIP and how the RUIP deviations evolved over time will be discussed next. In order to do so, the RUIP was separately estimated before and after the
In Table 5, before the changes in the Chinese capital market in 1999, b1 was statistically insignificant for capital inflows to China while being negative in sign, but statistically significant for capital outflows from China to the Asian emerging markets. However, after 1999, these results were completely opposite to before. For instance, b1 became statistically significant for capital inflows to China from the Asian emerging markets, but was statistically insignificant for capital outflows. This means that, before 1999, returns were important determinants of not capital inflows to China, but capital outflows from China to the Asian emerging markets. However, after 1999, returns turned out to play an important role for capital inflows to China from the Asian emerging markets. Capital inflows to China seemed to have a portfolio investment purpose after 1999. b2 was statistically significant at the traditional level for both directions of the capital flows, showing the importance of market risk as a determinant of the capital flows regardless of the structural changes in the Chinese capital market.
Estimation Results of the RUIP before and after the Structural Changes in the Chinese Capital Market a); Δst = b0 + b1(rt ? rt*) + b2rt* + et
To strictly examine the effect of the structural changes in the capital markets, the RUIP with a dummy variable was estimated; however, the results are not shown here due to limited space. The dummy variable takes a value of 0 and 1, respectively, before and after the structural changes in the Chinese capital markets in July 1999. The effects of the dummy variable were divided between the developed markets and the Asian emerging markets indicating that the Chinese capital market became much more integrated with the Asian capital markets after its structural changes while improving a little with the developed economies. The relationship between returns and the appreciation rate in the exchange rate may vary with country and time periods, when the portfolio equity flows are controlled. To estimate the RUIP under capital controls, the yearly data of the total capital flows were used instead of the monthly data due to the rare availability of data, which was obtained from the balance of the payment table by the People’s Bank of China. The new estimation results of the RUIP controlling capital flows indicate that capital controls were not statistically significant at the traditional level. This implies that the previous estimation results were robust with respect to capital controls for the RUIP model. The new estimation results can be obtained from the author upon request.
There are two important points that should be taken into account while analyzing the effect of
Ⅴ. The estimation of market risk
Using the deviation from the interest parity, the market risk can be measured for international capital flows. In order to do so, the restriction of b1=1 is set in the RUIP model (12) by assuming that all the capital flows have a portfolio investment purpose.

where c1 = (1 – δ*) represents market risk which causes the deviation from the interest parity. If the degree of integration is higher between two countries, then δ* is larger and c1 becomes smaller. If the degree of the market integration is perfect or δ*=1and c1=0, then the UIP converge to the RUIP. could be obtained from the estimated value of c1 in (13).
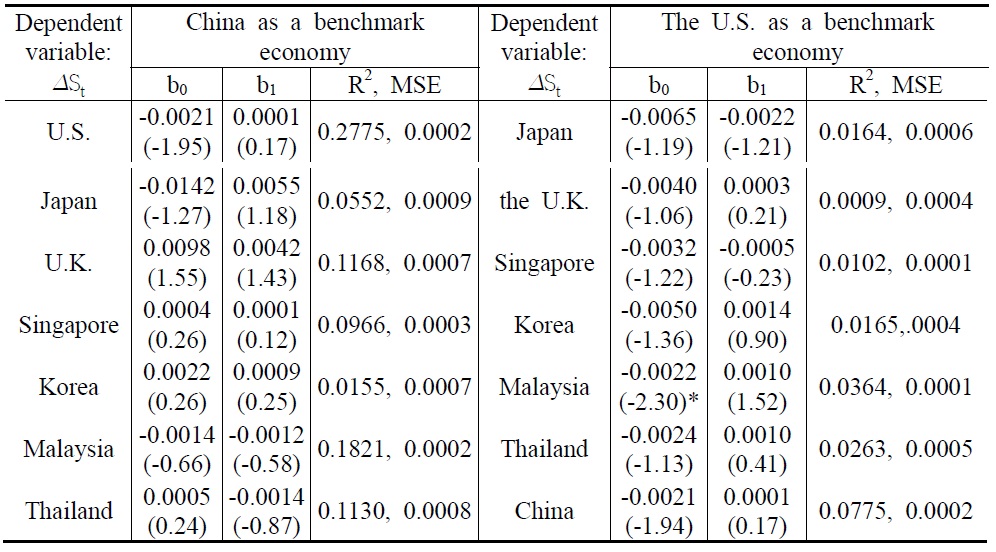
The
[Table 6] Estimation of Market Risk and δ* from [Δst ? (rt ― rt*)] = c0 + c1rt* + et
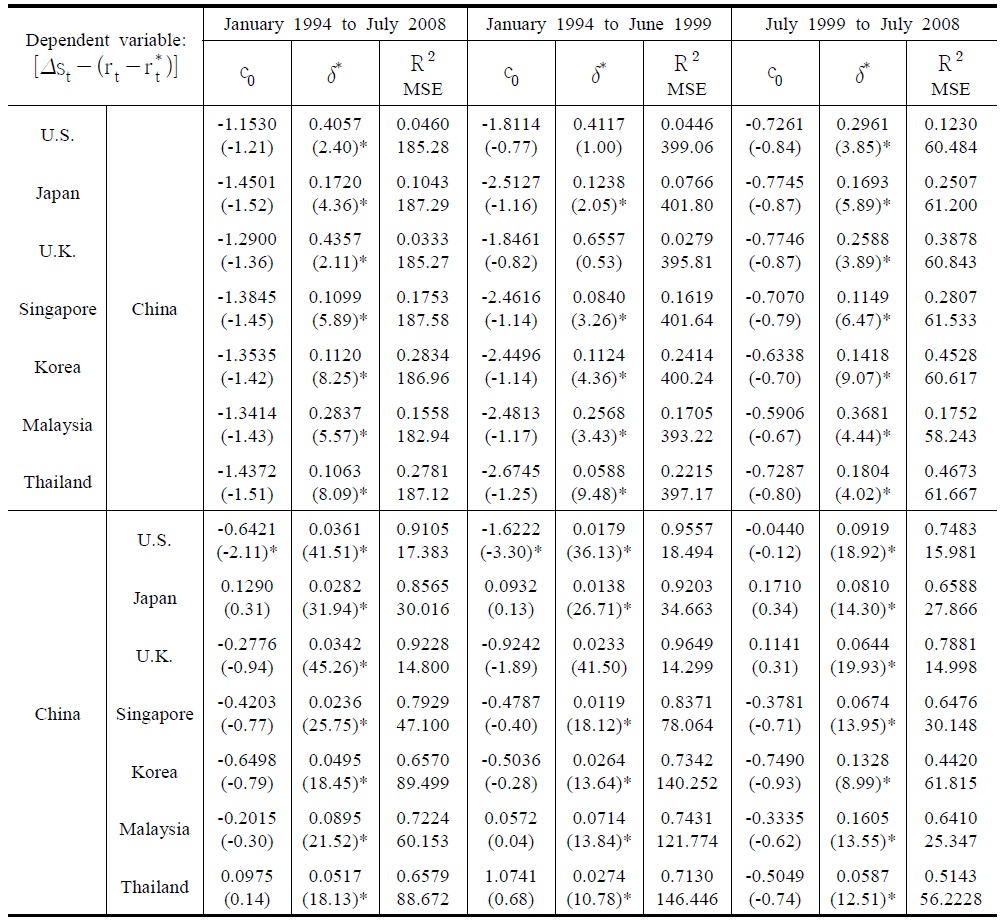
Estimation of Market Risk and δ* from [Δst ? (rt ― rt*)] = c0 + c1rt* + et
In general, δ* was greater for the developed markets than for the Asian markets indicating that the Chinese capital market was more integrated with the developed markets. Meanwhile, δ* was smaller for capital outflows than for capital inflows to China. This implies that there might be a biased restriction toward capital outflows by the Chinese government. See People’s Bank of China (2008) for Chinese capital controls. The estimated values of δ* seem to differ from its directly calculated values in Table 1. This difference arises because, unlike its direct calculations, the estimated values of δ* eliminate the effect of arbitrage capital flows.
The estimations of δ* period by period were carried out to find in the three different periods how the market risk evolved over time. δ* is shown to vary with time and the time trend of δ* tends to increase over time meaning that the Chinese capital market would be more integrated and be less risky after 1999. The increase in the time trend of δ* is more evident for the Asian emerging markets than for the developed economies after 1999.
Ⅵ. Conclusion and policy implication
This paper explores a risk adjusted interest parity model to investigate the degree of market integration in China relative to the U.S., Japan, the U.K, Singapore, Korea, Malaysia, and Thailand from January 1994 to July 2008. Inferences were focused on the tests of the risk adjusted interest parity derived from the perspective of the portfolio model, which considers the market risk for international capital flows. In particular, this study examined how the degree of integration of the Chinese capital market evolved over time, especially after the structural changes in the Chinese capital market since 1999. Using the monthly data of the sample economies, evidence was found to strongly support our hypotheses, and is as followings: Significant market risk exists in the Chinese capital market and the existence of risk could explain the failure of the uncovered interest parity between China and the other countries. The Chinese capital market became more integrated with other Asian markets after its structural changes in 1999. It seems that capital flows to developed markets have mainly been for portfolio purposes while capital flows to the Asian markets from China have been for arbitrage purposes. The effects of return differentials and market risk are divided between the developed economies and the Asian markets, depending on the direction of capital flows. Inferring from the evidence, there must have been some biased restrictions toward capital outflows by the Chinese government.
Even after the recent development and reforms of the Chinese capital market, capital controls still remain in place to ensure adequate availability of external funding and to maintain the stability of the Chinese Yuan exchange rate. In view of the lack of research focused on how these policy changes have affected the degree of integration and the risk of the Chinese capital markets, this study has meaningful implications for academia as well as practical applications. It provides a unique measurement of market risk and can provide guidance in the formulation of effective policy.


![Estimation of Market Risk and δ* from [Δst ? (rt ― rt*)] = c0 + c1rt* + et](http://oak.go.kr/repository/journal/16796/NRF001_2011_v15n2_21_t0007.jpg)


