The ICT (information and communication technology) manufacturing sectors have played an important role as one of the key sectors in the Korean economy. Its importance has been rapidly growing since the latter half of the 1990s. Korea is now renowned for its skills and technology in this area as one of the leading countries in the world. However, it is uncertain whether the ICT industry in Korea can maintain its remarkable growth in the future as well, because of severe competition with other countries. Recently, the competition of the ICT sectors has largely increased with sophisticated technological innovations, particularly in the areas of telecommunication and broadcasting. This trend of the sectors is evident from the fact that, although the goods related to the sectors has steadily increased in exports, various indicators related to the ICT industry have declined in the recent years. This implies that the ICT sectors in Korea are now at a turning point.
In this paper, we examine the relative contribution of input-output factors to the growth of the Korean ICT manufacturing sectors and propose a policy direction for the development of the country’s ICT sectors in the future. For this purpose, we focus on analyzing the growth trends of the supply and demand factors (intermediate demand, final demand, exports, and imports, etc.) in the IO tables using Structural Decomposition Analysis (SDA) and on examining the interrelationships between sectors. The main difference of our research from the previous studies can be distinguished into three categories. First, we use a cross-sectional input-output table data series for the sample period of 1995-2008.1 Second, unlike most of the previous studies that used an
The paper is organized as follows. Section 2 briefly reviews the current literature. In section 3, we discuss the basic methodology used in this study and the classification of the Korean ICT sectors. In sections 4 and 5, we empirically examine the main factors that affect the growth of the ICT sectors in terms of final demand, exports, imports for final and intermediate goods, and technical changes. Finally, we provide conclusions and a couple of policy implications in section 6.
1However, the sources of the demand should not be regarded as explaining structural changes in terms of causality. It explains only ex post concomitance. 2In the case of the arithmetic averages of Paasche’s and Laspeyres’s price formula, if the total sums of the denominator in the absolute difference decomposition formula have positive and negative values, the value of the denominator is small. Thus, the value of the growth contribution by the structural decomposition has a tendency to be larger than the original value. However, if we use the mid-point weighting values in the formula, we can have the advantage that this offsetting problem disappears in the process of calculations.
The IO-SDA method has been extensively used to compare cross-sectional contributions between countries in order to assess the composition of structural changes. As a general method to figure out structural changes in an economy, SDA was first developed by Chenery (1960), Chenery et al (1962), and Leontief (1963) . Several authors, for example, Dervis et al (1982), Kubo et al (1986), and Sakurai (1990) have further refined the methodology. The central idea of the method is that changes in a variable can be decomposed into the changes in its determinants, normally using an additive calculation. In this way, it is possible to quantify the underlying source of the changes. A significant volume of the literature related to the SDA methodology and its application has been mostly developed in recent years. In this context, a large number of empirical articles on the SDA method have been published in Economic Systems Research. For examples of these articles, see Rose and Caster (1996), Albala-Bertrand (1999), Alcala et al (1999), Mukhopadhyay and Chakraborty (1999), Dietzenbacher and Los (1998, 2000), Drejer (2000), Du Ering and Schnabl (2000), Jacobsen (2000), Shishido et al (2000), de Haan (2001), Hitomi et al (2000), Kagawa and Inamura (2001, 2004), Fujikawa and Milana (2002), Roy et al (2002), Dietzenbacher and Stage (2006), Peters and Hertwich (2006), and De Boer (2008). For the case of Korea, research in this line has mainly concentrated on the issue of the economic impacts on either a specific sector or the whole sector. For examples, see Kim (1989) , Kim and Hong (1990), Jung (1998a, 1998b), Choi (1999), Yu (2000), Cho et al (2000), Park et al (2001), Gwag et al (2002), Oh and Gi (2003), Jung et al (2004), Park and Won (2007, 2008a, 2009b), Park and Lee (2008b, 2009a), Kim (2007), and Park and Jung (2008a, 2008b).
Ⅲ. The SDA Methodology and the Classification of the IT Manufacturing Sectors
In this paper, we follow the method suggested by Wyckoff and Sakurai (1992) who decompose the absolute differences of the real output growth through SDA. This approach analyzes the differences of the real output Δ

Let a

Further assume that, at the level of each sector, imports are demanded for intermediate goods inputs and for final goods use in fixed proportions

and

respectively.3 Then, we have

Substituting equation (3) into (2), we have

Let

These two matrices give the ratios of domestic-to-aggregate intermediate demand and domestic-to-aggregate final demand, respectively, which can be regarded as the indicators of import substitution. Using these expressions, equation (4) can be rewritten as

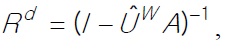
Solving for

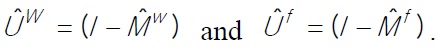
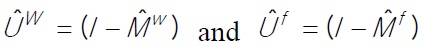
Notice that the first term on the right-hand side is the Leontief inverse matrix for domestic intermediates only and represents coefficients or weights, while the second term contains both domestic and foreign final demand and represents volumes. In order to simplify the notation, let

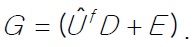
and

Then, the IO system becomes

The decomposition of changes in outputs, either in absolute growth or the growth rate, between the two periods amounts to calculating the first difference of equation (7). Then, we have

Either the first or the second term on the right-hand side can absorb the third term. If the first term absorbs the last term, then the calculation will be weighted by the terminal year of the structural


Since the derivation of these formulae are almost similar to each other, we use the Laspeyres weighting formula by letting the interactive term be absorbed by the second term. The two terms on the right-hand side of equation (10) can be decomposed as equations (11) and (12).


Therefore, the total decomposition for the absolute growth or variation in total outputs is equation (13) for the Laspeyres method and (14) for the Paasche method, respectively.


Substituting
into equations (13) and (14), we have the following equations (15) and (16).5


The decomposition for the growth rate of total outputs can be obtained by dividing equation (15) or (16) element-wisely by X. Each of the five terms on the right-hand sides of equations (15) and (16) in variation or growth terms represents a direct and indirect contribution to the gross output of the economy. In empirical studies, however, the calculation of the structural decomposition is usually based on the first-year weights, last-year weights or their arithmetic averages. In the case of using the ex ante mid-point weights, we have the equation (17).6
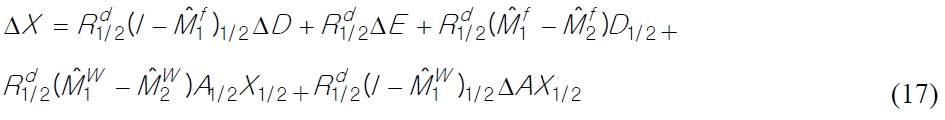
Each term in equation (17) can be interpreted as a relative contribution of its term on gross outputs,

Domestic final demand expansion (FDE)

Export demand expansion (EDE)
Import substitution of final goods (ISF)

Import substitution of intermediate goods (ISW)
Changes in IO technical coefficients (IOTC).
Each term in the decomposition is multiplied by the elements of the Leontief domestic inverse. The terms therefore capture both direct and indirect impacts of each causal expression on the gross outputs by taking account of the linkages through the induced intermediate demand. In the decomposition equation, import substitution is defined as arising from changes in the ratio of imports to final demand. This implicitly assumes that imports are the perfect substitutes for domestic goods, since the source of supply is a part of the whole economic structure. The aggregate contribution of import substitution to growth is sensitive to the level of disaggregation.
2. Classification of the ICT manufacturing sectors
There is no standard industrial classification for ICT sectors. Each country uses its own criterion, but there is no big difference between them. In the case of Korea, there are three classification systems created by the National Statistics Office (NSO), Bank of Korea (BOK), and the Ministry of Information and Telecommunications. In this study, the second one is mainly used, but we must also partly consider the first one. Thus, the ICT sectors are classified as the electronic parts, computers, audio and video, and communication equipment manufacturing industries (ICT sectors are included into the C26 in the Korean Standard Industrial Classification (KSIC) of the NSO).7
According to the year 2005 input-output table published by the Bank of Korea, the ICT manufacturing sectors are included in electronic and electrical equipment (13) among the total 28 sectors. With a total of 77 sectors, the ICT sectors can be categorized as electronic components and accessories (43), audio, video and communications equipment (44), and computers and office equipment (45), respectively. In a more broadly classified system, the ICT manufacturing sectors are listed as electronic signal equipment (098), semiconductors and related devices (099), other electronic components and accessories (100), audio and video equipment (101), communications and broadcasting equipment (102), computer and peripheral equipment (103), and office machines and devices (104), respectively. In this research, we use the constant input-output tables of the basic prices for year 2005 to obtain the Leontief inverse coefficients and the indices on the composition of aggregate demand. Aggregate demand and supply compositions are based on the 350 sectors integrated from 403 basic sectors. Then, the 350 sectors are classified into 168 and 78 sectors in small groups, which are again reclassified into 28 sectors in medium-sized groups and 8 sectors in large groups.
3The symbol (∧) indicates a diagonal matrix of compositional factors. 4The numerical results from the two alternative weightings are not equivalent, if the interaction term is large. To correct this problem, several methods have been proposed, such as re-weighting the terms and creating an appropriate divisia index. However, a simple method that distributes the interactive term proportionally in the other two terms is to take an arithmetical average of Paasche’s and Laspeyres’s weighting results. This appears to provide a good approximation, as argued by Dietzenbacher and Los (1998) and empirically used by Chenery and Syrquin (1986) and Wyckoff and Sakurai (1992). 5Equations (15) and (16) can be obtained from equation (6) by differentiation. 6For example, the formula calculating the mid-point weightings is 7According to KSIC, electronic component and accessories manufacturing industries (C26) is sub-divided into the semiconductor manufacturing industry (C261), the electronic parts manufacturing industry (C262), the computers and peripheral equipment manufacturing industry (C263), the communication and broadcasting equipment manufacturing industry (C264), the audio and video equipment manufacturing industry (C265), and the magnetic and optical media manufacturing industry (C266).
Ⅳ. Trends of Backward and Forward Linkage Effects of the ICT Manufacturing Sectors
1. Trends of backward linkage effects of the ICT manufacturing sectors
As shown in <
In the year 2008, the total value of power of the dispersion index of the ICT sectors amounts to 0.924. While the direct impacts within itself amount to 0.582 (63.0%), the indirect impacts from other sectors show only 0.342 (37.0%), less than the direct impacts. The subsector which shows the largest direct impact is electronic components/accessories (0.352), followed by audio/video/communications equipment (0.199) and computer/office equipment (0.031). The sector which shows the largest indirect impact is services (0.112), followed by in order of electrical equipment/supplies (0.089)9, chemicals/drugs/medicines (0.035), basic metal products (0.024), non-metallic mineral products (0.018), etc.
Moreover, we can easily find the following points from <
2. Trends of forward linkage effects of the ICT manufacturing sectors
The forward linkages effects (degree of sensitivity indexes10) of the ICT manufacturing sectors have been summarized in <
When looking at the trends of total forward effects in ICT sectors and major industrial sectors in 2008, we easily find that the value of electronic components/accessories within the ICT is largest with 0.724 (and has been on the decrease since 1995). It is followed in order by audio/video/communications equipment (0.665, on the increase), computer/office equipment (0.630, on the decrease), etc. Second, among the small-sized classification, the value of the forward linkage effects of electric coils/transformers is largest at 9.815, followed in order by printed circuit boards (2.426), semiconductor devices (1.490), miscellaneous electronic components (1.678), electric resistors/storage batteries (1.204), electric household audio equipment (1.090), etc. It means that these sectors have relatively more demands from other sectors. Third, among the other sectors, as of 2008, mining of the coal/crude petroleum/natural gas sector is largest with 12.066 (however, it shows irregular trends). It is followed in order by electricity/gas/steam/water supply (1.997, on the decrease), agriculture/forestry/fishing (1.682, on the increase), manufacturing sector (1.144, on the decrease), etc. Forth, among the manufacturing sectors, the value of printing/reproduction of recorded media is largest at 10.452 and has been on the increase since 1995. It is followed in order by non-metallic mineral product (9.751, on the decrease), wood and paper products (4.311, on the decrease), basic metal products (3.061, on the decrease), fabricated metal products (2.625, on the increase), chemicals/drugs/medicines (1.815, on the decrease), etc.
3. General trends of the main growth factors of the ICT manufacturing sectors
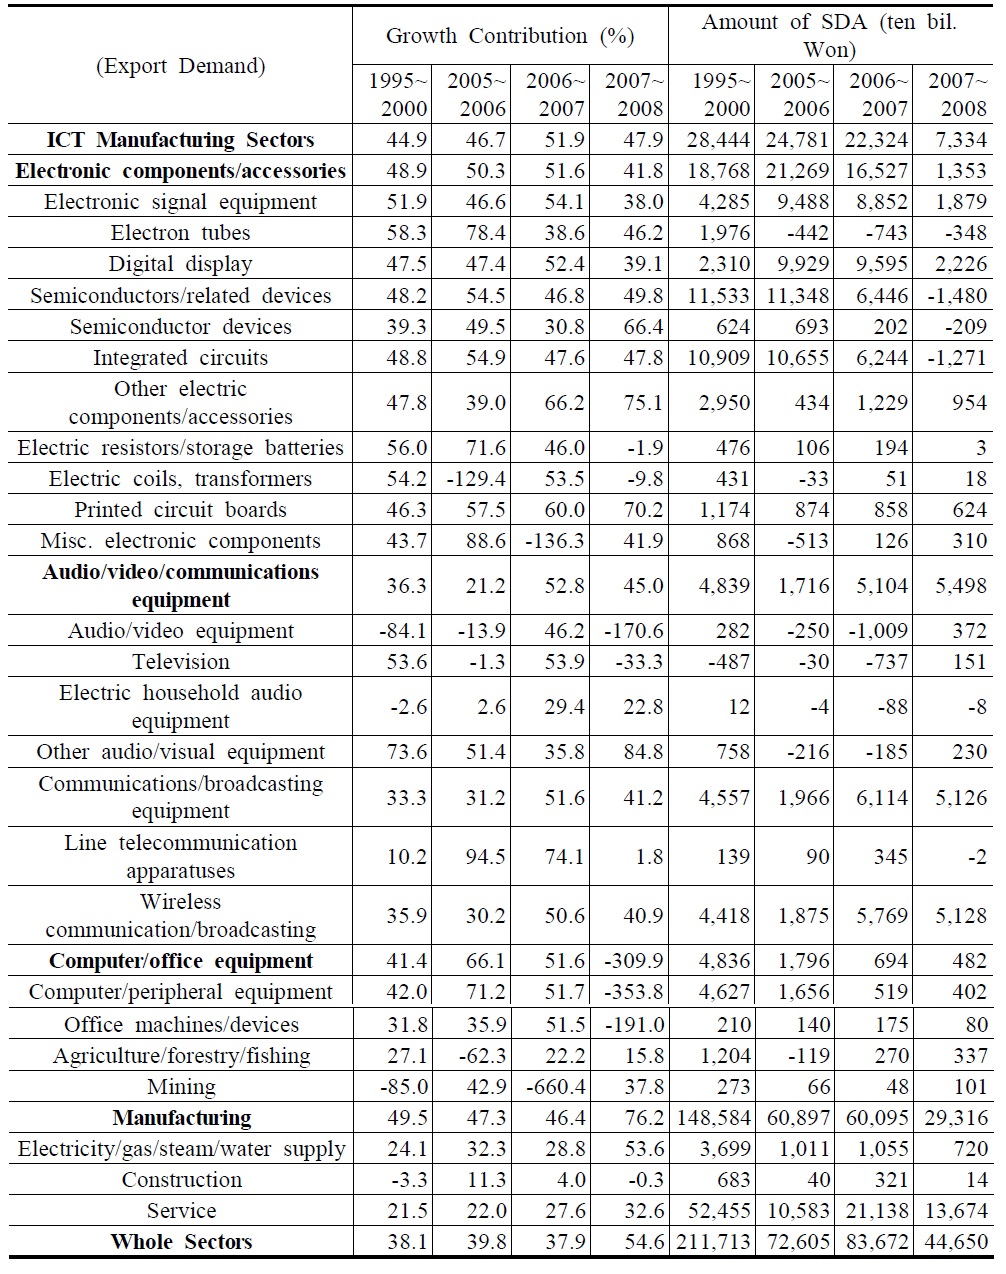
During the period of 1985-2008, the relative contribution of the input factors to the growth of the ICT sectors by absolute differences (mid-point weighting basis) is summarized in <Table 1>. We can easily find the following points. First of all, the contribution of each factor to the ICT sectors can be ordered as: final demand with 52.2%, export demand with 48.7%, import substitution for intermediate goods with 0.6%, import substitution for final goods with 0.2%, and technical changes with -1.7%. Thus, the main contributions to the growth of the ICT sectors are due to final demand and export demand with the total sum of 100.9%.
[Table 1] Trends of the Main Growth Factors that Contributed to the ICT Manufacturing Sectors
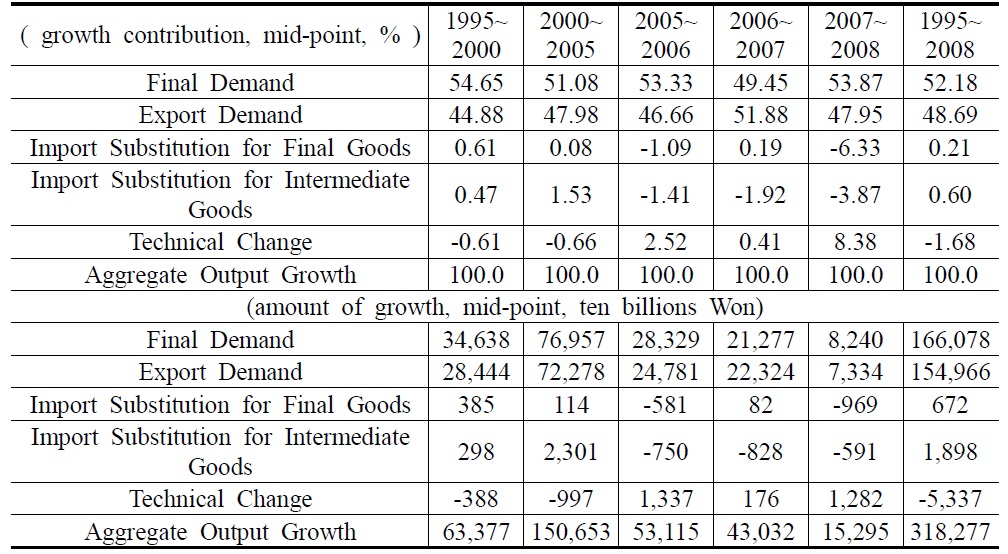
Trends of the Main Growth Factors that Contributed to the ICT Manufacturing Sectors
Second, during these periods, the growth contribution by final demand has been on the decreasing trend, while that by export demand on the increasing trend to the contrary. For example, the overall contribution of final demand and export demand to the growth of the ICT sector stand at 54.7% and 44.9%, respectively in 1995-2000. However, in the years of 2007-2008, the impacts of final demand (53.9%) and that of export demand (48.0%) have been reversed. The reason of this reversal can be explained as follows: although the values of production-inducement coefficients (mid-point weighting) have been increased, the values of gross output, domestic final demand, and export demand have turned out to be negative on a large scale, (see,
Third, the contribution of export demand has been gradually promoted to 51.9% in 2006-2007 from 44.9% in 1995-2000 (44.9%→48.0%→46.7%→ 51.9%), except for the years of 2007-2008. This general trend does not seem to change so that export demand has been, is and will be an important factor of ICT growth. It strongly indicates that the growth of the ICT sectors is dependent upon more overseas factors than domestic ones.
Forth, the contribution of technical changes shows a positive impact after 2005, even though it is irregular during the whole analysis period.12 More specifically, the contribution of technical changes has been changed from -0.6% (1995-2000) and -0.7 (2000-2005), to 2.5% (2005-2006) and 0.4 (2006-2007). During 2005-2006, its impact is rather large, 2.5%. This is because that the imported intermediate goods input ratio to total input has risen sharply, and the amount of gross output and the value of the total input coefficient13 have been increasing on the whole. More specifically, the contribution of technical changes has been greatly changed from -0.7% in 1995 to 2.5% in 2000 and 0.4% in 2005, before and after the IMF financial crisis. It indicates not that technology itself has fluctuated, but that specific input coefficients (particularly imported intermediate goods) influencing the contribution to technical change has fluctuated before and after 2000. Furthermore, this fluctuation is also related with the increase of imported goods resulted from the fluctuations of the foreign exchanges rate. We will explain it in the concluding remarks in more detail.
Fifth, the contribution of import substitution for final goods has been weak in the period of the whole analysis, sometimes with ups and down, and going from negative to positive impacts and vice versa. Then, its impact has recently turned to a negative one at -3.9% (2007-2008). This strongly indicates that import demand has surpassed domestic demand. 14 A similar analysis can be applied to the case of the contribution of import substitution of intermediate goods. Its impact has been rather weak compared to other factors and has recently shown continuous negative signs, indicating that the import demand has surpassed domestic demand so that the use of domestic inputs (the so called localization ratio) has been greatly reduced.15
8It refers to the impact to the whole industries that resulted from the increase of one unit of final demand for products of a certain industry. The power of the dispersion index can be calculated by using the production inducement coefficient matrix. It can be attained by dividing the total of vertical lines of the production inducement coefficient of a certain industry by the average of the all-industry production inducement coefficient. The more domestically made intermediate goods (here ICT sectors) are used as input for production of a certain industry, the bigger the power of the dispersion index appears such as primary iron/steel products, electrical equipment/supplies, and electronic components/accessories. The power of dispersion coefficient = (here, n; number of sectors, r; production inducement coefficient, e; unit row vector, e’; unit column vector) 9The coverage of the electronic and electrical equipment sector is greater than that of the ICT sector. Thus, the value of the index for electrical equipment/supplies (0.089) can be obtained by subtracting the value (0.582) of ICT sector from that (0.672) of electronic and electrical equipment. 10It indicates the impact to a certain industry (here, ICT sector) when one unit of final demand for products of all-industries increases. The degree of the sensitivity index can be obtained by dividing the total of horizontal lines of the production inducement coefficient of a certain industry by average of the all-industry production inducement coefficient. The more goods of a certain industry are used as intermediate goods for production of another industry, the bigger the degree of the sensitivity index emerges, such as chemicals/drugs/medicines. The degree of sensitivity coefficient = (here, n; number of sectors, r; production inducement coefficient, e; unit row vector, e’; unit column vector). 11As we can see from equation 17, we need to assess the changes behind the variables of SDA rather than just mechanically interpreting the growth contributions of SDA. Therefore, we should be careful in analyzing and explaining the results of SDA and the sign changes of background variables behind SDA. 12The effect of technical changes indicates the impact of changes in a specific sector’s input coefficients on other factors through the transactions input for intermediate goods. 13The imported intermediate goods input ratio to total input has sharply increased from 40.3% in 2000 to 45.2% in 2005 and 46.6% in 2006 and has shown a big change between 2000 and 2005. Meanwhile, the total input coefficient has also changed from 0.036 in 2000 to 0.052 in 2005 and 0.057 in 2006 (See the 5th term of equation 17). 14The average growth rate of the imported final demand ratio to total final demand in ICT sectors has changed from 15.8% in 1995-2000 to 0.5% in 2000-2005 and -4.5% in 2006-2007, respectively. The mid-point weighting amount of final demand has been repeated with ups and downs from 46.4 trillion won to 65.2 trillion won, 21.1 trillion won in the same period. This is because that the value of got to be negative when the value of terminal year is larger, and that the value of SDA is determined by combined with production inducement coefficient. 15As a matter of fact, the ratio of domestic intermediate goods inputs has been continuously decreasing from 57.0% in 2000 to 45.3% in 2005, 43.6% in 2006, etc. According to the changes of the ratio of domestic intermediate goods input, the localization ratio has fluctuated from 65.0% in 2000 to 72.4% in 2005, 68.8% in 2006, etc.
Ⅴ. Trends of Relative Growth Rates by Factors Contributing to the ICT Manufacturing Sectors
We will explain the contribution of each factor to the growth of the ICT industry in more detail, concentrating largely on the recent trends after 2000, and particularly the years of 2007-2008 with an in-depth explanation behind the change of the contribution of each factor.
1. Trends of growth rates by the Final Demand contributing to the Korean ICT sectors
The contribution of final demand to the growth of the ICT sectors has been in decline since its peak of 54.7% during the years of 1995-2000. It shows a 49.4% contribution to the growth during the years of 2006-2007. Meanwhile, it shows a 53.9% contribution during 2007-2008. This is a quite higher level than that in 2006-2007, but it actually indicates a negative growth rate. Let us explain this negative growth in more detail by explaining the changes of relevant variables behind the SDA. The following facts can be easily found in the appendix (See
The contribution rate of final demand to the growth of manufacturing and the whole sectors has shown the opposite trend to that of the ICT sectors, except in 2007-2008. As is shown in <Table 2>, their contribution rates are gradually increasing from 49.3%, 55.3%, 56.9% in manufacturing and 62.0%, 61.6%, 64.7% in the whole sectors, respectively. As is shown in this analysis, the decreasing trend of the contribution rate of final demand to the ICT sectors is expected to continue if there is no drastic change in its industrial structure, which we expect is difficult to occur. Therefore, we must concentrate on how to improve the level of domestic demand and final demand, to boost this industry.
From the trend of the medium-sized classification, the sector that showed the highest rate of contribution would be computer/office equipment (60.7%) and the sector with the lowest rate would be electronic components/accessories (48.5%) in 2006-2007, which is the nearest year among the years when the ICT growth rate has been positive. In the case of the latter, although the SDA amount of total output is the highest (32 trillion won) among others, the SDA of final demand is also relatively high at 15.5 trillion won so that the contribution rate would be comparatively lower (15.5/32). Meanwhile, in the case of electronic components/accessories, the SDA of total output and final demand is 1.3 trillion and 0.8 trillion won, respectively so that the contribution rate of final demand would be relatively higher (0.8/1.3) (see, Table 2, Appendix
In terms of the small-sized classification, the sector which has shown the highest contribution of final demand would be office machines/devices (62.0%), and the sector with the lowest contribution would be other electronic components/accessories (40.5%) in 2006-2007. <Table 2> shows that the rate of contribution of all the small-sized sectors has been gradually decreasing from the top of 2005, excluding the sector of electronic signal equipment. As was indicated before, it should be noted that the domestic market deteriorated in 2007-2008, which has been suggested by the negative signs of SDA-related statistics. We will discuss this phenomenon in more detail in the next section.
[Table 2] Trends in the Contribution by the Final Demand
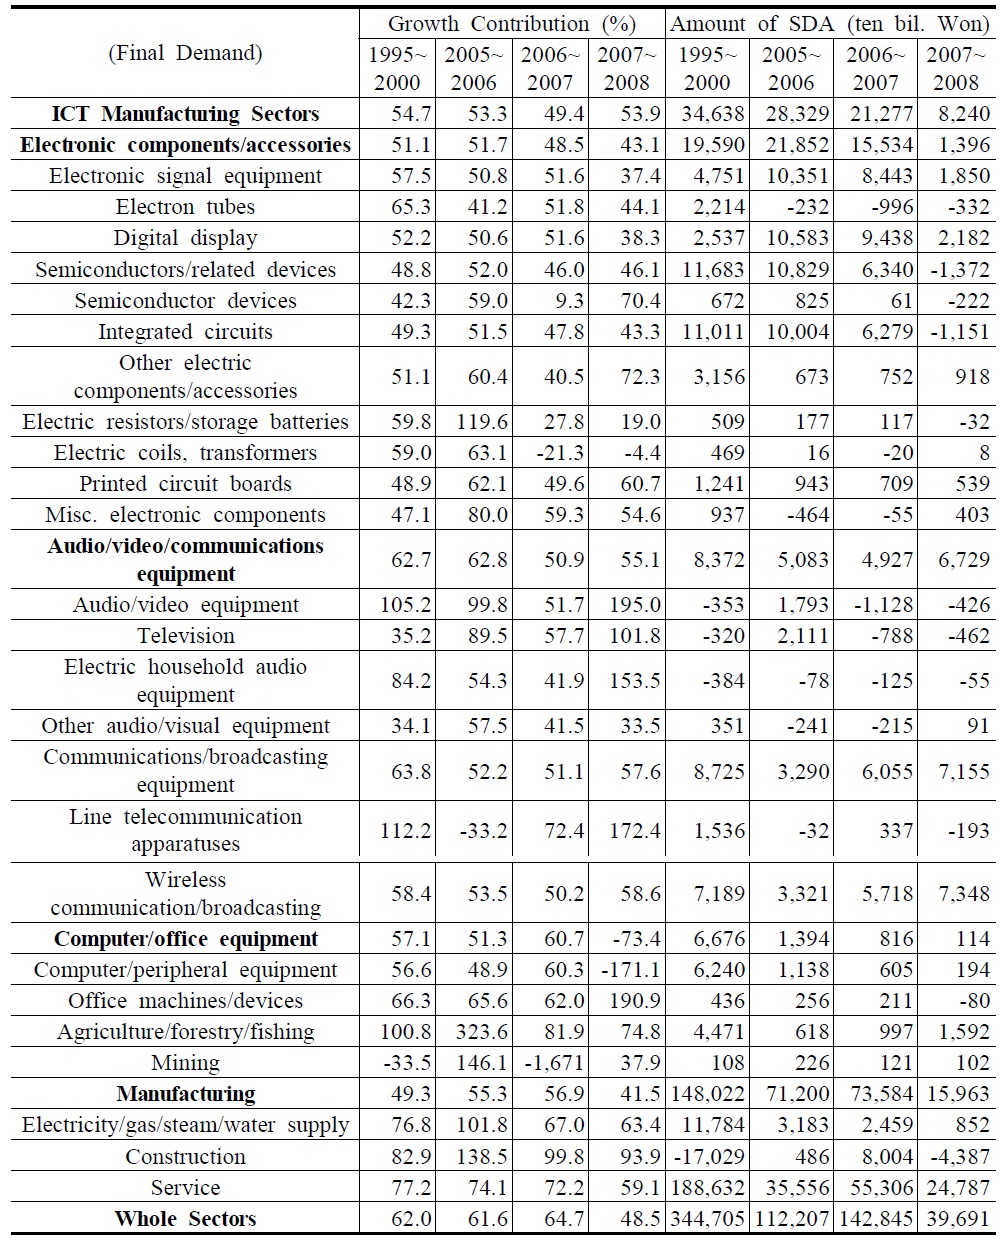
Trends in the Contribution by the Final Demand
2. Growth Contribution by Export Demand
The effect of export demand on the growth of the Korean ICT manufacturing industry increased to 51.9% during the years of 2006-2007 from 44.9% during the years of 1995-2000. This is a higher level than the averages of the whole industry (37.9%) and the manufacturing industry (46.4%). This fact strongly indicates that export demand is a very significant factor for the continuous development of the ICT manufacturing sector. The reason of the contribution by export demand to the ICT sectors has continuously arisen since the years of 1995-2000 can be figured out from the following changes: 1) mid-point average of production-inducement coefficient (see equation (17) and Appendix
<Table 3> shows that the contribution of export demand to the growth of manufacturing industries has gradually decreased since the years of 1995-2000, and that of the whole sectors (industries) has followed the same trend of as former since the years of 2000-2005. This trend is definitely different from that of ICT sectors where the contribution of export demand has generally increased. In the years 2006-2007, the rates of the contribution of export demand to manufacturing sectors, ICT sectors, and whole sectors are 46.4%, 51.9%, and 37.9%, respectively. The first thing to note is that the contribution rate of export demand to the growth of manufacturing industries would be greater than that of services, agriculture/forestry/fishing, and the whole sectors (economy as a whole). It seems to be due to the innate characteristics of the manufacturing sectors themselves. The second thing to note is that the contribution rate of services has shown a steady increase, which indicates the increasing relationship between the domestic services industry and foreign demand. The final one to note is that although the contribution of export demand in ICT sectors is in the trend of continuous increase, the annual increasing rate of export demand in ICT sectors (as well as manufacturing sectors as a whole) is on the opposite trend. We must keep in mind this trend in suggesting policy implications for ICT sectors.
[Table 3] Trends of the Contribution by the Export Demand

Trends of the Contribution by the Export Demand
In terms of the medium-sized classification, the effect of export demand on the electronic components and accessories sector has been continuously increasing from 48.9% (1995-2000), 50.3% (2005-2006), and 51.6% (2006-2007). The main components of this sector are semiconductors and related devices, which have greatly contributed to the growth of Korean ICT industries. In the case of the audio, video and communications equipment sector, the impact of export demands shows ups and downs periodically, after becoming lower by 21.2% during the years 2005-2006, and has gone up to 52.8% during the years of 2006-2007. In the case of the computer and peripheral equipment sector, the contribution to the growth was small with 51.6% during the years 2006-2007. This is compared to its peak of 66.12% during the years of 2000-2005 and 41.4% during the years 1995-2000.
In the case of the small-sized classification, we can find that the sector that has shown the highest contribution to growth by export demand, 66.2%, in the years of 2006-2007 is the other electrical equipment and supplies sector. Although the contribution rate of this sector is high, SDA exports and outputs are relatively small, with 1,200 and 1,900 billion won, respectively. Meanwhile, the contribution rates are relatively small in the sectors of electronic signal equipment (54.1%), semiconductors (46.8%), and communications/broadcasting equipment (51.6%). However, their SDA absolute values are rather high compared to the other electrical equipment and supplies sector. For example, in the case of semiconductors, SDA exports and output are 6,400 and 13,800 billion won, respectively (See Appendix
3. Growth Contribution by Technical Changes
The contribution by technical changes to the ICT manufacturing industry has declined after reporting 2.5% during the years of 2005-2006 and was 0.4% during the years of 2006-2007. However, the first thing to note is that the rates of contribution have shown positive signs since 2005. Secondly, the impact of the technical change has been negative in the years of 1995-2000. The positive or negative impact is determined by the difference between the annual growth rate of the input ratio of imported intermediate goods and that of aggregate inputs.16 For example, the negative impact occurs whenever the former is greater than the latter, resulting in more imported intermediate goods being used. Using equation (17), this can be explained with the contribution from technical changes being affected by both the changes of the input ratios of imported intermediate and those of aggregate input coefficients of intermediate goods.
[Table 4] Trend in the Contribution by the Technical Changes
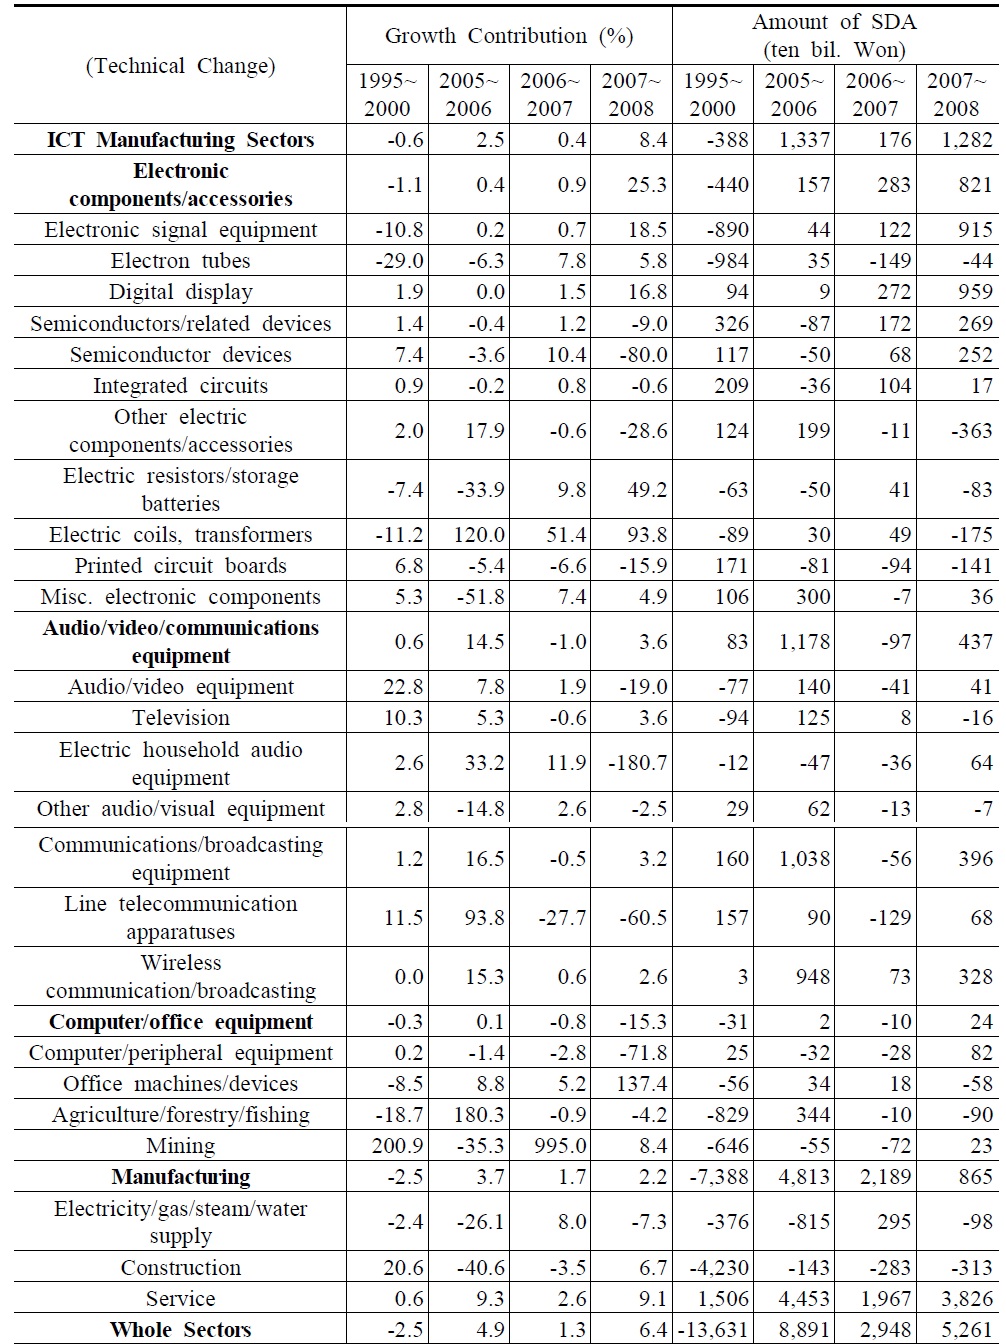
Trend in the Contribution by the Technical Changes
The contribution by technical changes in the ICT manufacturing industry is at a lower level than the average of the whole industry (1.3%) and the average of the manufacturing industry (1.7%) in the years of 2006-2007. As explained above, the reason of why the contribution through technical changes in the ICT manufacturing industry has dropped suddenly during the years of 2006-2007 as compared with those ahead by just one period, can be found in the variations of two factors. That is, it is due to the increase of the input ratios of imported intermediate goods and to the drastic fluctuations of aggregate input coefficients.
The contribution trends by technical changes in the case of industries such as the audio/video/ communications equipment (14.5%→-1.0%) and the computer/office equipment (o.1%→-0.8%), during the years of 2005-2007 has shown a negative contribution. On the other hand, the electronic components/accessories (0.4%→0.9%) shows a slight increase. In terms of the small-sized classifications, industries such as other electric components/accessories (17.9% →-0.6%), the audio/video equipment (7.8%→1.9%) and the communications/broadcasting equipment (16.5%→-10.5%) have drastically declined during the past periods.
4. Growth Contribution by Import Substitutions for Final Goods
The contribution by import substitution for final goods to the growth of the total outputs in the ICT manufacturing industry shows a small effect with sometimes negative signs after 2005. The negative impact means that imported final goods are more used in production than domestic ones, and vice versa. According to equation (17), the direction of the impact (positive or negative) of the import substitution for final goods is determined by the amount of SDA total output (Δ
since production-inducement coefficients and domestic final demands have always possessed positive signs. However, it would be better for us to begin to analyze the impact of import substitution from the small-sized classification, since the total amount of specific sectors in the medium-sized classification, which is the simple summary of its small-sized classification, can be seriously impacted by its specific small-sized subsector. For example, the direction of impact (positive or negative) of a specific sector can be mostly determined by the amount of one particular subsector.
[Table 5] Trends in the Contribution by Import Substitution for Final Goods
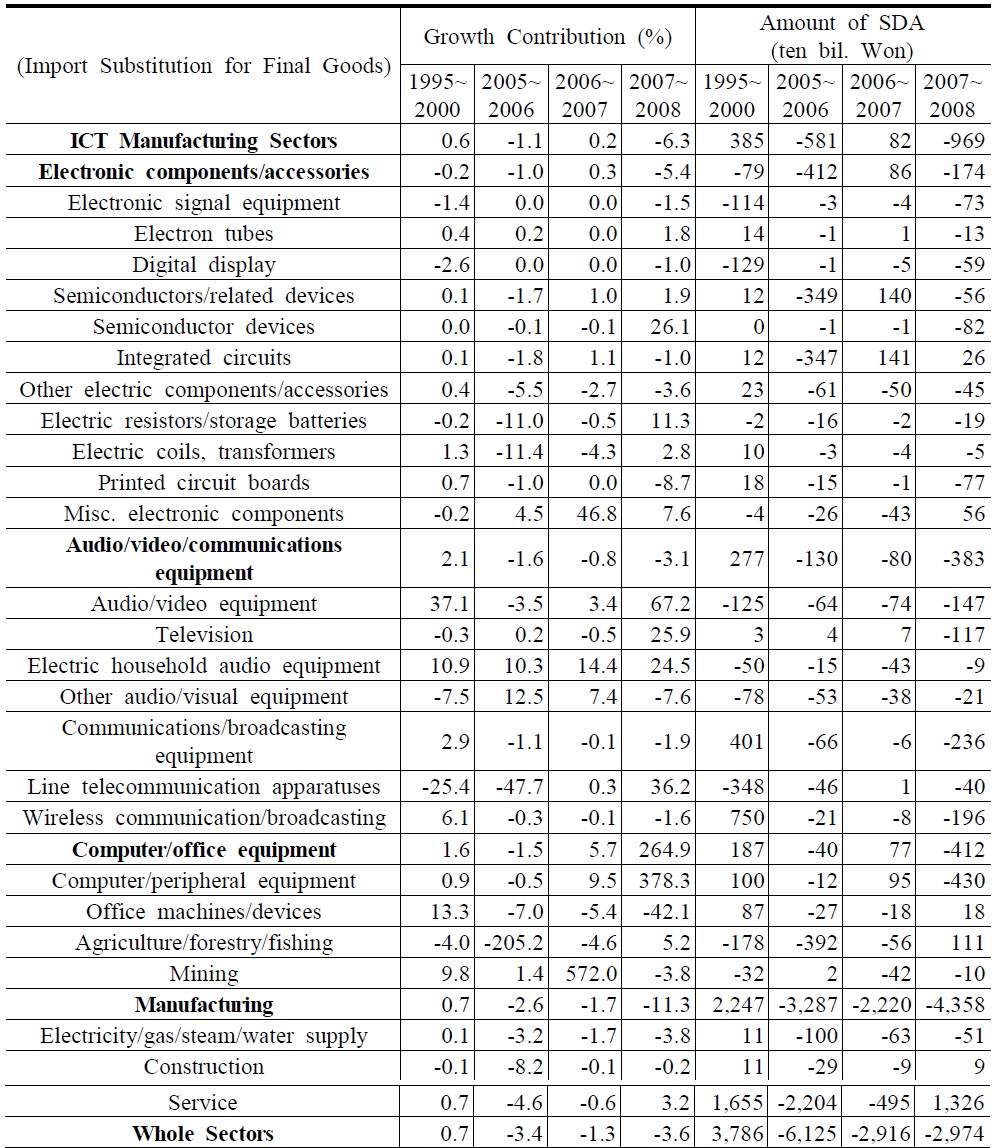
Trends in the Contribution by Import Substitution for Final Goods
Let us provide some examples. In the case of the small-sized classification in the years 2007-2008, the computer/peripheral equipment sector shows the highest contribution, 378.3%. However, we can easily find that while the amount of SDA substitution of imported final goods is -0.43 trillion won (Table 5), the value of

is -0.10 trillion won (Appendix
is -0.10 trillion won. In other words, there would be a positive (negative) contribution if the absolute difference of the imported final goods

is positive (negative). Therefore, we must be careful in analyzing the impact of the substitution of imported final goods, paying attention to the signs of the underlying factors. Taking into consideration the above explanation, we can find small-sized sectors which show positive contributions in the years of 2007-2008. The sectors of integrated circuits, miscellaneous electronic components, and office machines/devices have the positive SDA values (because of positive
values) of 0.026, 0.056, and 0.018 trillion won, respectively (see, Table 5). Thus, the contribution in these sectors is positive, indicating that more domestic final goods are used. However, we also find that SDA total amounts of these sectors are -2.7, 0.74, and -0.004 billion won respectively (see Appendix
In the case of the medium-sized classification, all three sectors, electronic components/accessories (-5.4%), audio/video/communication equipment (-3.1%) and computer/office equipment (264.9%), have shown negative contributions, although the latter has shown a positive contribution. As is explained before, the case of the latter should be regarded as negative since
is negative. Thus, the dependency ratio to imported final goods has been greatly promoted to all three sectors. Similar analysis can be applied to all the results suggested in <Table 5> (See Appendix
5. Growth Contribution through Import Substitution for Intermediate Goods
The contribution through import substitution for intermediate goods to the gross outputs of the ICT manufacturing industry is not so important, particularly with the negative signs since 2005.
The contribution for intermediate goods has a similar structure to that of final goods. According to equation (17), the direction of impact (positive or negative signs) is determined by the amount of SDA total output (Δ
for the same reason explained in the previous subsection. When
and (Δ
is positive and (Δ
is negative, it can be regarded as a negative substitution contribution which indicates a higher dependency on imported intermediate goods. However, the real impact must be measured in its absolute value.
In the year 2007-2008, the small-sized classification sectors which show positive

values are digital displays (0.03 trillion won), line telecommunication apparatuses (0.05) and office machines/devices (0.0002) (See appendix
When we consider the absolute impact in the small-sized classification, we can find the sector that shows the highest negative substitution impact is the computer/peripheral equipment sector (318.5%), followed by the electronic household audio equipment sector (79.8%), the electronic resistors/storage batteries sector (22.4%), the electronic coils and transformers sector (17.5%), etc. We can make the same analysis in the medium-sized classification as well. In conclusion, the ICT industry shows a negative import substitution impact for imported intermediate goods, implying that the ratio of dependency on imported intermediate goods is on the rise.
[Table 6] Trends in the Contribution of Import Substitution for Intermediate Goods
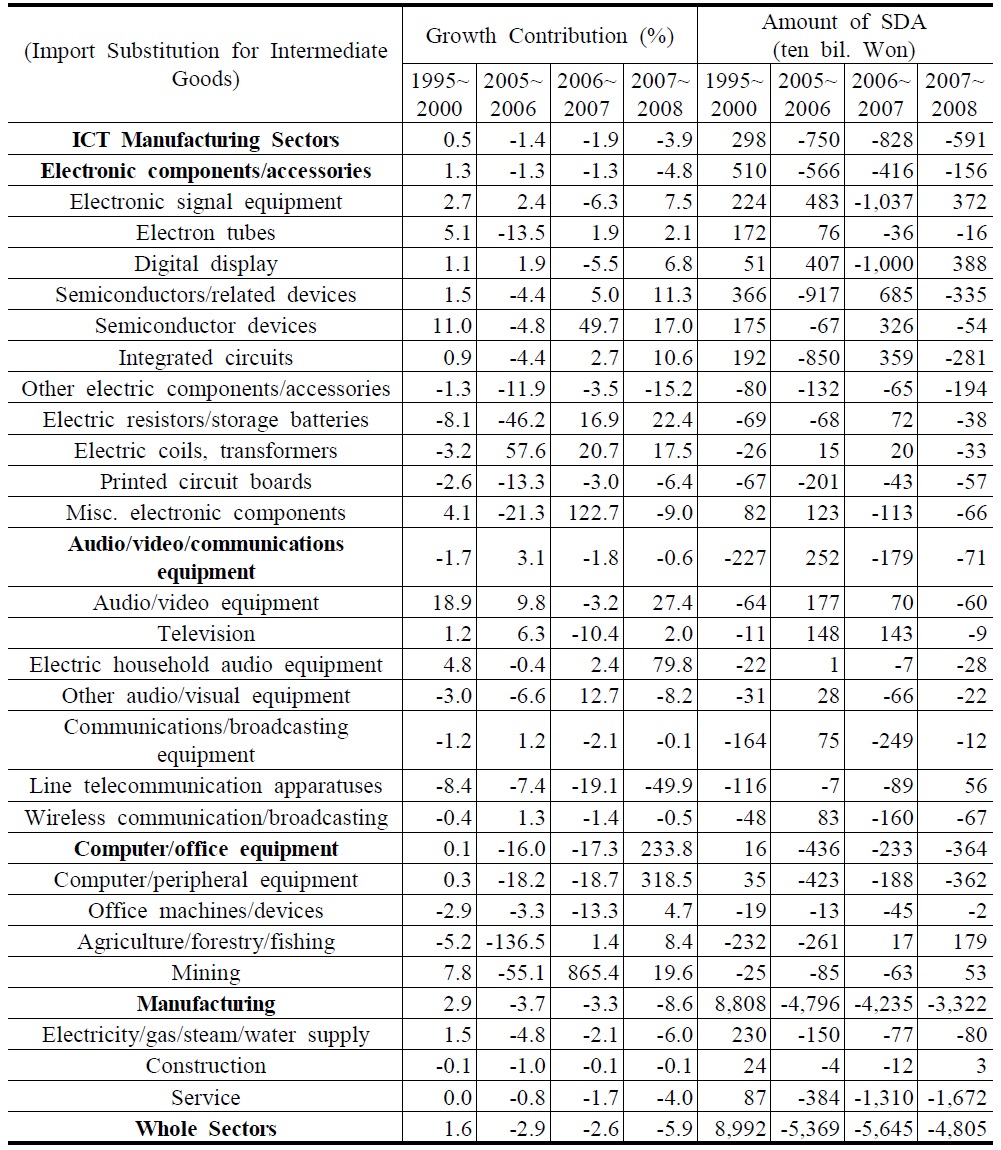
Trends in the Contribution of Import Substitution for Intermediate Goods
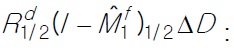
16The contribution effect by technical changes can be divided into two factors: the expansionary effects of production with respect to the changes of aggregate intermediate inputs (Rd1/2ΔAX1/2) and to the changes of imported intermediate inputs If it has a positive sign, the former is larger than the latter.
This paper has examined the relative growth contribution of input factors to the Korean ICT manufacturing sectors using the SDA analysis. The general results can be summarized as follows. First, the factors that contributed to the growth of the Korean ICT manufacturing sectors in 1995-2008 can be ordered by final demand (52.2%), export demand (48.7%), import substitution for intermediate goods (0.6%), import substitution for final goods (0.4%), and technical changes (-1.7%), respectively. This fact means, first of all, both the final demand and export demand are the largest contribution factors to the growth of Korean ICT sectors. Second, the growth contribution by final demand has been on the decrease. On the contrary, the growth contribution by export demand has been on the increase. For example, the amounts of contribution by final demand and export demand were 54.7% and 44.9% respectively in 1995-2000, while those in 2006-2007 were 49.5% and 51.9%, respectively. It generally indicates that we should pay more attention to promote domestic final demand (consumption and investment) as well as overseas demand for the continuous growth of the ICT sectors.
In more detail, we can find out the following facts examining the growth contributions by each compositional factor. First, as explained before, the contribution by final demand has been on the decline in recent years, from 54.7% in 1995-2000 to 49.4% in 2006-2007. It indicates the role of final demand in the growth of the ICT sectors has been on the decrease as well. Second, the growth contribution by export demand has been on the gradual increase since 1995. The amount of contribution was just 44.9% in 1995-2000, but has jumped to 51.9% in 2006-2007. This change was larger than that of the manufacturing sector and the whole sectors, 37.9% and 46.4% respectively. Thus, it would be a natural conclusion that export demand would be, is and possibly will be the most important factor for the continuous growth of the ICT sectors. Third, the contribution by technical changes has been positive since 2005, although its impact has been rather weak and has shown ups and downs periodically. The turning point of its impact would be a period around the IMF financial crisis, when its contribution changed from a negative value, -0.6%, to a positive one, 2.5% and 0.4%, etc. However, it has been on the slight decline since 2005-2006. Forth, the contribution by import substitution for final goods has been on a decline in recent years, from its highest impact by 0.6% in 1995-2000 to a negative impact of -1.1% in 2005-2006. This is because import demand for final goods has surpassed domestic demand for final goods. Finally, the contribution by import substitution for intermediate goods has been relatively small and largely fluctuated before and after the year 2000. Its impact has been generally a positive one, but reversed to a negative one around 2000 and has continued to be negative. It indicates that import demand has grown faster than domestic demand, and that the ratio of imported intermediate goods input to total goods input has increased. As a result, localization ratios of domestic intermediate goods have been on a decline, compared to the previous periods.
Taking into consideration all the results of the analysis, we can find the following policy implications. First of all, it should be one of the priorities to find out some policy measures to promote and extend domestic final demand in the ICT sectors. As explained earlier, the impact of final demand, largely influenced by domestic consumption and investment, has been on the decrease since 1995, and has been lower than that of export demand in the recent years. This is caused by the cutbacks of domestic consumption and investment in the ICT manufacturing sectors, and thus by the increase of the dependency rate (particularly consumption) on the imported final goods. In theory, the impact of final demand should be small or non-existent if domestic consumption and investment are not sufficient or further decreased. In this context, the demand for investment and consumption for domestic final goods in the ICT manufacturing sectors should be encouraged and promoted for their mid-term and long-term development. For this purpose, as is explained in the part of backward and forward linkage effects, all measures to promote investment should be made in sectors such as chemicals/drugs/medicines, basic metal products, non-metallic mineral product, electrical equipment /supplies, and services sectors, which have shown the high backward linkage effects. It is also necessary that more investment should be made in the sectors related to components and materials, where R&D generally has large forward linkage effects on sectors such as transportation equipment, general machinery/equipment, construction, services, etc.
Second, it must be kept in mind that all practical measures should be made to increase and expand export demand. As analyzed in the previous sections, the impact of export demand has been on the increase, which is opposite that of final demand. Thus, we need to continuously reinforce and promote overseas demand in order to offset the decrease of contribution by final demand caused by the increase of consumption for the imported intermediate and final goods. Thus, considering the importance of export demand, it is required for us to not only to make efforts in expanding export markets for end-user commodities, but also to diversify the ICT manufacturing sectors related to components and parts, in addition to the increment of finished goods in exports. As is well known, success in expanding export markets will be dependent on the competitiveness of firms and their products in the ICT sectors, which could be greatly promoted mainly through the expansion of ICT-related R&D investment. Thus, we need to expand the continuous overseas demand through the development of compound and fusion services as well as promotion of R&D investment to components and new materials.
Third, as is explained in the contribution by import substitution for both final goods and intermediate goods, more imported goods inputs have been used in ICT production compared to domestic good inputs. It indicates that the degree of the dependency on the imported final and intermediate goods has been increased, resulting in the decline of localization ratios compared to previous periods. This further implies that the substitution ratio of domestic goods input to the imported goods input is on the decline. To solve this problem, we have to devise practical measures to enhance the competitiveness of the domestic ICT products. Maybe, such plans as enhancing brand-names and quality would be best examples for this purpose.
Finally, the contribution by technical changes is rather small compared to other growth factors. However, appropriate policy measures are required for its promotion since it is intimately related to the efficiency of total input ratios as well as the ratio of domestic intermediate goods input. Thus, we should devise suitable measures to continuously raise the contribution through technical changes. For this purpose, the basic policy should be directed to promote the price and quality of ICT input goods. The best example for this policy is a well-known one involving the expansion of R&D-related investment as well as that of productivity focused on human capital.