The carbon dioxide (CO2) concentration has rapidly increased up to about 380 ppm at present by activities of human beings, compared to about 270 ppm before the industrial revolution (Aber and Melillo 2001). The impacts of the combustion of fossil fuel and intense land-uses have caused the fluctuation and imbalance of carbon cycle and budget in regional and global scales (Maier and Kress 2000). In particular, the forest ecosystem accounted for about 90% of carbon stock on the aboveground part within the terrestrial ecosystem, and 40% of carbon stock on the belowground part (Waring and Schlesinger 1985). Therefore, mitigation management has focused on the forest ecosystem as the pivotal sink in reducing the atmospheric CO2 (Winjum et al. 1992).
About 10% of atmospheric CO2 is generated from the soil, and their amounts are reached about 10 times more than the CO2 emission according to consumption of the fossil fuel (Raich and Schlesinger 1992). As an index of metabolic activities through biological processes, the CO2 efflux from the soil surface is generally termed soil respiration, which plays major roles in the carbon cycle and budget of forest ecosystems (Anderson 1982, Landsberg and Gower 1997, Chae et al. 2003). Soil respiration mainly consists of two components: (a) heterotrophic respiration (HR) by soil microorganisms and soil animals that decompose litter and soil organic materials; and (b) root respiration (RR) from living plant roots and the associated mycorrhizae (Gough and Seiler 2004, Jassal and Black 2006). These biological processes are both largely affected by environmental factors, such as temperature, humidity, soil moisture content and soil physiochemical factors including litter supply, nutrients necessary for plant growth and soil bulk density in the forest ecosystems (Raich and Nadelhoffer 1989). However, because it is difficult to predict the spatio-temporal changes of soil respiration that results due to the complex variability of these factors, many studies should be established the correlation between the soil respiration and environmental factors (Mielnick and Dugas 2000, Xu and Qi 2001), and the carbon budget can be accurately expected through the quantitative measurement of soil respiration in various forest ecosystems (Wang et al. 2002).
In South Korea, forests occupy approximately 65% of the total terrestrial area (6.3 × 10⁶ ha). The Korean forest is composed of both deciduous and mixed forests (about 57% of the Korean forest area) and
We have attempted to investigate the seasonal variation of soil respiration, net primary production (NPP) and net ecosystem production (NEP) over the year in both the unburned and the burned
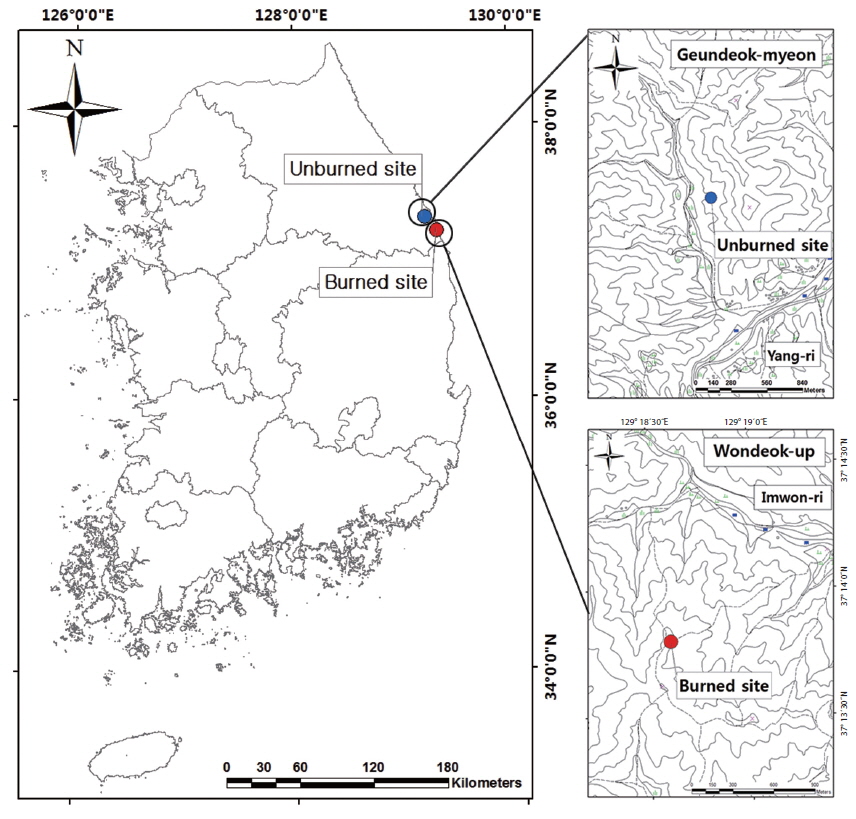
The subject area for this study is located in Samcheok-si, Gangwon-do, dominated by pine tree (
In July 2007, we established 4 permanent study plots (20 m × 20 m per one permanent study plot) on a gentle slope (about 10°~20°) in each burned and unburned site. Being as located in the eastern coast of Korea, the study area shows the higher mean annual temperature of 13.2℃ characteristic of the oceanic climate. The annual total precipitation and annual mean wind velocity were 1273.9 mm and 2.2 m/s, respectively. The precipitation is concentrated during the peak summer season (July and August), accounting for more than 50% of the annual total precipitation.
>
Biomass and net primary production
In 4 permanent study plots (the total area of 1600 m2) per each site, the biomasses of all vegetation were measured once a year during the experimental period from 2007 to 2012. In all standing trees of 4 permanent study plots, the diameter at breast height (DBH, at the 1.2 m height above the ground) and the height (H) were measured with measuring tapes and ultrasonic distance meters (Hagalöf Vertex Laser VL400; Sweden), respectively (Hoover 2008, Son et al. 2010). The basal diameter of trees more than 1 cm diameter at 10 cm height above the ground was measured. The standing biomass of tall trees was estimated using the biomass allometric equation by the DBH and H of pine trees in Gangwon-do (Son et al. 2010). The above-ground biomass of shrubs was estimated using the allometric equation established by Lee et al. (2004). In addition, the total below-ground biomass was estimated to be 25% of the total above-ground biomass (Johnson and Risser 1974). The harvest method was used for measuring the current total biomass of herb layers. The above- and below-ground parts of herbs were collected by clipping and/or digging from 3 random quadrats (2 m × 2 m) adjacent to the permanent study plot. The current biomass per unit area was calculated by weighing after drying until the constant weight at 60 ℃. The annual total amount of net primary production (NPP) was estimated by subtracting biomass of the previous year from biomass of the current year.
>
Measurement of soil respiration
In October 2011, we randomly selected locations of 2 sub-plots (120 cm × 80 cm) in each permanent study plot. Three soil collars (6 collars per each permanent study plot) made of cylindrical polyvinyl (10 cm in diameter and 7 cm in height) were inserted into the soil in each subplot to a depth of 2 cm. The above-ground vegetation was removed from inside the collars, but the surface litter was retained. Once inserted, the soil collars were left in place throughout the entire measurement period in each subplot. The form gasket ring was used to form an airtight seal between the soil collar and the soil respiration chamber. In situ soil respiration rates were measured once a month from November 2011 to October 2012 with by connecting to an infrared gas analyzer LI-6400 (Li-Cor Inc., Lincoln, NE, USA) based on the closed chamber method (Chae et al. 2003, Joo et al. 2011). The measurements were regularly performed between 10:00 and 14:00 h to avoid diurnal fluctuations as much as possible (Davidson et al. 1998). We calculated the daily mean values by assuming that the measured soil respiration rates were repeated over the day, and each sampling date was considered as the reasonable midpoint of a sampling period. To estimate annual soil respiration, we interpolated between sampling dates to estimate the mean soil respiration for each site each day of the year, and then computed the sum for the year (Davidson et al. 1998).
>
Measurements of environmental factors
The soil temperature and soil moisture content at the soil depth of 10 cm and the air temperature at 1.5 m height above the ground were automatically measured at 10 min interval for one year from November 2011 to October 2012 by installing each Data loggers (WatchDog 1000 Series; Spectrum Technologies Inc.) in the unburned and burned forest sites.
In
Differences between the mean values of the soil respiration rates for unburned and burned study sites were evaluated using the Student’s
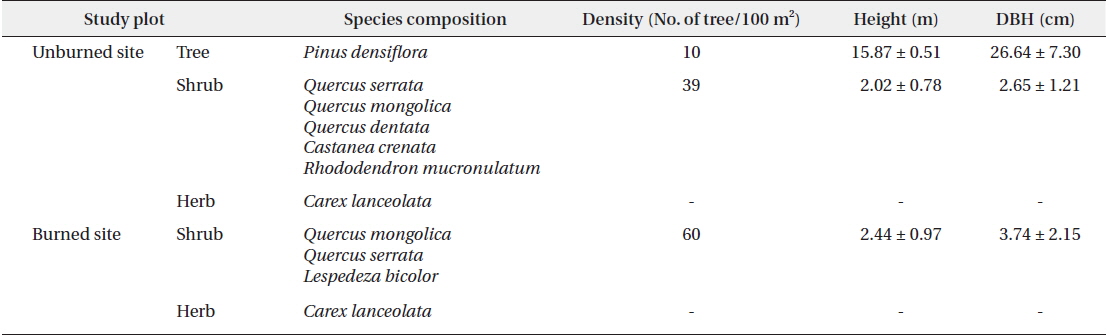
In both the unburned and burned study sites, the pine tree was the only dominate species (Table 1). The relatively low density of dominant pine trees in the unburned site had developed an overall structure of diverse layers within the forest. In the case of burned site, shrubs had mainly developed the architecture and distribution of understory vegetation. We assumed that the high density of shrubs of uniform height in the burned site was due to growth subsequent to the 2000 fire.
[Table 1.] Dominant vegetation in the unburned and burned study sites in 2012

Dominant vegetation in the unburned and burned study sites in 2012
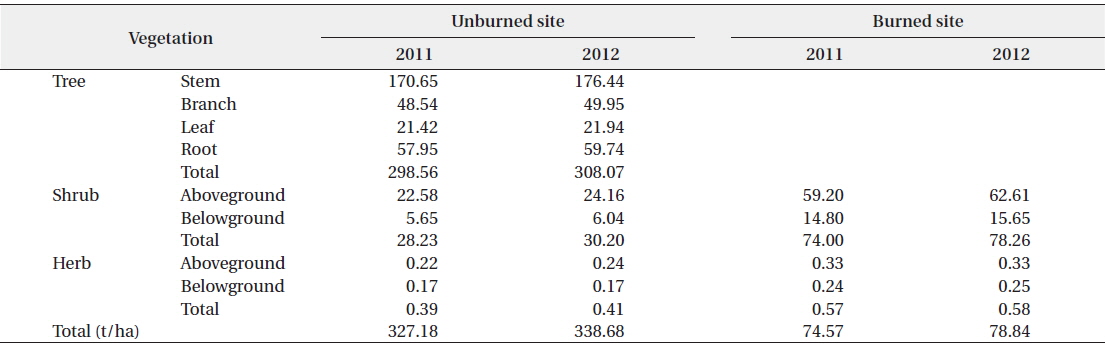
The standing biomasses of the separate tree, shrub, and herb layers in the unburned and burned sites are shown in Table 2. The total standing biomass of the unburned site in 2011 and 2012 was 327.18 t/ha and 338.68 t/ha (1 t = 103 kg), respectively. In the same period, the total standing biomass of the burned site was 74.57 t/ha and 78.84 t/ha, respectively. In our study, the amount of standing biomass in the unburned
[Table 2.] Above- and below-ground biomasses in the unburned and burned study sites in 2011 and 2012

Above- and below-ground biomasses in the unburned and burned study sites in 2011 and 2012
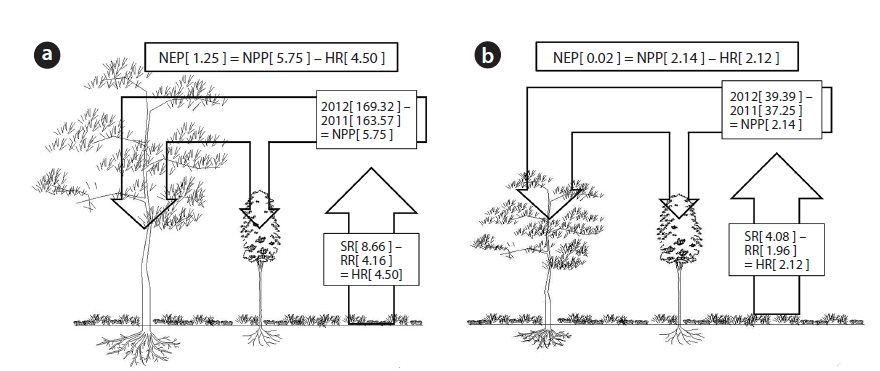
The net primary production (NPP) in the unburned and burned study sites in 2012 is shown in Table 3. NPP in the unburned site was 11.50 t ha-1 yr-1 while NPP in the burned site was 4.27 t ha-1 yr-1. The NPP in the unburned
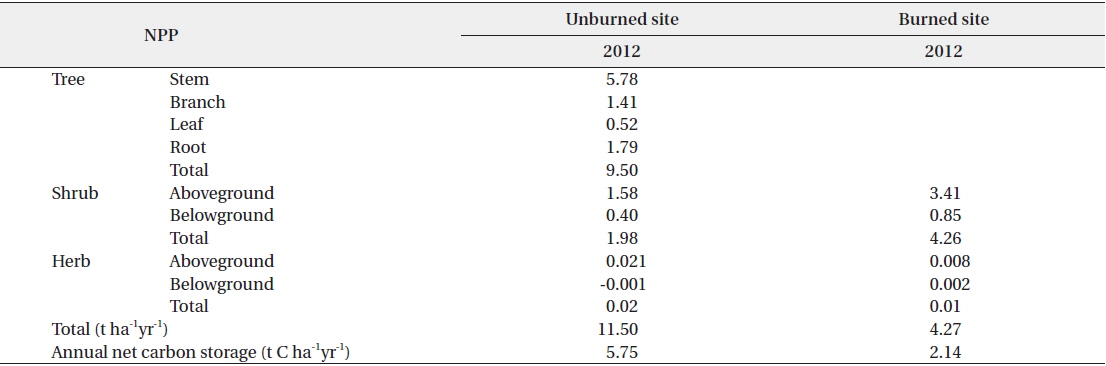
The net primary production (NPP) and annual net carbon storage in the burned and unburned study sites in 2012
>
Characteristics of soil respiration
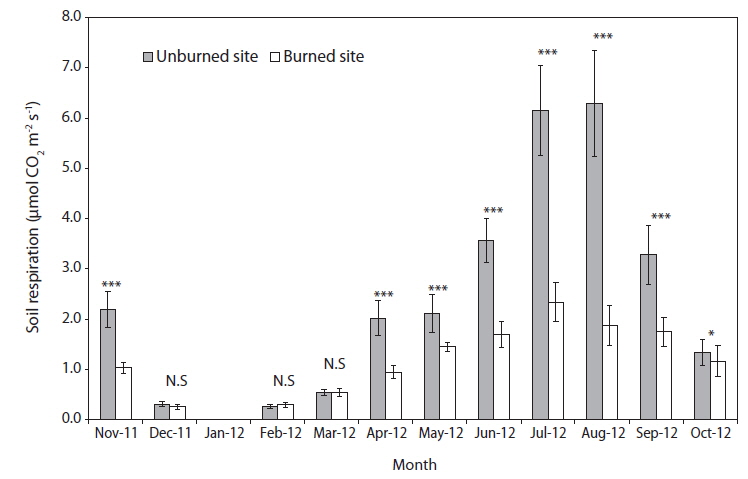
Seasonal variations of soil respiration rates in the unburned and burned study sites are shown in Fig. 2. During the entire experiment period from November 2011 to October 2012, the monthly mean soil respiration rate was 2.74 ± 0.49 μmol CO2 m-2 s-1 in the unburned site and 1.37 ± 0.26 μmol CO2 m-2 s-1 in the burned site. In the peak summer season (July and August), the soil respiration rates in the unburned study site was more than three times than that of a maximum value in the burned study site. However, in in the winter season (December–February) and early spring (March) with the relatively low rates of soil respiration for one year, there were no significant differences between the unburned and burned study sites (Fig. 2). The plant root growth and the metabolic activities of heterotrophic soil microorganisms were most similar between the 2 plant communities during the winter period. Although the activity of heterotrophic soil microorganisms in the burned study site were at a maximum during the summer season, their soil respiration rates were always lower than those in the unburned study site.
>
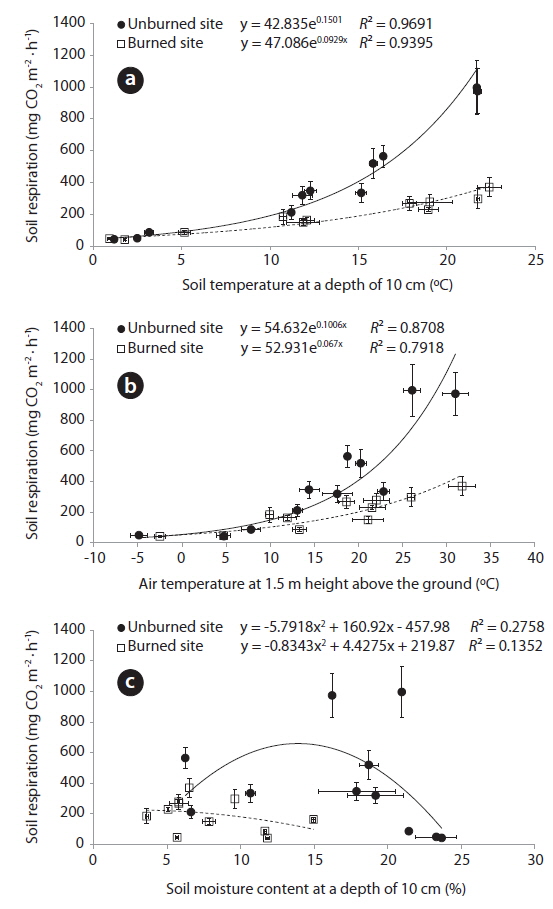
Correlation between the soil respiration rates and environmental factors
Relationships between the environmental factors (air and soil temperatures, and soil moisture content) and the soil respiration rates was analyzed by fitting exponential and second-order polynomial functions to the data are shown in Fig. 3. The soil respiration rates in the unburned (
>
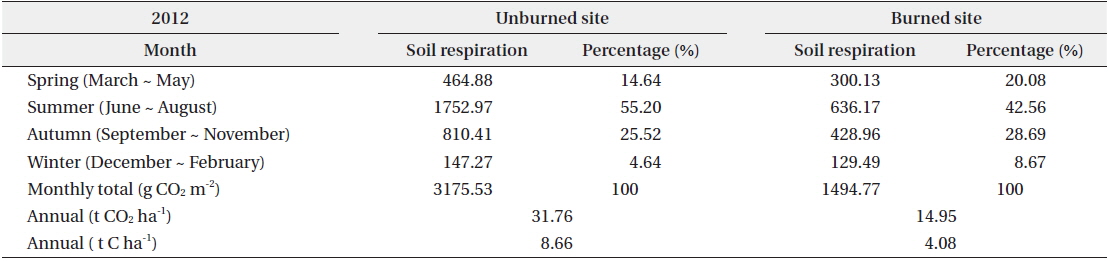
Total annual soil respiration
The annual soil respiration in the unburned and burned study sites was 31.76 and 14.95 t CO2 ha-1 yr-1, respectively (Table 4). The annual soil respiration rate in the unburned study site was two times higher than that in the burned site. In our study, the annual soil respiration in the unburned
[Table 4.] Seasonal and annual soil respiration rates in the unburned and burned study sites

Seasonal and annual soil respiration rates in the unburned and burned study sites
The annual NPP in the unburned and burned
>
Recovery period for the forest fire
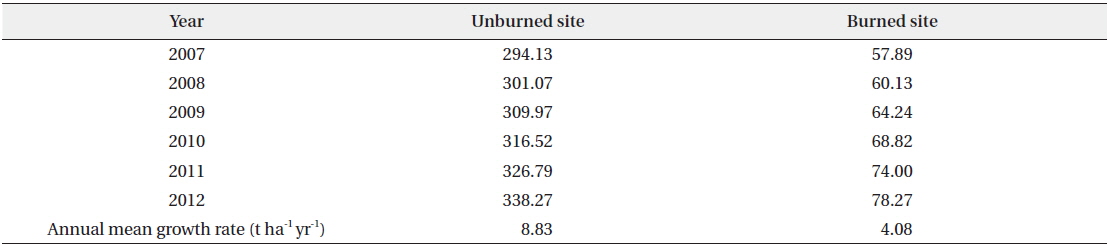
In the unburned and the burned study sites, the annual total standing biomass of vegetation except for the herb layer during the survey period of six years from 2007 to 2012 is shown in Table 5. Annual mean growth rates were documented as 8.83 t ha-1 yr-1 in the unburned site and 4.08 t ha-1 yr-1 in the burned site (Fig. 4). The estimated annual total standing biomass in the burned site prior to the forest fire by applying the annual mean growth rate in the unburned site was about 232.3 t ha-1 yr-1. It was assumed to need about 38 years until the burned study site become to the standing biomass in the

Annual total standing biomasses (t/ha) in the unburned and burned study sites during the survey period of 6 years from 2007 to 2012
This study was conducted in the unburned