Among the non-mulberry (vanya) silkworms, eri silkworm, [
Muga silkworm [
Microsporidia are a diverse group of obligate intracellular eukaryotic parasites with 1300 described species in 160 genera approximately (Wittner and Weiss 1999, Keeling 2009). Microsporidia are distinctive eukaryotes, which do not have centrioles and mitochondrial apparatus, although, nuclei are present in distinct number (Vossbrinck and Woese 1986, Vossbrinck
Classification of microsporidians based on ultrastructural differences have been replaced by molecular phylogenetic analysis based on DNA marker profiles (Baker
ISSR primers that amplify regions between SSRs (referred as inter simple sequence repeats or ISSRs) are very useful for detecting genetic polymorphisms in microsatellite and intermicrosatellite loci and have been found to be a novel technique for fingerprinting and thus differentiating, closely related individuals (Zietkiewicz
In Random Amplified Polymorphic DNA-PCR assay a set of primers of arbitrary nucleotide sequences been used (Welsh and McClelland 1990, Williams
So far, no research works are reported on the molecular characterization of microsporidian isolates infecting the Indian muga (
>
Origin of microsporidian spores and purification
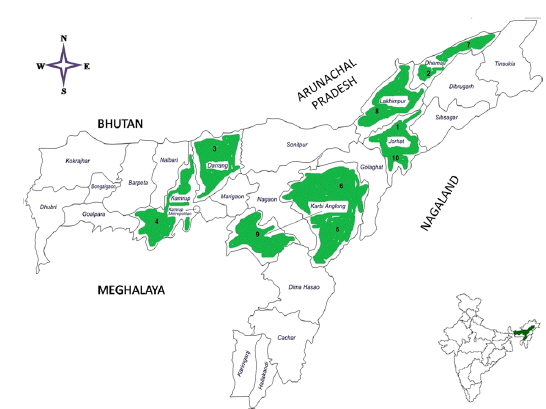
Ten microsporidians were originally collected from the diseased individual
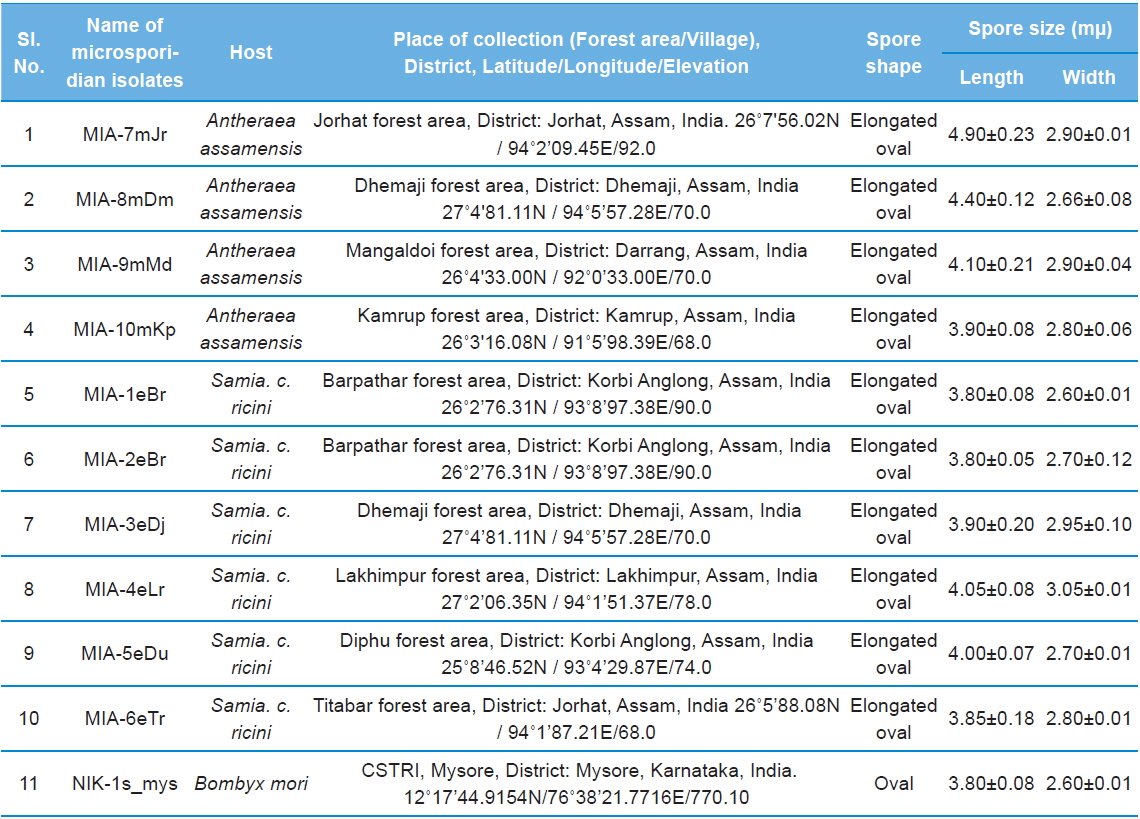
Details of ten microsporidian isolates and type species: their place of collection, host and morphology
>
Measurement of spore length and width
The morphology of purified microsporidian spores was observed using phase contrast microscope. The length and width of microsporidian spores were measured according to the method of Undeen and Vavra (1997). The fresh mature spores were spread in water agar on glass micro-slides and measured using an ocular micrometer under phase contrast microscope and all the measurements are presented in micrometers as mean values of 12 individual observations (Table 1).
>
DNA extraction and purification
Genomic DNA was extracted from the sporoplasms discharged from spores using the glass bead method (Undeen and Cockburn 1989). DNA concentration and quality was determined by spectrophotometry at 260 and 280 nm and on 0.8% agarose gel visualization, using a known quantity of λDNA (10 ng/μL) as a standard before use in subsequent PCRs. The possibility of host DNA contamination was checked using insect mitochondrial primers.
>
PCR amplification of the DNA with ISSR primers
The protocol of Zietkiewicz

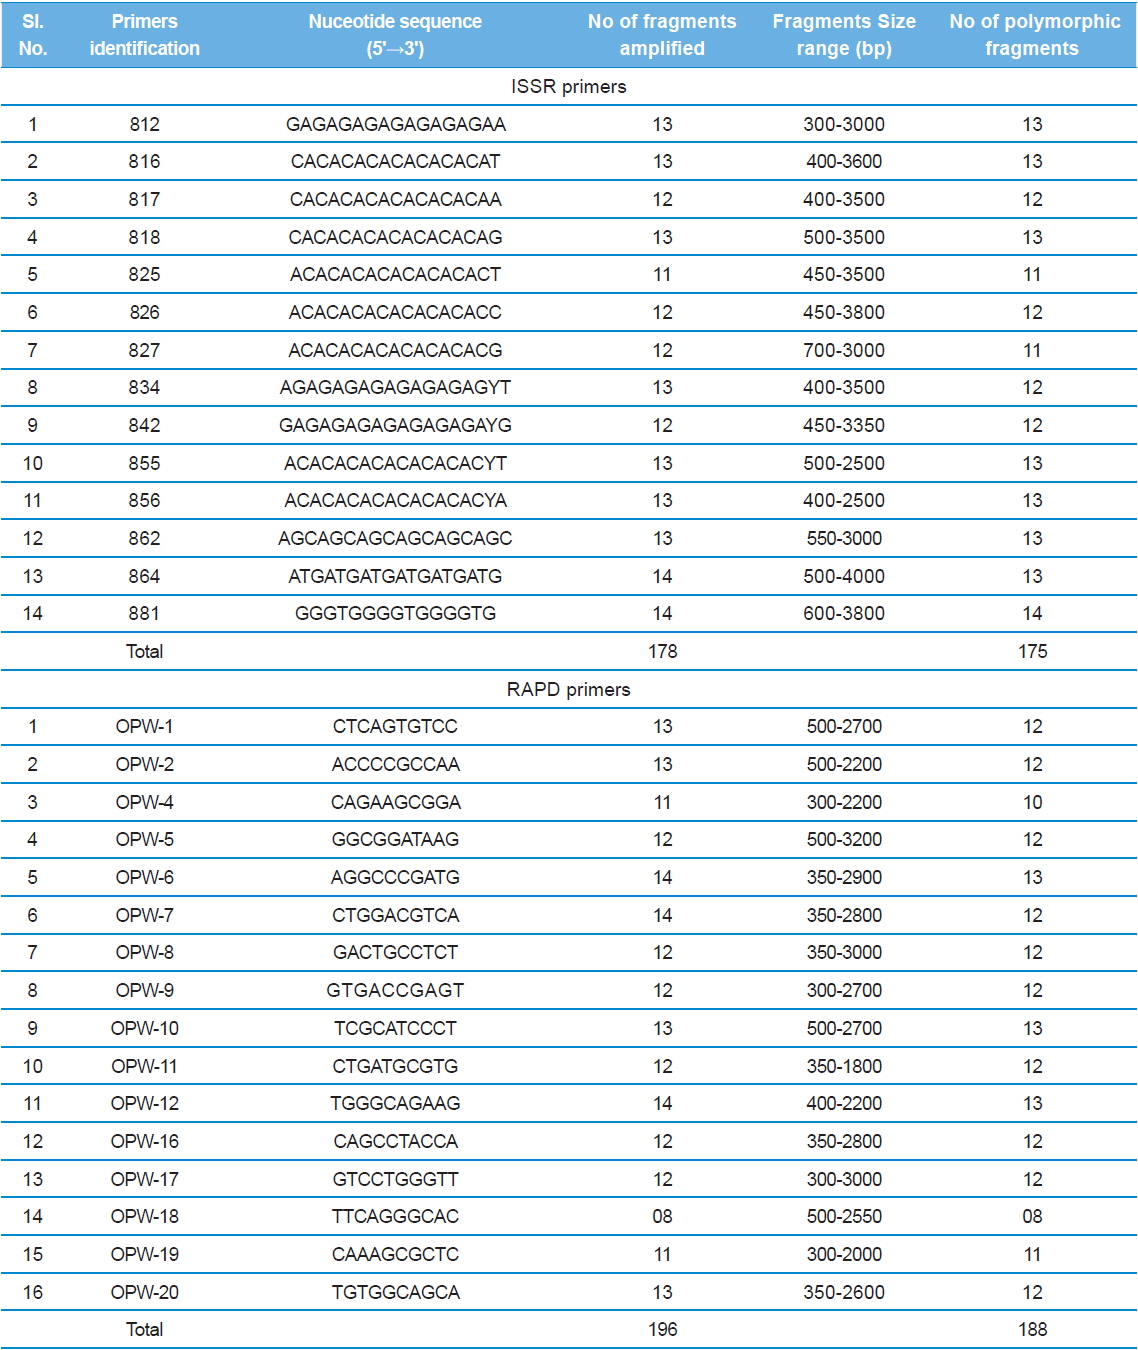
The nucleotide sequences of the primers, number of amplified fragments, fragment size, and number of polymorphic fragments scored using ISSR and RAPD profiles of eleven microsporidians DNA in PCR.
>
PCR amplification of the DNA with RAPD primers
RAPD-PCR reactions were performed according to the protocols of Welsh and McClelland (1990) and Williams
Analysis of the patterns was based on the presence or absence of unambiguously reproducible amplified bands and their size. ISSR and RAPD markers were scored according to the presence (1) or absence (0) of a band across ten isolates of microsporidians; each primer was scored separately. The banding scoring were repeated three times and only the reproducible conspicuous bands were included in the analysis. The total number of fragments amplified, the number of polymorphic fragments scored and the percentage of polymorphic bands were documented. The NTSYS-pc version 2.11T computer program (Applied Biostatistics, Setauket, NY) was used for genetic distance analysis. The ISSR and RAPD data were analyzed using SIMQUAL (similarity for qualitative data) method to generate genetic distance values among different microsporidian isolates using Dice coefficients (Dice, 1945) (
The different microsporidian isolates identified from diseased
>
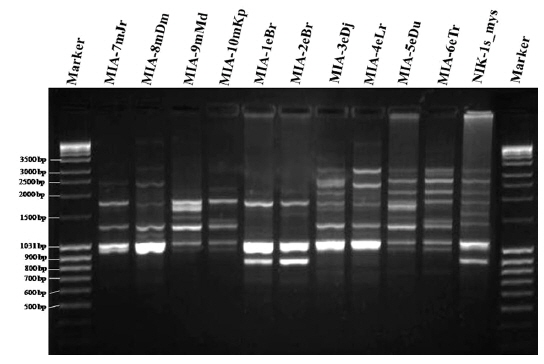
Genetic variability revealed by the ISSR markers
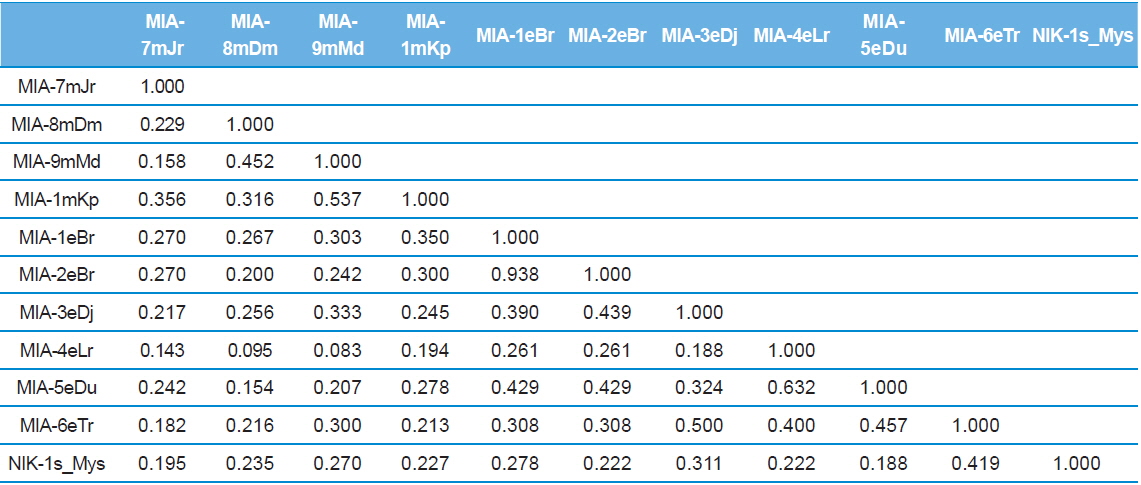
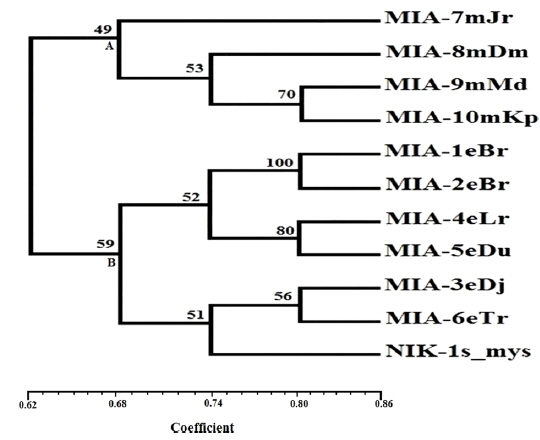
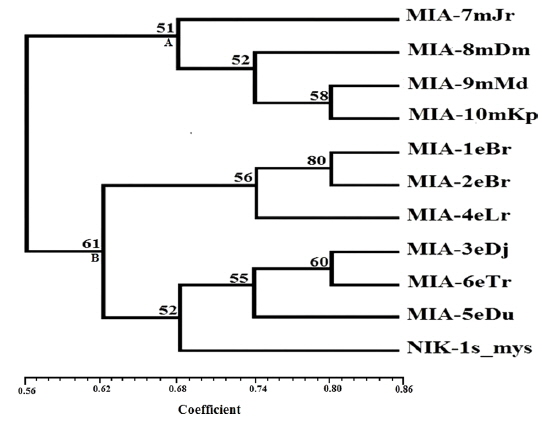
Genomic DNA from 11 different microsporidian isolates were used to generate ISSR-PCR amplification patterns. Twenty ISSR primers were tested for PCR amplification with all 10 newly identified microsporidian isolates along with a type species. Out of 20 primers, fourteen primers produced good amplification products. They were used for ISSR markers analysis. A majority of 11 primers annealed to dinucleotide repeats, 2 annealed to tri- and 1 to penta nucleotide repeats. Very high degree of polymorphism was detected with all 14 ISSR primers. Total 178 fragments were scored from the fourteen ISSR primers. Out of 178 fragments, 175 (98%) were polymorphic (Table 2). The ISSR-PCR amplified fragments profile generated with ISSR-827 primer shown in Fig. 2A clearly shows the extent of polymorphism among the different microsporidian isolates. The total number of ISSR markers varied in different isolates with different primers. Some of the bands were common to all isolates and the rest were present only in specific isolates. Almost all 11 microsporidian isolates had different ISSR profiles. The size of the amplified fragments ranged from 700 to 3000 bp (Table 2). The ISSR-PCR fingerprinting patterns of 11 microsporidian isolates with various ISSR primers were used to calculate genetic distance values with Dice similarity coefficient method (Dice, 1945). The relationship among the 11 microsporidian isolates, as revealed by genetic similarity calculated from ISSR data, varied from 0.385 to 0.941 (Table 3A), suggesting significant variability among the microsporidians. The lowest value of Dice similarity coefficient (0.385) was found between the MIA- 6eTr and MIA-7mJr isolates. The highest similarity coefficient (0.941) was found between MIA-1eBr and MIA-2eBr (Table 3A). The genetic similarity values were used for constructing the dendrogram using the un-weighted pair group method with arithmetic averages (UPGMA) method (Fig. 3A). The obtained dendrogram grouped 11 microsporidian isolates in to two major (A and B) clusters. Cluster A included four isolates: MIA-7mJr, MIA-8mDm, MIA-9mMd, and MIA-10mKp, isolated from muga silkworm and collected from four district i.e., Jorhat, Dhemaji, Darang and Kamrup respectively. Cluster B, consisted seven isolates viz., MIA-1eBr, MIA-2eBr, MIA-3eDj, MIA-4eLr, MIA-5eDu, and MIA-6eTr isolated from eri silkworm and collected from Korbi Anglong, Lakhimpur, Jorhat, and Dhemaji and type species NIK-1s_mys.
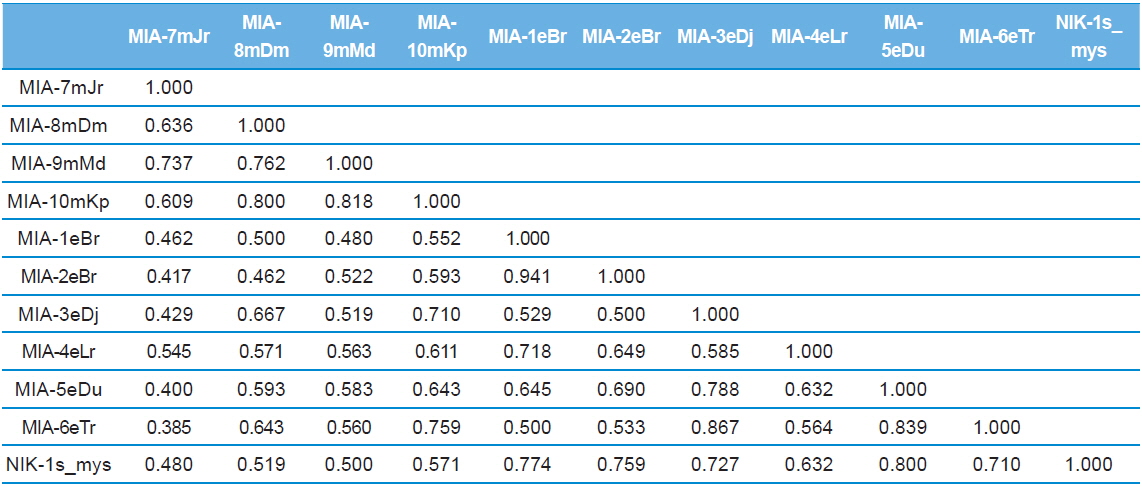
Dice genetic similarity distance matrix values based on ISSR data among eleven microsporidian isolates
>
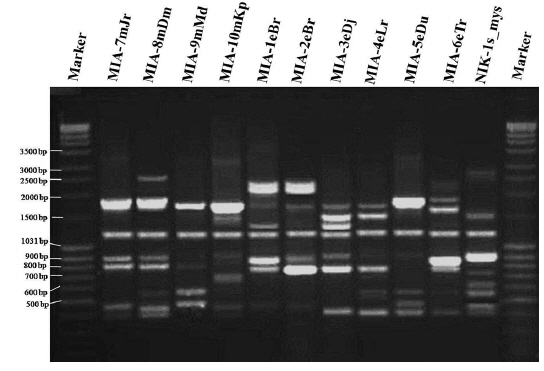
Genetic variability revealed by the RAPD markers
Twenty RAPD primers were screened for fingerprinting of the 10 newly identified microsporidian isolates along with type species out of which sixteen primers that yielded good amplification were utilized. The amplified products obtained with primer OPW-6 are depicted at Fig. 2B. The size of amplified products with different primers ranged from 350 to 2900 bp (Table 2). Total 196 RAPD fragments were generated with 16 primers of which 95% were polymorphic (Table 2). Values of genetic distance obtained from each pair wise comparison of RAPD fragments are shown at Table 3B. The relationship between 10 isolates and type species as revealed by genetic distance from dice similarity matrix RAPD data varied from 0.083 to 0.938 (Table 3B). The genetic distance similarity matrix was least (0.083) between MIA-6eTr and MIA-7mJr while it was highest (0.938) between MIA-1eBr and MIA-2eBr (Table 3B). UPGMA based dendrogram utilizing the genetic distance values of RAPD data is presented in Fig. 3B. The dendrogram indicated clustering of the different microsporidians into two groups (A and B). Group A contained four isolates i.e., MIA-7mJr, MIA-8mDm, MIA-9mMd, and MIA-10mKp. All isolates infect muga silkworm and collected from four different districts i.e., Jorhat, Dhemaji, Darang and Kamrup. The B group contained seven isolates viz., MIA-1eBr, MIA-2eBr, MIA-3eDj, MIA-4eLr, MIA-5eDu, and MIA-6eTr isolated from eri silkworm and collected from four different districts in Assam, India and type species NIK-1s_mys isolated from Mysore, Karnataka, India (Fig. 3B).

Dice genetic similarity distance matrix values based on RAPD data among eleven microsporidian isolates
>
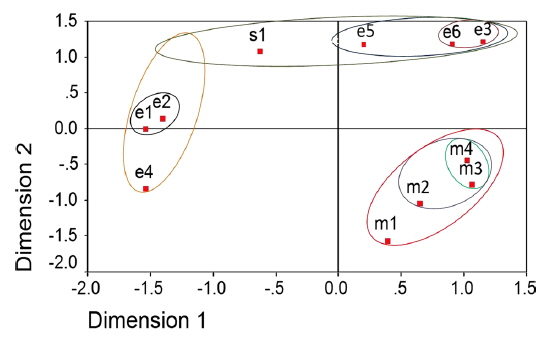
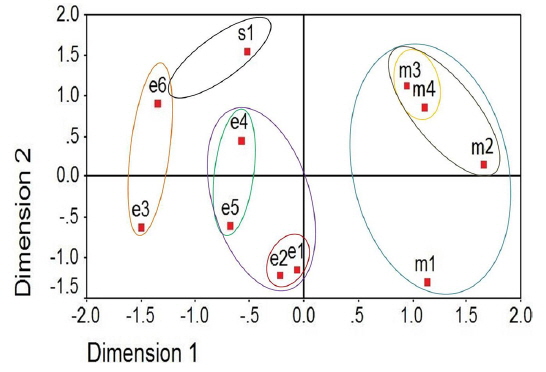
Two dimensional distribution of microsporidians as revealed by ALSCAL method
The two-dimensional scaling of the ISSR and RAPD data, using ALSCAL algorithm based on Euclidean distance matrix, has clearly delineated each of the newly identified microsporidian from the muga and eri silkworms as well as from the type species, NIK-1s_mys (Fig. 4A and 4B). Of the 10 microsporidian isolates, two eri microsporidians MIA-5eDu and MIA-6eTr are found to be little closer to NIK-1s_mys, indicating that eri microsoridians are slightly similar to the type species and the muga isolates which differed from type species, were considered to be different variants. The grouping of different microsporidians based on Euclidean distance matrix is very similar as like in the UPGMA based dendrogram (Fig. 4A and 4B).
The identified microsporidian isolates were characterized using spore morphology and PCR based ISSR and RAPD fingerprinting. The spore of type species, NIK-1s_mys is oval in shape and size measuring 3.80 (length), 2.60 (width) (Table 1). NIK-1s_mys is similar to the type species
The genomic DNA from ten microsporidian isolates was used to generate ISSR and RAPD-PCR amplification patterns. The constructed both dendrograms clearly revealed that clustering of 11 microsporidian isolates based on their host silkworm viz., four muga microsporidians [MIA-7mJr, MIA-8mDm, MIA-9mMd, and MIA-10mKp] separated in a separate group while six eri microsporidians [MIA-1eBr, MIA-2eBr, MIA-3eDj, MIA-4eLr, MIA-5eDu, and MIA-6eTr] were separated in other grouped along with a type species. This indicates all the eri microsporidians had close phylogenetic relationship with type species NIK-1s_mys. The dendrograms showed clear separation of all 10 novel microsporidian isolates from each other with a good bootstrap value. In order to distinguished the micirosporidian isolates from each other, further analysis of dendrograms suggest that two eri microsporidian isolates [MIA-5eDu and MIA-6eTr] look slightly similar with type species, NIK-1s_mys.
Even the multidimensional scaling of the ISSR and RAPD data, using the ALSCAL algorithm on Euclidean distance matrix has clearly separated the microsporidians from each other and type species, NIK-1s_mys (Fig. 4A and 4B). The multidimensional scaling method is one of the multivariate approaches of grouping based on the Euclidean distance matrix (Young
The ISSR fingerprinting results of Rao
ISSR and RAPD profiles in the present study clearly delineated the 10 microsporidian isolates with good bootstrap confidence values from type species, NIK-1s_mys and confirming the capability of ISSR and RAPD markers to discriminate the different microsporidian isolates (Fig. 3a, b). Rivera
The study inferred that the ten newly identified microsporidians from muga and eri silkworms differed in their spore morphology and the ISSR and RAPD PCR profiles indicating genetic variability among them. The high level of polymorphism realized from this study further proves the efficacy of ISSR and RAPD markers assay.