Plasma waves of various kinds exist within the Earth’s magnetosphere, playing a critical role in accelerating, scattering, and redistributing plasma particles. In particular, the inner magnetosphere that contains the radiation belts and the ring current is often full of plasma waves at various frequency ranges such as electron cyclotron waves, whistler mode waves, electromagnetic ion cyclotron waves, MHD waves. Some of these waves can strongly interact with or be generated by electrons and ions in a wide energy range. Indeed, wave-particle interaction is a key physics element in the inner magnetospheric dynamics. Thus, understanding the relevant waves is critical and has long been a subject of intense research in space physics.
Whistler chorus waves are usually identified outside the plasmasphere. These waves are believed to play a major role in accelerating electrons in the outer radiation belt (Horne & Thorne 2003, Shprits et al. 2009). The chorus waves can also act to scatter and precipitate electrons into the upper atmosphere (Horne & Thorne 2003, Lam et al. 2010). Other waves such as electromagnetic ion cyclotron waves and plasmaspheric hiss waves can also contribute to atmospheric loss of electrons (Summers & Ni 2007, Kim et al. 2011). The electrons can also be lost into the solar wind through magnetopause crossing under a stressed condition of the solar wind (Kim et al. 2008, 2010, Turner et al. 2012, Hwang et al. 2013). Therefore, the net flux observed by a satellite is determined by a delicate balance between the acceleration (source) and loss effects (Reeves et al. 2003).
In this paper, we focus on the whistler chorus waves. Chorus waves are usually observed in two frequency bands, the lower band at 0.1
Theories suggest that whistler chorus amplification (at least lower band chorus waves) can be excited by cyclotron resonant interaction with an anisotropic distribution of electrons in the energy of a few to tens of keV that are injected from the plasma sheet into the inner magnetosphere (e.g., Nunn 1974, Katoh & Omura 2007, Omura et al., 2008, Li et al. 2010). Testing this theory using observations is not trivial. It requires simultaneous in-situ measurements, at appropriate positions, of whistler waves and electron velocity distribution with accurate angular resolution from which one can calculate phase space density (PSD). Even if such observations are available, still a major difficulty in interpreting the data remains, which is hard to overcome due to the inherent fact that waves propagate after their generation and particles drift after their injection, each in a completely different way. Therefore, it is generally a rather heavy task to fully clarify the relation between wave generation and particle injection observationally. For this paper we attempt to perform only a simple test for or against the possible development of anisotropic PSD of electrons for a large number of chorus events identified by THEMIS spacecraft (Angelopoulos 2008). We largely confirm the suggested theory.
We first identify chorus events using the filter bank data of Search Coil Magnetometer (SCM) onboard the THEMIS satellites (Roux et al. 2008). Our method to identify chorus is basically the same as in the previous work by Li et al. (2010). Specifically, we use the data at top three frequency ranges (1390-4000 Hz, 320-904 Hz, 80-227 Hz) out of the six bands of the filter bank data (Cully et al. 2008). After checking individual events visually, we decided to exclude events with a level of 5 pT, 1.3 pT, 1.1 pT or less for the three frequency bands, respectively: These are slightly higher values than the known average noise levels (Golden et al. 2012) such that our selection of events is slightly more conservative. We assume that
The anisotropy in PSD,
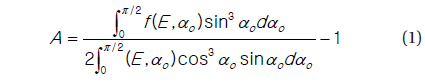
where αo is the equatorial pitch angle,
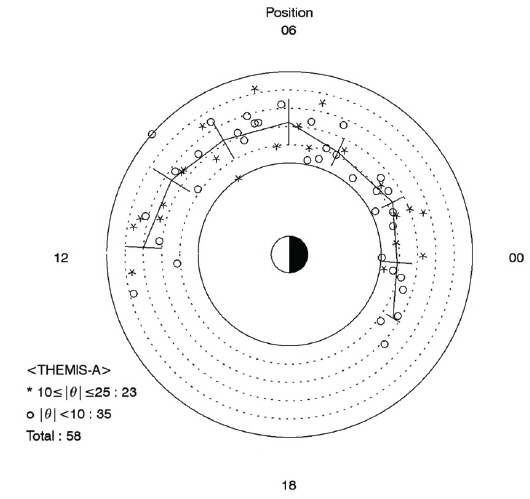
Based on the criteria of identification for chorus events above and given the availability of the THEMIS ESA and SST data, we identified a total of 73 events from THEMIS-A satellite in January 2010 through March 2014. Fig. 1 is the equatorial projection of the THEMIS A satellite positions for the 73 identified events. We deliberately avoided searching for events in the afternoon through dusk to early evening sector, 13-21 MLT, where chorus events of meaningful amplitude rarely occur. Other than this, the MLT distribution of the 73 events is not severely biased toward a particular MLT region. Though the error bars of the fit curve are rather large in Fig. 1, a modest trend is suggestive that the nightside events are slightly closer to the Earth than the dayside events: This feature of
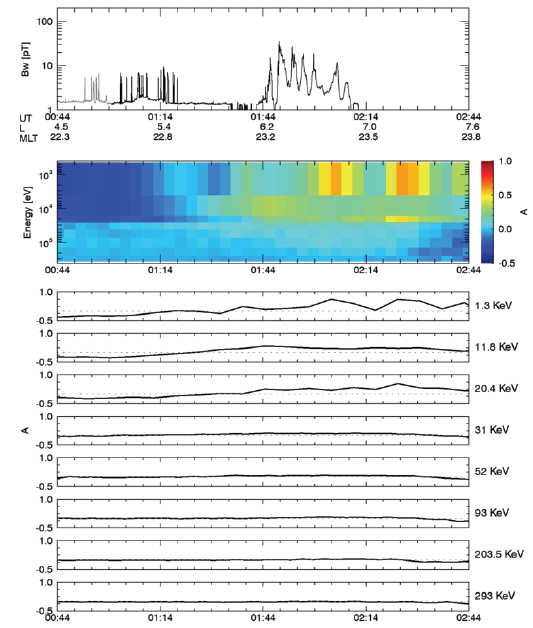
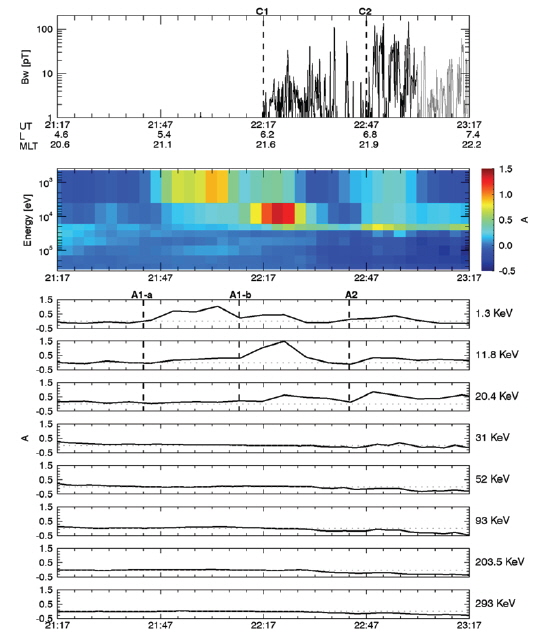
Fig. 2 shows an example event of chorus activation and associated anisotropy
Fig. 3 shows another example event of chorus activation and associated anisotropy
Statistically, after examining PSD for the 73 chorus events, we find that 58 events (~80%) are closely associated with a positive anisotropy
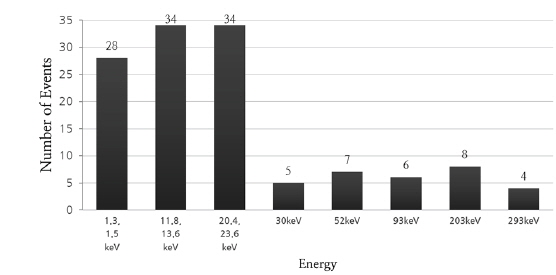
For the 58 events, Fig. 5 shows the number of the events showing an increasing positive
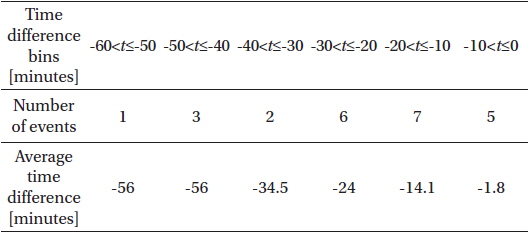
We identify 5 events for which the anisotropy increase occurs in three or more consecutive energy channels with a time delay in increase of
[Table 1.] Delay timesa in increase of A between the adjacent energies.
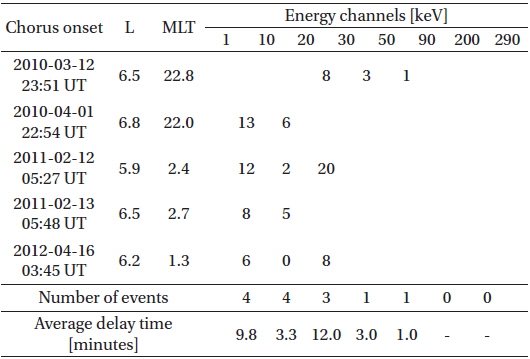
Delay timesa in increase of A between the adjacent energies.
Lastly, some previous works suggest that the chorus activation is associated with the substorm onsets which can inject source electrons from the plasma sheet (e.g., Smith et al. 1999). It is reasonable to consider the possibility that the injected electrons can eventually evolve into a PSD state with an enhanced positive anisotropy, resulting in chorus. We raise the following question whether and how many of our 58 events showing an enhanced positive anisotropy in PSD are well associated, in terms of timing, with substorm onsets. We examine this by checking substorm onsets for the 58 chorus onsets. We determine substorm onsets based on
[Table 2.] Statistics of AL onsets relative to chorus onsets for 24 events.

Statistics of AL onsets relative to chorus onsets for 24 events.
In this work, we examined possible connection of chorus onsets with anisotropy in electron phase space density. This work was based on a number of chorus events and corresponding electron data observed by a THEMIS satellite. Our main goal was to test the statistical significance of the previously suggested scenario that the chorus activation is due to anisotropic electron distribution in a few to tens of keV. Our statistical analysis indicated that this is indeed the case for a majority of the events studied here (~80%), showing positive and increased anisotropy mostly at 20 keV or below. The identified events are overall evenly distributed in MLT between 21 MLT through midnight to 13 MLT.
For some of the studied events, we found an interesting feature that when the increase of the anisotropy occurs at consecutive energy channels, it is earlier by several minutes on average at lower energies than at higher energies. Further study on this feature is worthwhile to pursue in order to understand the cause of this time difference between energies.
We also checked the temporal causality between our chorus events and preceding substorm onsets. We found a rather intermediate percentage rate, ~41 %, for the temporal association of the chorus onsets with preceding substorm onsets. This number may be underestimated. It is because, to check substorm onset, we only looked at the time window of -60 min to 0 min relative to chorus onset, and this may not be sufficient for low energy electrons drifting very slowly around the Earth. Use of a longer time window may be necessary, but then one may begin to feel less confident about the causality between the chorus onset under consideration and a rather remotely identified substorm onset. Despite the limitation of the present analysis, we suspect that substorm injections are only part of the source particles for exciting chorus waves and that other contribution is made by convection from the plasma sheet. Indeed, Lyons et al. (2005) and Hwang et al. (2007) reported periods of enhanced convection when chorus waves were excited. It is well known that convection brings in particles of mainly ~keV or less energy while substorms can inject more energetic particles typically a few tens of keV or higher. Therefore, both should contribute to chorus excitation only at different but partly overlapped energy ranges. In conclusion, we think that positive anisotropy in electron PSD, when increased to a certain level, is the critical factor that determines chorus onsets, no matter what drives the anisotropy by either substorm-injected electrons or convection-driven electrons.
Our work is limited by not distinguishing between the lower and upper band chorus and not seriously examining MLT and latitudinal dependence of anisotropy. Detailed work on these aspects is worthwhile, which we plan to do in near future.