Karenia brevis red tides occur throughout the Gulf of Mexico and can be transported cross-shelf or along shore by currents and winds. K. brevis blooms almost annually along the West Florida shelf and occasionally along the Texas coastline (Heil et al. 2014). The Gulf Stream has transported K. brevis red tides as far north as North Carolina (Tester et al. 1991). The Gulf of Mexico’s Loop Current can create eddies that shed and move westward towards the Texan and Mexican coasts (Paluszkiewicz et al. 1983). According to Tester and Steidinger (1997), the Florida west coast is the epi-center of K. brevis red tides, however, since the 1940s red tide has also been recorded along Florida’s Keys, panhandle, and east coast.
Davis (1948) described K. brevis, as Gymnodinium brevis, from a 1946-1947 red tide along the west coast of Florida that was noted for respiratory irritation, extensive fish kills and other marine animal mortalities. In 1946, respiratory irritation and fish kills were reported at Jacksonville, suggesting that K. brevis red tides could occur on Florida’s east coast. However, it wasn’t until 1972 that the transport of K. brevis from the Florida west to east coasts via the Gulf Stream System was properly documented when a red tide came inshore at St. Lucie and Martin counties. Typical signs of red tide, including respiratory irritation and fish kills, were reported and water samples confirmed the presence of K. brevis (Murphy et al. 1975). Roberts (1979) reported a similar red tide in 1977. In 1983, a Gulf Stream meander inoculated inshore areas near Jacksonville (Duval County) at the beginning of October. Over a 10-day period, the red tide moved south towards Cape Canaveral (Brevard County) and by the end of the month, the red tide had reached Sebastian Inlet (north Indian River County). Fish kills, discolored water, respiratory irritation and closures of shellfish harvesting areas (SHAs) were documented in this area through November (Tester and Steidinger 1997). Transport of K. brevis from the west Florida coast to the east Florida coast via the Gulf Stream Current System has since been documented in 1990, 1997, and 1999. In each of these cases the blooms lasted about one month before dissipating.
The Florida Fish and Wildlife Conservation Commission (FWC) and the Florida Department of Agriculture and Consumer Services (FDACS) have been jointly monitoring Florida’s waters for K. brevis since the 1980s. Extensive efforts have been put forth to monitor and conduct large-scale research projects (i.e., Ecology and Oceanography of Harmful Algal Blooms [ECOHAB]: Karenia) on K. brevis by FWC and partners since the 1990s, and in 2000 FWC established a Volunteer Red Tide Offshore Monitoring Program to further expand the spatial and temporal collection of data (Steidinger 1993, Haverkamp et al. 2004, Heil et al. 2014). Since 2002, routine monitoring by FWC and FDACS along Florida’s east coast have focused on the saxitoxin-producing dinoflagellate Pyrodinium bahamense (Landsberg et al. 2006, Phlips et al. 2011). Increased observations resulting from this FWC-FDCAS partnership and the expansion of FWC’s volunteer monitoring program to Florida’s east coast have not shown an increase in the frequency or duration of K. brevis blooms in this area. However, between September 2007 and January 2008, K. brevis, as well as four other Karenia spp., were found along approximately 400 km of coastal and Intracoastal waters from Jacksonville to Jupiter Inlet. This event represents the longest and most extensive K. brevis red tide documented on the east coast of Florida and the first time a multi-species Karenia bloom has been reported for this area.
K. brevis produces the neurotoxin brevetoxin, which is responsible for causing serious human health effects and animal illness and mortalities. When K. brevis is present in SHAs, brevetoxins can accumulate in the shellfish tissues and can cause NSP when consumed (Steidinger 1993). In humans, NSP is characterized by nausea, diarrhea, headaches, muscle aches, dizziness, and reversal of hot-cold temperature sensation with onset of symptoms within a few hours of eating contaminated shellfish (Steidinger and Baden 1984). To date, there have been no human fatalities due to NSP; however, illness has been documented in people who have consumed unregulated or illegally harvested shellfish species (Kirkpatrick et al. 2004).
The goal of the FDACS Division of Aquaculture is to provide maximum utilization of resources and reduce the risk of shellfish-borne illnesses (Heil 2009). To achieve this goal FDACS works with the FWC to follow the National Shellfish Sanitation Program Model Ordinance’s Marine Biotoxin Monitoring for NSP. This plan calls for FDACS to maintain an early warning system by collecting water monthly from sentinel sites within SHAs for the analysis of K. brevis cell concentrations by FWC year round. If a K. brevis bloom is detected, FDACS changes their sampling strategy by increasing the number of sites collected within impacted SHAs on a weekly basis to determine the severity and extent of the bloom within SHAs. The detection of K. brevis in a concentration greater than 5 × 10³ cells L−1 requires weekly monitoring until the cell concentration has dropped to below the 5 × 10³ cells L−1 threshold. When cell concentrations fall below 5 × 10³ cells L−1 FDACS collects shellfish for brevetoxin testing by FWC. Shellfish are collected and tested weekly using the mouse bioassay (MBA) until brevetoxin detection levels fall below the regulatory limit of 20 mouse units. At all times the threat of human illness is minimized through the use of FDACS’ website where SHA Information and Daily Status notices are posted at http://shellfish.floridaaquaculture.com/ seas/seas_statusmap.htm. This information is also linked through FWC’s Red Tide Status page at http://www.myfwc.com/research/redtide/statewide/. These websites are updated at a minimum of 2 times per week. In addition to these two websites, FDACS relays information regarding the status of SHAs directly to the members of the shellfish industry via phone calls and emails.
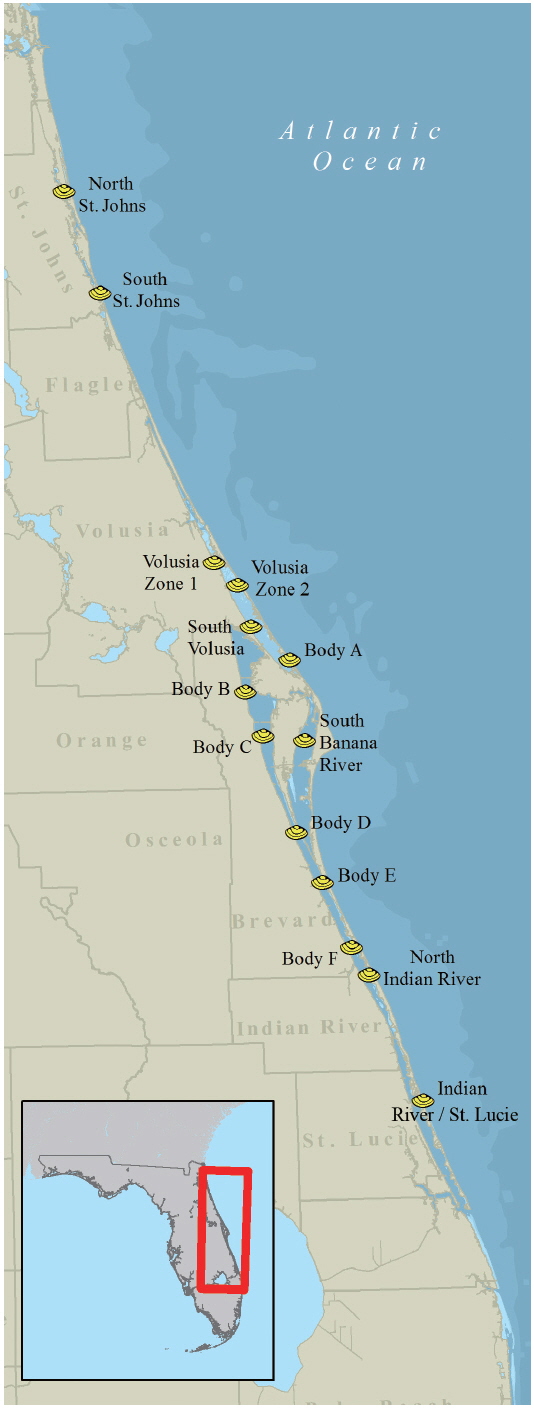
On September 21, 2007, multi-species fish kills and respiratory irritation from Jacksonville area beaches were reported to FWC via the FWC Fish Kill Hotline, a service that allows citizens and other agencies to notify FWC about fish and animal mortality events and other unusual occurrences that pertain to wildlife. Water samples collected on September 25 from Fernandina Beach and Amelia Island (Nassau County, FL, USA) confirmed a bloom of Karenia brevis. Subsequently, the FWC Marine Mammal Group observed discolored water along 65 km of coastline from Mayport to St. Augustine Beach on September 28 while conducting a routine right whale survey. The confirmation of a K. brevis bloom in the northernmost east coast counties initiated weekly sampling in SHAs (Fig. 1) by FDACS staff. Weekly sampling for water, shellfish and water quality parameters by FDACS occurred between September 25, 2007 and January 15, 2008. Additional samples were collected by FWC staff as part of existing research projects and by FWC volunteers opportunistically. Between September 2007 and January 2008, FDACS and FWC staff and volunteers collected 800 water samples over a 400 km area throughout 10 eastern Florida counties for the analysis of K. brevis cell concentrations. Water samples were collected as surface water grabs from a depth of 0.5 m. Live water samples were placed in 125-mL clear bottles (Nalgene #2007-0004; Thermo Scientific, Waltham, MA, USA), wrapped in wet newspaper and shipped at ambient temperature via overnight delivery to FWC. Live water samples were examined within 24 hours of collection. Fixed water samples were placed in 125-mL amber bottles (Nalgene #2009-0004; Thermo Scientific) containing 1-mL of Lugol’s iodine fixative and shipped to FWC where they were examined upon receipt.
Karenia spp. were morphologically identified by screening the live material and then enumerated from Lugol’s iodine preserved aliquots. Samples were mixed by inversion and 3 mL were placed in a Lab-Tek Chamber Slide (Nalge Nunc #155379; Thermo Fischer Scientific, Rochester, NY, USA). All samples were allowed to settle for at least 1 hour prior to examination. Karenia spp. were identified and enumerated at 100× and 400× magnification using inverted microscopes. Identifications of Karenia spp. were based on Haywood et al. (2004) and Steidinger et al. (2008).
When microscopy analyses indicated that K. brevis cell concentrations were below 5 × 10³ cells L−1 in impacted SHAs, clams (Mercenaria sp.) or oysters (Crassostrea virginica) were collected weekly by FDACS and tested by FWC for NSP toxicity using MBA following the guidelines of the American Public Health Association (1970). For MBAs, a minimum of 12 shellfish were shucked to obtain a 100 g meat sample for testing. Each meat sample was tested using a five-mouse set. Mice used were Swiss-Webster out-bred male mice, weighing 19 to 23 g, obtained from a regulated stock colony (Charles River, Wilmington, MA, USA). Mice were allowed to acclimate and rehydrate for at least 24 hours following shipping before being used in a MBA.
The data was visualized in ArcGIS v.10.2.1 both as site specific, ground-truthed data points and interpolated as a surface model using kernel density estimation (KDE). The site specific data, given as geographic coordinates, was analyzed using a temporal data tool to show the event’s development over time and the geographic trajectory. This analysis allowed for the understanding of when the event became established and moved to the Intracoastal Waterway. To show the geographic extent of the bloom a surface model was created using point data (as recommended by Wang and Wu 2009) in the ArcGIS KDE function. The default bandwidth (point expansion radius) was selected so that calculations were based on spatial configuration and number data inputs and spatial outliers were autocorrected. Following the methods proposed by Xie and Yan (2008) in which cell per liter concentrations were converted to density using a Quartic curve, the K. brevis bloom was mapped using a standard planar KDE with a 5 km2 radius from each data point and cell output size of 50 m.
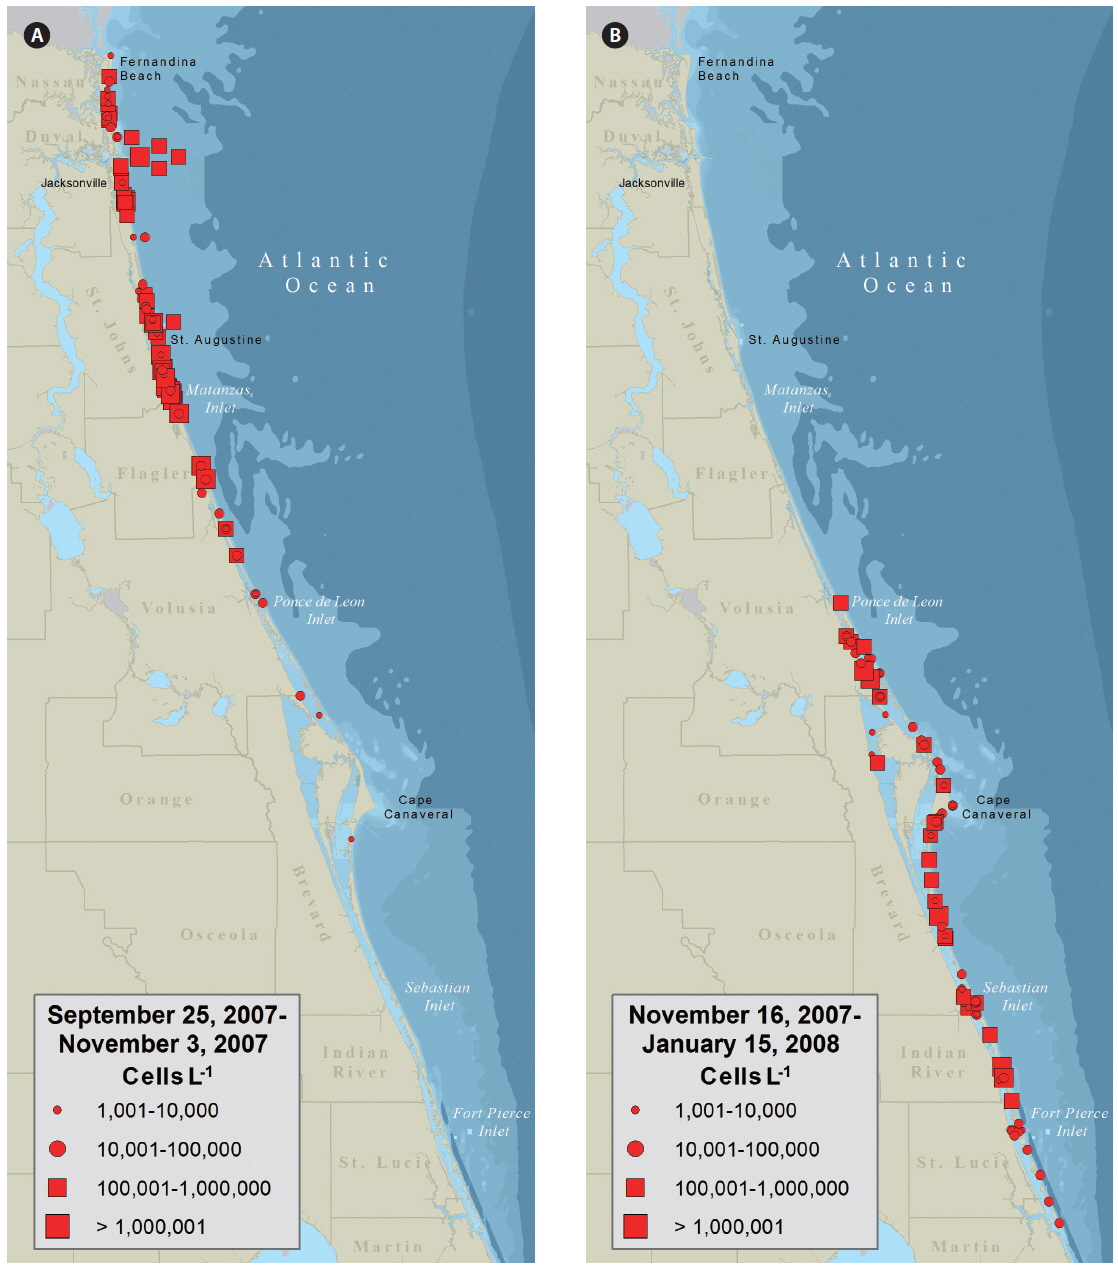
Water samples collected on September 25 from Fernandina Beach and Amelia Island (Nassau County, FL, USA) indicated a bloom of K. brevis up to 3 × 10⁵ cells L−1. By October 3, K. brevis was detected along the coastlines of the five northeast counties of Florida and within the Intracoastal Waterways of St. Johns County (Fig. 2A) closing the SHAs located here. On October 16, K. brevis cell concentrations peaked at 6 × 10⁶ cells L−1 in the Intracoastal Waterway of St. Johns County. During November the bloom persisted alongshore and in the Intracoastal Waterway of Volusia County. In late November the bloom was situated in the coastal and Intracoastal areas south of Cape Canaveral (Fig. 2B). By December 3, four of the seven SHAs in Brevard County were closed. On December 9, K. brevis was detected in the Intracoastal Waterways of Indian River and St. Lucie counties and SHAs were closed. On December 27, K. brevis was detected along the coast of Martin County. Throughout this bloom water temperatures ranged from 12.2-29.2℃ in the Intracoastal Waterway and 20.0-29.1℃ in the coastal waters; salinity ranged from 19.6-37.6 in the Intracoastal Waterway and 27.1-37.0 in the coastal waters.
While monitoring for K. brevis during the 2007-2008 red tide event, four other species of Karenia were detected. Concentrations of Karenia papilionacea, K. mikimotoi, K. selliformis, and Karenia sp. #3 [described in Steidinger et al. (2008) as morphologically similar to K. umbella] were at very low levels (0.3−7 × 10³ cells L−1) and always co-occurred with K. brevis.
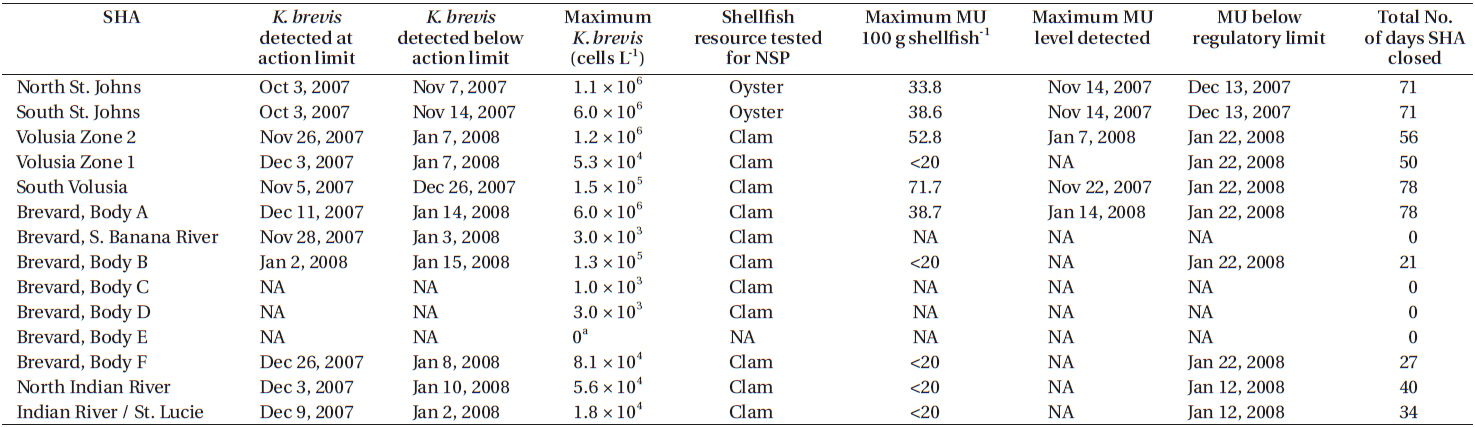
When K. brevis cell concentrations dropped below the regulatory limit of 5 × 10³ cells L−1 MBAs were conducted on shellfish (oysters, clams, or both, depending on the SHA) collected weekly from impacted SHAs. When MBA results indicated NSP concentrations were below the regulatory action limit of <20 mouse units 100 g shellfish FDACS−1 reopened SHAs to commercial and recreational harvesting. Based on MBA results, SHAs in St. Johns County were reopened on December 13. SHAs in Indian River County were reopened on January 12, 2008 and on January 25 in Brevard, St. Lucie, and Volusia counties. Ten SHAs on the east coast of Florida were closed for an average of 53 days due to this K. brevis red tide (Table 1).
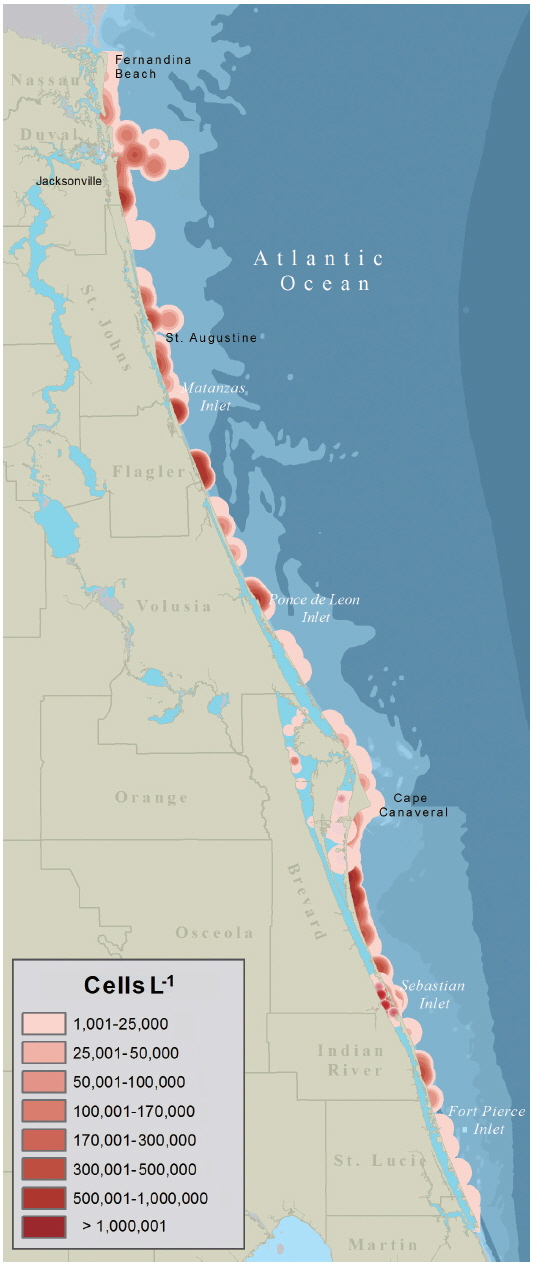
The data presented in Fig. 2 were used by resources managers and posted to FWC’s Red Tide Current Status webpage. The data presented as a KDE map (Fig. 3) provides a more probable image of what Florida’s east coast looked like during the red tide. Given the limited distribution of samples within any one map quadrate a conservative estimate of 5 km2 was used to expand the density radius of each data point.
K. brevis red tides on the east coast of Florida are not uncommon but they are not the nearly annual events that they are on the West Florida shelf. The four month long 2007-2008 event represents the longest east coast K. brevis red tide recorded to date and affected approximately 400 km of coastline. Using a Regional Oceanographic Modeling System (ROMS) and Hybrid Coordinate Ocean Model (HYCOM) derived circulation model for surface drifters and diagnostic color and backscatter algorithms for satellite imagery (both calibrated for Karenia on the West Florida shelf). Walsh et al. (2009) showed that the 2007-2008 east coast red tide was transported to the Jacksonville area via the Loop Current and the Gulf Stream from a K. brevis population detected offshore of Fort Myers, Florida. Winds and currents moved the bloom from coastal waters of Jacksonville southwards into the Intracoastal waterways. During this event, 10 SHAs on Florida’s east coast were closed for an average of 53 days. The duration of this event across 14 different SHAs allowed for a thorough testing of the National Shellfish Sanitation Program Model Ordinance’s Marine Biotoxin Monitoring for NSP by FDACS and FWC.
Notification of a potential K. brevis bloom / NSP event was received by FWC on September 21, 2007 via the FWC Fish Kill Hotline. Opportunistic aerial surveys conducted by the FWC Marine Mammal Group during the last week of September 2007 allowed for first hand observation of the discolored water in the Jacksonville area. This information was passed along to FDACS staff to initiate an increase in the frequency and geographical distribution of sampling within SHAs and to FWC staff and volunteers to provide ancillary samples and data.
Within one week of the initial sampling confirming the presence of K. brevis, FDACS and FWC had determined that the K. brevis was present along the coastlines and Intracoastal waterways of the five northern-most east Florida counties. The severity of the K. brevis bloom (Fig. 3) was sufficient enough to warrant the closing of commercial and recreational SHAs to prevent human illness from NSP as brevetoxins are rapidly accumulated by oysters (Crassostrea virginica) and clams (Mercenaria sp.) through ingestion of K. brevis cells and through exposure to brevetoxin in the water column (Plakas et al. 2008, Griffith et al. 2013). From September 25, 2007 to January 25, 2008, SHAs were monitored weekly for K. brevis cell concentrations from water samples. Once K. brevis cell concentrations dropped below 5 × 10³ cells L−1, MBAs were performed on the meats of clams and oysters to test for the presence or absence of brevetoxin. After brevetoxin levels in tested shellfish dropped below the regulatory action limits of 20 mouse unit 100 g SHAs−1 were reopened.
Plakas et al. (2008) reported that oysters could take up to two weeks after the dissipation of a K. brevis bloom to depurate enough brevetoxin so that is was not detectable using MBA. However, brevetoxin metabolite products can be detected in oysters for 2-8 months after bloom dissipation using in vitro assays or instrumental methods (Plakas et al. 2004). Griffith et al. (2013) reported similar findings for the clam Mercenaria mercenaria but their experimental method did not allow for a differentiation between the brevetoxin parent congeners and metabolite products. During the 2007-2008 bloom event it took an average of 8 days for clams to depurate brevetoxin and for SHAs to be reopened after K. brevis cell concentrations dropped below regulatory levels. Alternatively, it took an average of 30 days for oysters to depurate brevetoxin and for SHAs to be reopened after K. brevis cell concentrations dropped below regulatory limits. The current guidelines in the National Shellfish Sanitation Program Model Ordinance’s Marine Biotoxin Monitoring for NSP do not specify which species of shellfish should be examined for SHA regulations. However, our findings show there is a different rate of brevetoxin depuration between oyster and clam species and this should be considered when monitoring SHAs with mixed shellfish.
No reports of human NSP illness were received during this event despite that fact that shellfish from seven SHA were at levels considered toxic for more than one month. This highlights the success of the standard operating procedure of the National Shellfish Sanitation Program Model Ordinance’s Marine Biotoxin Monitoring for NSP. It should be noted that at the onset of this event (September 25-29) construction workers dredging near Amelia Island reported experiencing respiratory and eye irritation, symptoms consistent with exposure to K. brevis blooms, to the Nassau County Health Department (Reich et al. 2008). Interagency cooperation between FDACS and FWC was instrumental in monitoring the 2007-2008 east coast K. brevis red tide event and preventing human illness due to NSP.
During the 2007-2008 K. brevis red tide event, four other species of Karenia were detected. Throughout the event, concentrations of Karenia mikimotoi, K. papilionacea, K. selliformis, and Karenia sp. #3 (morphologically similar to K. umbella) were at very low levels (0.3−7 × 10³ cells L−1) and co-occurred with K. brevis, except in Body E (Brevard County) where only K. selliformis was detected. This represents the first time these four Karenia species have been recorded on Florida’s east coast although they have been reported to occur in the Gulf of Mexico (Steidinger et al. 2008) and are found routinely during K. brevis red tides along the west Florida coast (J. Wolny unpublished data).
Karenia mikimotoi, K. papilionacea, and K. selliformis occurred September through December in mainly coastal samples (<70% of occurrences). This may indicate a coastal origin and / or movement of these species within the existing K. brevis bloom. Karenia sp. #3 was recorded in 78 samples, of which 55.2% were collected in the Intracoastal Waterway from October through January. This, along with previous records of Karenia sp. #3 made in the Indian River Lagoon during times when K. brevis was absent (J. Wolny unpublished data), may indicate a lagoonal origin or habitat preference for this species.
The National Shellfish Sanitation Program Model Ordinance’s Marine Biotoxin Monitoring for NSP guidelines for Florida’s commercial and recreational SHAs are based only on the presence of K. brevis and the toxicity of shellfish due to brevetoxin. To date, toxic compounds have not been found associated with K. papilionacea (Mooney et al. 2007) or K. umbella (de Salas et al. 2004). However, K. selliformis produces gymnodimines and spirolides, both types of neurotoxins (Dragunow et al. 2005), that have not been linked to any negative human health impacts but can produce false positives in toxin detection (Fonfría et al. 2010). The environmental triggers that may enhance the toxicity of polyunsaturated fatty acids and other bioactive compounds produced by K. mikimotoi are still being investigated (Mooney et al. 2007, Chen et al. 2011). The management implications for the presence of multi-species Karenia blooms in Florida waters have not been addressed and are an avenue for future research and policy reviews.
One of the main limiting factors for using satellite remote sensing to detect HABs is the optical complexity of shallow inshore waters (Hu et al. 2005), like those of Florida’s Intracoastal Waterway. KDE mapping is useful for representing spatial data points over 2-D geographical space (Xie and Yan 2008) and Wang and Wu (2009) used KDE mapping to identify ‘hot spots’ of HAB activity in the East China Sea. While the use of ocean optics and satellite imagery for detecting and monitoring algal blooms has been well documented and tested on Florida’s west coast (Hu et al. 2005, Cannizzaro et al. 2008, Tomlinson et al. 2009), the same is not true for Florida’s east coast. Until such a time when satellite imagery and ocean optics can be relied on for imaging algal blooms on Florida’s east coast it may be beneficial to use KDE mapping to create a more accurate picture of how an area is being impacted, since blooms are known to occur over a geographic expanse and not just where a sample is taken. This paper reports on the first time this technique has been used to visualize a Florida HAB. The map presented in Fig. 3 gives a more realistic image of what the geographical extent of the Karenia bloom looked like along Florida’s east coast. Like the KDE model developed by Wang and Wu (2009) our approach did not take into account meteorological factors, such as tides and currents, which obviously play a role in bloom distribution. Before KDE mapping can be used by FWC, FDACS, or other agencies for management and mitigation strategies, the appropriate bandwidth should be tested with concentrated, fixed-point discrete sampling and flow-rate measurements along Florida’s east coast and within the Intercoastal Waterway.