검색 전체 메뉴
PDF
맨 위로
OA 학술지
Simulation and Experimental Validation of Gain-Control Parallel Hybrid Fiber Amplifier
  • 비영리 CC BY-NC
  • 비영리 CC BY-NC
ABSTRACT
Simulation and Experimental Validation of Gain-Control Parallel Hybrid Fiber Amplifier
KEYWORD
Parallel hybrid fiber amplifier , Raman fiber amplifier , Erbium doped fiber amplifier , Gain control
  • I. INTRODUCTION

    Hybrid Raman/erbium-doped fiber amplifiers are an enabling and promising technology for future dense wavelength-divisionmultiplexing (DWDM) multi-terabit systems, as it has been shown by recent experimental results [1-7]. Hybrid fiber amplifiers are designed to maximize the span length, minimize the impairments caused by fiber nonlinearities, enhance erbium doped fiber amplifier (EDFA) bandwidth, provide sufficient increase in overall signal gain and enhance the pump conversion efficiency [8-11]. Two main configurations were used in the design of the hybrid fiber amplifiers; serial hybrid fiber amplifiers (S-HFA) and parallel hybrid fiber amplifiers (P-HFA).

    In serial architecture, the input signal has two stages of amplification based on a single path, In other words, the output signal of the first stage is used as an input signal for the second stage. Even though this type of amplifier has high overall gain and an acceptable noise figure, there is still an issue in gain flatness. Masuda et. al. in 1998 reported a wide 3-dB gain-bandwidth hybrid fiber amplifier without using any gain-equalizer to produce a flat gain spectrum for a 76 nm range from 1531.5 nm to 1607.5 nm. However, the design used three amplification stages and five laser diodes as pumping sources, one unit to pump the EDFA and four units with different operating wavelengths to pump the Raman fiber amplifier (RFA) [12].

    In 2008, Liang et. al. reported an S-HFA with wide (65 nm) amplification bandwidth from 1530 nm to 1595 nm and lower gain variation (< 0.2 dB) [13]. However, to get the low gain variation, a complicated array of fiber Bragg grating mirrors was employed.

    The P-HFA in which the input signal was separated into two wavelength bands (C and L) was reported in [14-16]. One method used to improve gain flatness is to split pump power going into gain media. The optimum ratio of pump power going to erbium and Raman was found to be 1:29. The reported gain is 3-dB at input signal power of -20 dBm. However, as the input power increases, the gain variation degraded to 4 and 6dB at input signal power of -10dBm and 0dBm, respectively.

    In this paper, we proposed a new P-HFA concept where, instead of dividing the pump power, the input signal is divided into two. The gain spectrum flatness is controlled by varying the input signal ratio. Wide flat gain bandwidth over a range of 60 nm from 1530 nm to 1590 nm was obtained at input signal power range from -30 dBm to -5 dBm.

    II. GAIN AND NOISE FIGURE OF PARALLEL HYBRID FIBER AMPLIFIER

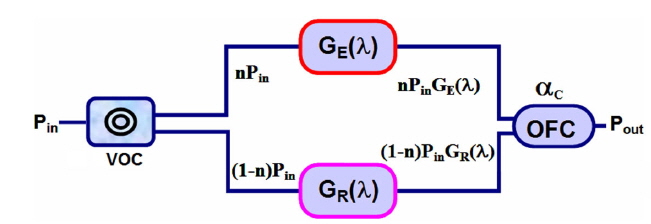
    Figure 1 shows the power tracing of the light path for the proposed P-HFA. The VOC is used to control the input signal power ratio. In this equivalent light path diagram, the power tracing is adopted to calculate the overall hybrid gain.

    The hybrid gain GH is given by:

    image
    image

    where, 0 < n < 1 represents the coupling ratio of VOC, Pin (mW) is the input signal power, Pout (mW) is the output signal power, GE and GR are the gain factor of the EDFA and RFA, respectively and αC is the OFC loss factor.

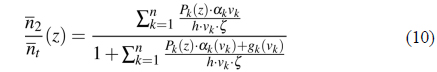
    Thus, the P-HFA gain factor as a function of signal wavelength λ is:

    image

    GE in Eq.(3) is based on a derived model presented by [17]. Three fiber parameters were used in this proposed model which are: absorption coefficient (αk), gain coefficient (gk), and a fiber saturation parameter (ζ). These parameters are obtained by conventional fiber measurement techniques covered by [17]. The saturation parameter can be defined theoretically as:

    image

    where: beff is the equivalent radius of the doped region, nt is the local erbium ion density and τ is the metastable lifetime parameter.

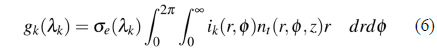
    The absorption and gain coefficients are expressed in terms of distributions of the ions and optical modes:

    image
    image

    where, σa(λk) and σe(λk) are the absorption and emission cross-section of the kth beam and ik(r, ϕ) is the normalized optical intensity.

    For a uniform ion distribution, the absorption and gain coefficients can be simplified as:

    image
    image

    where: Γk (λk) is the overlap integral.

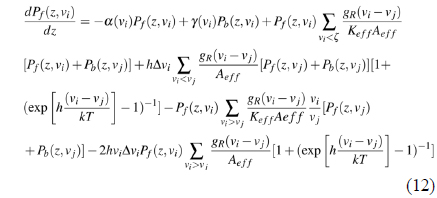
    The propagation equation in terms of saturation parameter, and absorption and emission coefficients in [17]:

    image

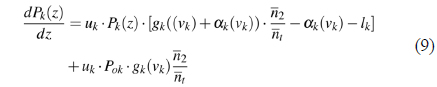
    where each beam propagates in the forward uk=1 or backward uk=-1 direction, and the spontaneous emission contribution from the local metastable population and lk is the background loss. The steady-state solution of the rate equation can be rewritten as:

    image

    Finally GE is presented as the ratio of the output signal power to the input signal power [18]:

    image

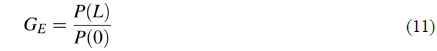
    where: P(0) represent the input signal power and P(L) is the output signal power obtained by solving Eq.(10) under the homogeneous line broadening case.
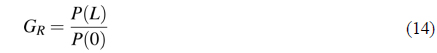
    In addition, GR in Eq. (3) is obtained by solving the output signal power equation using the numerical solution presented by [19]:

    image

    where vi and vj are frequencies, gR is the Raman gain coefficient, α(v) is the fiber attenuation, γ(v) is the Rayleigh backscattering coefficient, gR(vi-vj) is the Raman gain coefficient for frequency difference (vi-vj), Pb(z, vi) is the backward propagating power including sampled, parameterized, and noise bins signals, Aeff is the effective core area, Keff is the polarization factor, Δ𝜐 is the frequency interval, h is Plank’s constant, k is the Boltzmann’s constant and T is the absolute temperature.

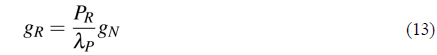
    Raman gain reference pump and the Raman peak gain are needed in the simulation. Therefore, these two values were obtained by solving the following formula derived by [19].

    image

    where, PR is the Raman gain peak, λP is the gain reference pump and gN is the normalized Raman gain. Finally, GR was calculated as the ratio of the output signal power to the input signal power [20]:

    image

    where P(0) is the input signal power and P(L) represents the output signal power obtained form Eq.(12).

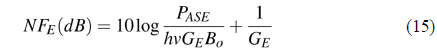
    In terms of the NF of P-HFA, the EDFA NF was presented by [18], given as:

    image

    where PASE is the generated noise in EDFA, h is Planck’s constant, v is the optical frequency of the input signal in Hz, GE is the gain of the EDFA and Bo is the optical bandwidth in Hz.

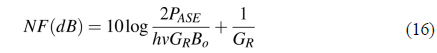
    The NF in RFA can be simply estimated by calculating the Raman gain GR and the PASE power [21]:

    image

    where PASE and GR represent the generated noise and the gain in the RFA respectively.

    The summation of Eqns. (15) and (16) can represent the hybrid gain because the signal is split into two identical source (in term of λ) to be amplified by different gain media.

    image

    III. SIMULATION DESIGN

    In the simulation design the bi-directional fiber model is adopted as a Raman gain medium. In this model, pump-to-pump, signal-to-signal and pump-to-signal Raman interactions, spontaneous Raman emission and its temperature dependency and stimulated Raman scattering (SRS) are considered. In addition, the pump depletions due to Raman energy transfer, high-order Stokes generation, multiple Rayleigh backscattering, fiber loss and spontaneous emission noise were also considered. Moreover, the stimulated Brillouin scattering (SBS) and pump depletions due to SRS effects are included in this model [22, 23].

       3.1. Simulation Setup

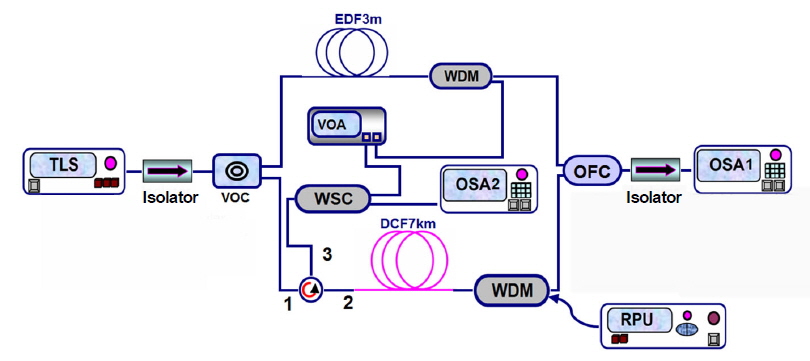
    Figure 2 shows the design of P-HFA. A variable optical coupler is used to control the input signal power between the two branches (EDFA and RFA). The input signal is provided by a tunable laser source (TLS) with power range from -30 to -5 dBm at wavelength range from 1530 nm to 1595 nm with linewidth of 150 kHz. The RFA is a 7 km of dispersion compensating fiber (DCF), pumped in a counter pump direction by a Raman pump unit (RPU) with output power of 800 mW at 1480 nm. The DCF has total loss of 4.4 dB, effective area of 18.5 μm2, nonlinear coefficient of 14.5 × 10⁻¹⁰ W-1 and dispersion parameter of -110 ps/nm/km. The EDFA is a 3 m erbium doped fiber (EDF) pumped by the residual Raman pump power about 75 mW, controlled by a variable optical attenuator (VOA). The Er3+ ion concentration is 440 ppm, core radius is 1.9 μm, Er doping radius is 1.9 μm, and cut-off wavelength is 1300 nm. A wavelength selective coupler (WSC) is used to separate the residual Raman pump from the reflected Rayleigh scattering signal. An optical fiber coupler (OFC) is used to collect the output signal from the two branches. Finally, two optical spectrum analyzers are used, the OSA1 to record the total system gain and OSA2 to record the Brillouin Stokes power.

       3.2. Simulation Results

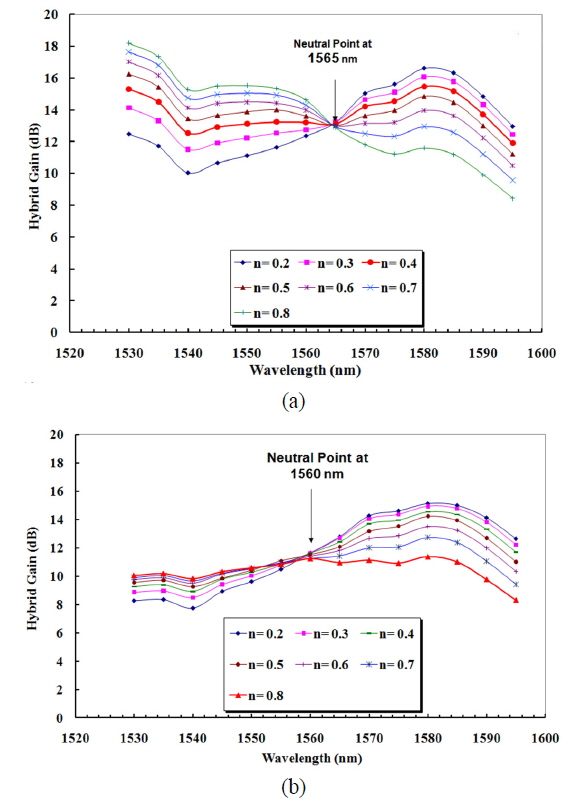
    The overall gain profile of different coupling ratios with Pin of -30 dBm and -5 dBm is depicted in Fig. 3 (a) and (b), respectively. The hybrid gain values are calculated using Eq. (4). The coupling ratio n represents the percentage of input signal power that goes into EDFA.

    The overall gain spectra can be divided into three regions: 1) C-band region where EDFA is more effective, 2) L-band region in which the RFA is more efficient and 3) neutral region or balance point where the input signal is amplified by equal gain from both EDFA and RFA for all coupling ratios.
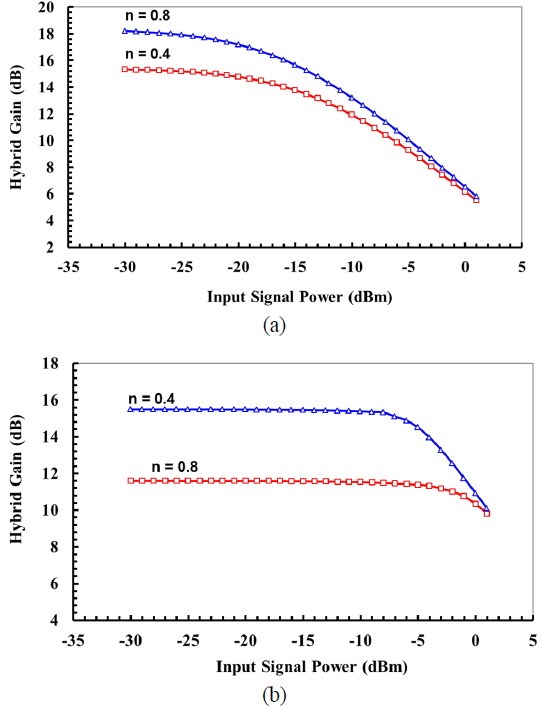
    For small Pin (-30 dBm), as the n value changes from 0.2 to 0.8, the gain shows decreasing trend from 1525 nm to neutral point (1565 nm) and increasing trend from there on until 1595 nm. At n = 0.4, the gain variation is smallest compared to others. For large input (-5 dBm), as depicted in Fig. 3(b), the trend is similar but the neutral point is slightly shifted to 1560 nm. The best gain variation is when n = 0.8.

    At small input signal, no saturation occurs in RFA for both n values while the EDFA starts to saturate at signal power above -15 dBm causing the hybrid gain to decrease (Refer Fig. 4). As a result to this saturation effect in the EDFA, an increment in n factor is required to increase the C-band gain level and produce wide gain flatness.

    IV. EXPERIMENTAL VALIDATION

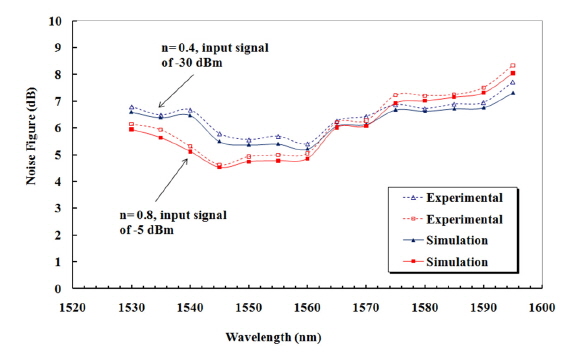
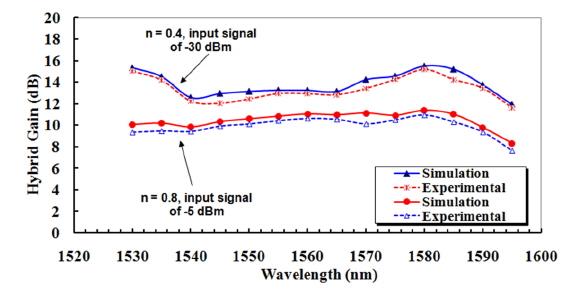
    The simulation was validated by experiment for two values of n, 0.4 and 0.8 since they give the best gain flatness for small and large signal, respectively. The hybrid gain spectra are illustrated in Fig. 5. The experimental result shows very close agreement with the simulation where the gain average obtained experimentally is 13.3 dB for small signal and 9.9 dB for large signal. The gain variation is 1.06 dB at small signal and 0.77 dB at large signal for simulation while the values obtained from experiment are 1.07 and 0.81 dB, respectively.

    The simulated and experimental noise figure (NF) is shown in Fig. 6. The highest NF value of the small and large input signals in the C-band region was recorded at 1530 nm. This is because of the noisy amplifier spontaneous emission (ASE) at the short wavelength range. The worst NF in the L-band was observed at 1595 nm caused by steep gain drops, as it is quite far away (15 nm) from the maximum Raman gain at 1580 nm.

    V. CONCLUSION

    The gain performance of a new gain-controlled P-HFA design is simulated and experimentally demonstrated. A wide gain bandwidth of 60 nm from 1530 nm to 1590 nm is obtained with input signal less than -5 dB. The gain variation is about 1.06 dB at small input signal. This variation is enhanced and reduced to 0.77 dB at the large input signal. The gain flatness is improved and the gain dynamic range is increased as well compared with the conventional P-HFA. Finally, the experimental results show good agreement with the simulation result.

참고문헌
  • 1. Yuan J., Liang T., Wang W., Gu S. 2011 “Impact analysis on performance optimization of the hybrid amplifier (RA+EDFA),” [Optik - Int. J. Light Electron Opt.] Vol.122 P.1565-1568 google cross ref
  • 2. Azawe M. I. 2011 “Low noise C-band EDFA/DRA hybrid amplifier using the same pump laser,” [Photonics Lett. Pol.] Vol.3 P.165-167 google
  • 3. Guo M. N., Liaw S.-K., Shum P. P., Chen N.-K., Hung H.-K., Lin C. 2011 “Single-wavelength-pump bi-directional hybrid fiber amplifier for bi-directional local area network application,” [Opt. Commun.] Vol.284 P.573-578 google cross ref
  • 4. Abu Bakar M. H., Abas A. F., Mokhtar M., Mohamad H., Mahdi M. A. 2011 “Utilization of stimulated raman scattering as secondary pump on hybrid remotely-pump L-band Raman/erbium-doped fiber amplifier,” [Laser Phys.] Vol.21 P.722-728 google cross ref
  • 5. Singh S., Kaler R. 2013 “Flat-gain L-band Raman-EDFA hybrid optical amplifier for dense wavelength division multiplexed system,” [IEEE Photon. Technol. Lett.] Vol.25 P.250-252 google cross ref
  • 6. Abu Bakar M. H., Mahamd Adikan F. R., Ibrahim N. H., Mahdi M. A. 2013 “L-band R-EDFA/Raman hybrid amplifier with enhanced higher-order pumping scheme utilizing stimulated raman scattering,” [Opt. Commun.] Vol.291 P.155-161 google cross ref
  • 7. Jamaludin M. Z., Abdullah F., Al-Mansoori M. H., Rawi N. I. M., Idris S. M., Haleem M. R. 2014 “Remotely pumped hybrid double-pass L-band optical amplifier utilizing chirped fiber Bragg,” [Optik - Int. J. Light Electron Opt.] Vol.125 P.620-623 google cross ref
  • 8. Carena A., Curri V., Poggiolini P. 2001 “On the optimization of hybrid Raman/erbium-doped fiber amplifiers,” [IEEE Photon. Technol. Lett.] Vol.13 P.1170-1172 google cross ref
  • 9. Kawai S., Masuda H., Suzuki K., Aida K. 1999 “Wide-bandwidth and long-distance WDM transmission using highly gain-flattened hybrid amplifier,” [IEEE Photon. Technol. Lett.] Vol.11 P.886-888 google cross ref
  • 10. Masuda H., Kawai S. 1999 “Wide-band and gain-flattened hybrid fiber amplifier consisting of an EDFA and a multiwavelength pumped Raman amplifier,” [IEEE Photon. Technol. Lett.] Vol.11 P.647-649 google cross ref
  • 11. Lee J. H., Chang Y. M., Han Y.-G., Kim S. H., Chung H., Lee S. B. 2005 “Dispersion-compensating Raman/EDFA hybrid amplifier recycling residual Raman pump for efficiency enhancement,” [IEEE Photon. Technol. Lett.] Vol.17 P.43-45 google cross ref
  • 12. Masuda H., Kawai S., Aida K. 1998 “76-nm 3-dB gain-band hybrid fiber amplifier without gain-equalizer,” [Optical Amplifiers and Their Applications] P.78-81 google
  • 13. Liaw S.-K., Huang Y.-S. 2008 “C+L-band hybrid amplifier using FBGs for dispersion compensation and power equalisation,” [Electron. Lett.] Vol.44 P.3-4 google cross ref
  • 14. Liaw S., Huang K., Chen W., Hsiao Y., Lai I. 2006 “Investigate C+ L band EDFA/Raman amplifiers by using the same pump lasers,” [JCIS] P.PNC-I I google
  • 15. Padwal S., Chattopaddhyay M. 2013 “Performance analysis of hybrid optical amplifier in C and L band over EDFA and RFA,” [Int. J. Adv. Res. Electron. Commun. Eng.] Vol.2 P.40-44 google
  • 16. Liaw S. K., Huang C. K., Hsiao Y. L. 2008 “Parallel-type C+ L band hybrid amplifier pumped by 1480 nm laser diodes,” [Laser Phys. Lett.] Vol.5 P.543-546 google cross ref
  • 17. Giles C., Desurvire E. 1991 “Modeling erbium-doped fiber amplifiers,” [J. Lightwave Technol.] Vol.9 P.271-283 google cross ref
  • 18. Becker P., Olsson N., Simpson J. 1999 Erbium-Doped Fiber Amplifiers Fundamentals and Technology google
  • 19. Aseka M. K., Menifb M. 2002 “Protection of surviving channels in pump-controlled gain-locked Raman fibre amplifier,” [Opt. Commun.] Vol.210 P.57-65 google cross ref
  • 20. Headley C., Agrawal G. 2005 Raman Amplification in Fiber Optical Communication Systems google
  • 21. Bristiel B., Gallion P., Jaouen Y., Pincemin E., R F. T., Anticipa T., Marzin A. P. 2004 “Intrinsic noise figure derivation for fiber Raman amplifiers from equivalent noise figure measurement,” [Proc. Lightwave Technologies in Instrumentation and Measurement Conference] P.19-20 google
  • 22. Stolen R. H., Ippen E. P. 1973 “Raman gain in glass optical waveguides,” [Appl. Phys. Lett.] Vol.22 P.276-278 google cross ref
  • 23. Ali M. H., Abdullahi F., Jamaludini M. Z., AI-Mansoori M. H., AI-Mashhadani T. F., Abass A. K. 2013 “Effect of EDF position on the performance of hybrid dispersion-compensating Raman/EDF amplifier,” [Proc. 4th International Conference in Photonics (ICP)] P.187-189 google
OAK XML 통계
이미지 / 테이블
  • [ FIG. 1. ]  Equivalent light path of PHFA. VOC: Variable Optical Coupler, OFC: Optical Fiber Coupler.
    Equivalent light path of PHFA. VOC: Variable Optical Coupler, OFC: Optical Fiber Coupler.
  • [ ] 
  • [ ] 
  • [ ] 
  • [ ] 
  • [ ] 
  • [ ] 
  • [ ] 
  • [ ] 
  • [ ] 
  • [ ] 
  • [ ] 
  • [ ] 
  • [ ] 
  • [ ] 
  • [ ] 
  • [ ] 
  • [ ] 
  • [ FIG. 2. ]  Schematic diagram of parallel hybrid utilizing gain controlled technique. TLS: Tunable Laser Source, VOC: Variable Optical Coupler, VOA: Variable Optical Attenuator, OSA: Optical Spectrum Analyzer, RPU: Raman Pump Unit, WDM: Wavelength Division Multiplexer, WSC: Wavelength Selector Coupler, DCF: Dispersion Compensating Fiber, EDF: Erbium Doped Fiber, OFC: Optical Fiber Coupler.
    Schematic diagram of parallel hybrid utilizing gain controlled technique. TLS: Tunable Laser Source, VOC: Variable Optical Coupler, VOA: Variable Optical Attenuator, OSA: Optical Spectrum Analyzer, RPU: Raman Pump Unit, WDM: Wavelength Division Multiplexer, WSC: Wavelength Selector Coupler, DCF: Dispersion Compensating Fiber, EDF: Erbium Doped Fiber, OFC: Optical Fiber Coupler.
  • [ FIG. 3. ]  Hybrid gain profile at different coupling ratios for: (a) Pin of -30 dBm and (b) Pin of -5 dBm.
    Hybrid gain profile at different coupling ratios for: (a) Pin of -30 dBm and (b) Pin of -5 dBm.
  • [ FIG. 4. ]  Hybrid gain vs. Pin for two different wavelengths (a) 1530 nm and (b) 1580 nm.
    Hybrid gain vs. Pin for two different wavelengths (a) 1530 nm and (b) 1580 nm.
  • [ FIG. 5. ]  Simulation & experimental validation of hybrid gain spectra for two coupling ratios of n = 0.4 at the Pin of -30 dBm and n = 0.8 at the large Pin of -5 dBm.
    Simulation & experimental validation of hybrid gain spectra for two coupling ratios of n = 0.4 at the Pin of -30 dBm and n = 0.8 at the large Pin of -5 dBm.
  • [ FIG. 6. ]  Simulation & experimental validation of hybrid noise figure for two coupling ratios of n = 0.4 at the Pin of -30 dBm and n = 0.8 at the large Pin of -5 dBm.
    Simulation & experimental validation of hybrid noise figure for two coupling ratios of n = 0.4 at the Pin of -30 dBm and n = 0.8 at the large Pin of -5 dBm.
(우)06579 서울시 서초구 반포대로 201(반포동)
Tel. 02-537-6389 | Fax. 02-590-0571 | 문의 : oak2014@korea.kr
Copyright(c) National Library of Korea. All rights reserved.