Shellfish (bivalve molluscs) are a food consumed worldwide. However, areas of shellfish production are often located in estuaries or coastal waters, which are heavily influenced by human-mediated factors (Carlos et al., 2013). Shellfish filter suspended particles and accumulate microorganisms from the surrounding waters. They are passive carriers of pathogens, making them vehicles in the transmission of several bacterial and viral enteric diseases. This is especially prevalent and of concern in areas that partake in raw consumption (Bagordo and Grassi, 2013).
Indicator organisms including fecal coliform (U.S. National Shellfish Sanitation Program) and
The purpose of this study was to investigate the seasonal prevalence of norovirus in shellfish and to compare it to the level of
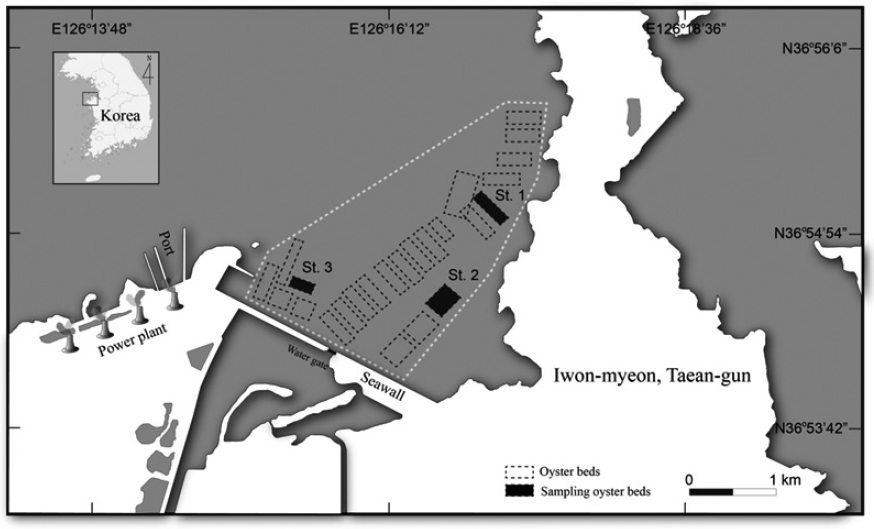
In Iwon-myeon, Taean-gun, Korea, a primary area for European Union export, three selected beds were chosen from an oyster production area. These beds were closed off to any potential inland pollution. From each bed, one sample of 20 or more oysters
>
Preparation of sample homogenate for norovirus detection
Digestive glands from 20 shellfish were excised and finely chopped using a razor blade. A 2-g subsample of each chopped gland was transferred to a clean tube and 10 μL of feline calicivirus (FCV) tissue culture supernatant was added as an extraction process control for viral RNA. Homogenates were treated with 2 mL of 100-μg/mL proteinase K solution (30 U/mg; Promega) (Dancer et al., 2010). Next, the sample was incubated at 37°C while shaking at 320
Total RNA was extracted from 500 μL of shellfish homogenate using Qiagen-Viral RNA Mini Kits (Qiagen, Venlo, Germany) according to the manufacturer’s instructions. Negative (water only) and positive (homogenate-derived from bioaccumulated oysters) controls were also prepared and tested in parallel with each set of samples. Eluted RNA was stored at -20°C until further analysis. The positive control was used as a within-batch RNA extraction and quantitative reverse transcription-polymerase chain reaction (qRT-PCR) control in addition to a FCV process control.
>
Duplex quantitative reverse transcription polymerase chain reaction (qRT-PCR)
For G1, primers COG1F/COG1R and probe RING1(a)-TP (Kageyama et al., 2003) were used. For G2, primers BPO-13/BPO-13N/BPO-14 and probe BPO-18 (KFDA, 2014) were used. We used FCV primers and probes as described previously (Lee et al., 2009). For both norovirus genogroup-specific assays, three 5-μL aliquots of RNA from samples and the control were tested in a 25-μL total volume reaction mixture containing the following components: 12 μL (2X) RT-PCR buffer, 0.5 μL (25X) enzyme mix, 1.5 μL enhancer, 1 μL (10 pmol) of each primer, and 0.5 μL (10 pmol) of each probe. Amplification was performed using a Dice TP600 thermocycler (Takara, Japan) at the following cycling parameters: 45°C for 30 min, 95°C for 10 min, followed by 45 cycles of 95°C for 15 s and 56°C for 60 s. Wells containing nuclease-free H2O and the above Duplex qRT-PCR mixes were also included on each plate as negative controls.
All samples were assessed for extraction efficiency by comparing the sample cycle threshold (CT) values for FCV to a standard curve generated from the process control material, as described previously (Lee et al., 2009). Quantification of viral load was determined by the methods outlined by the Joint CEN-ISO Coordinating Group (Lees, 2010). For each qRTPCR replicate, the quantity (copies/μL) was calculated using the corresponding standard curve (Lowther et al., 2012). Average quantities from three replicates were calculated and used as the representative quantity of virus per sample.
>
Quantification of Escherichia coli
Homogenates were prepared from the flesh and intravalvular fluid of shellfish and assayed according to the ISO/TS 16649-3 most probable number (MPN) technique using 5-bromo-4-chloro-3-indolyl-beta-D-glucuronide (International Organization for Standardization, 2005). Results were recorded as MPN/100 g of shellfish flesh and intravalvular fluid.
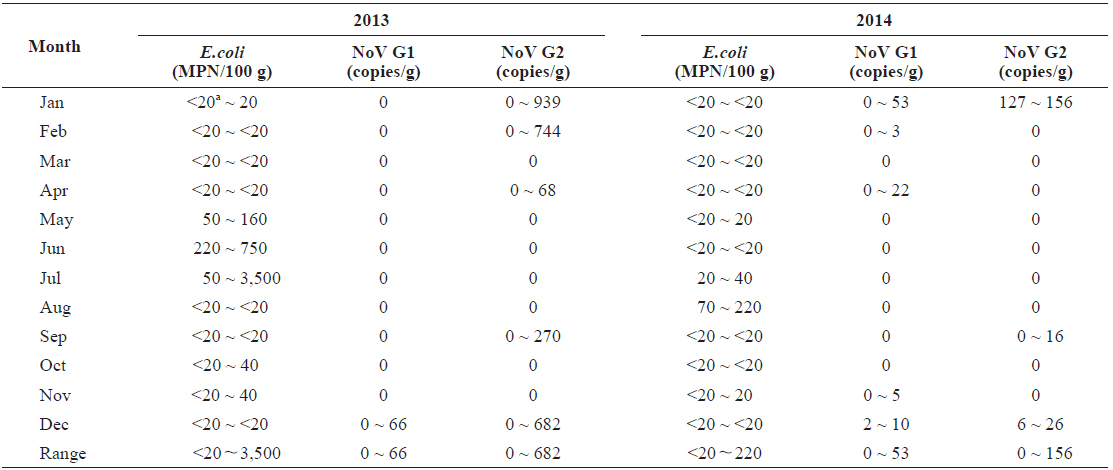
In total, 15 samples (20.8%) tested positive for norovirus; three (20.0%) were positive for both genogroups, five (33.3%) were positive for G1 only, and seven (46.7%) were positive for G2 only. Norovirus prevalence had high seasonal variability, with 66.7% of the samples positive (10/15 samples) during winter months (Dec.-Feb.) and 0% positive (0/15) during summer months (Jun to Aug) from 2013 to 2014 (Table 1).

Monthly levels of norovirus and Escherichia coli level in oysters Crassostrea gigas collected from Iwon-myeon, Taean-gun, Korea from 2013 to 2014
Quantitative data indicated that levels of norovirus varied greatly among individual oysters. We observed 66 copies/g of norovirus G1 and 939 copies/g of G2. However, a large proportion of the positive results (40%) were below the method’s limit of detection (10 copies/g). Levels of norovirus G2 were on average higher than those observed for G1.
>
Comparison with Escherichia coli
In total, 68 of the 72 samples contained bacterial fecal levels compliant with the standards required by the European Union Food Regulations for raw consumption of shellfish (< 230 MPN/100 g) (European Community, 2004). The highest level recorded was 3,500 MPN/100 g in July 2013 (Table 1). There was seasonal variation of
In samples with < 230 MPN/100 g of
In total, 60 samples were collected from the oyster production area in Iwon-myeon, Korea with a category A classification status and 12 from a category B classification. We observed a difference in the average amount of norovirus contamination between oysters collected from categories A and B (Table 2). For each classification, the percentage of samples positive for norovirus (G1 and/or G2) was different. Samples from category A, a status that indicates that oysters can be consumed raw without any post-harvest treatment under the relevant regulation of the European Union (European Community, 2004), had 25.0% of the samples test positive for norovirus (15/60). However, norovirus was not detected in any of the samples taken from category B areas, areas in which shellfish can only be consumed after purification by relaying or depuration.
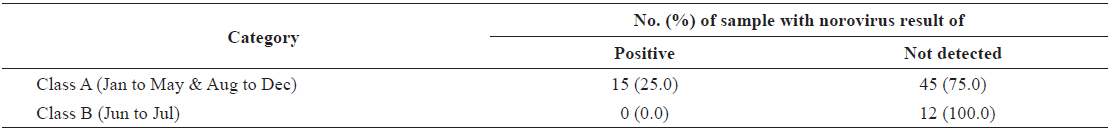
Norovirus positive and not-detected samples taken from shellfish production areas complied with EU classification category A and B
>
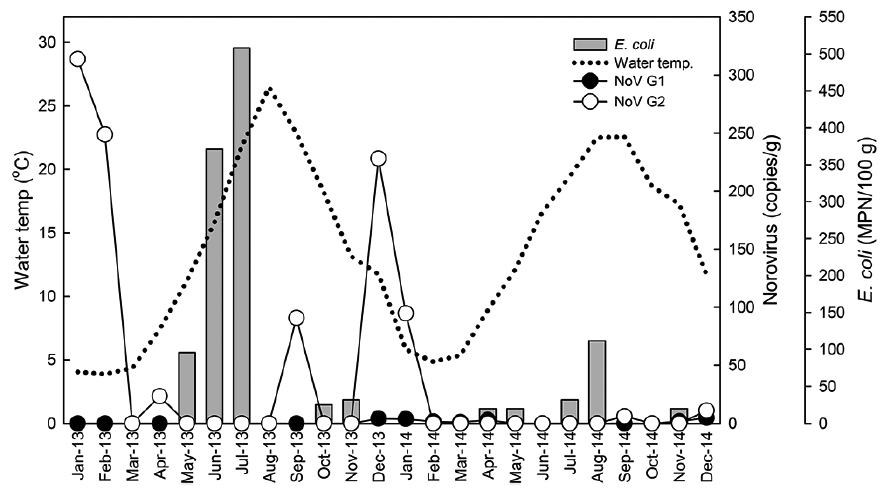
Comparison with water temperatures
In Fig. 2, water temperatures during the study period are shown in conjunction with norovirus and
Similar to previous studies (Le Guyader et al., 2000; Formiga-Cruz et al., 2002; Lowther et al., 2008; Flannery et al., 2009), we observed norovirus seasonality in shellfish, with a higher prevalence and viral load detected during the winter months of the study period. Possible explanations include a greater persistence of the virus in low solar irradiation, low temperature, higher turbidity, and higher norovirus prevalence in the human population during winter months (Blanton et al., 2006; Lowther et al., 2012; Allwood et al., 2005; Cannon et al., 2006). It is thought that oysters are more effective at viral purging during summer months due to heightened metabolism in warmer waters (Doré et al., 1998; Hernroth and Allard, 2007), Furthermore, shellfish production areas are located in transitional and coastal waters which are influenced by many environmental factors that are present at the boundaries of land, freshwater, and seawater environments (Clements et al., 2015). These factors are more stressful on bacterial organisms including
Routine bacterial monitoring of shellfish production areas using fecal indicators is a common global practice designed to prevent human consumption of contaminated shellfish (Clements et al., 2015). European Union food regulation 854/2004 (European Community, 2004) also outlines microbiological criteria required for shellfish production areas in EU countries as well as third-world countries, including Korea, that participate in the international shellfish trade. Shellfish from category A production areas meet the requirements necessary to be consumed raw. Shellfish from these areas must contain < 230
This study supports the assumption that using bacterial parameters (fecal indicator) alone is not sufficient in identifying the presence of enteric viruses in shellfish (Greening and McCoubrey, 2010). Previously, routine assessment of pathogenic viruses was difficult because of viral issues regarding small dimensions, variety of species, lack of replication in the environment, low concentrations, and our inability to cultivate these species (Bagordo and Grassi, 2013). However, recently technological advances have overcome the difficulties associated with detecting viruses in the environment. Several methods are now available to evaluate viral contamination in shellfish (Legeay et al. 2000; Manso and Romalde, 2013). For example, validated methods to detect norovirus and hepatitis A virus have been developed (Greening and Hewitt, 2008; Lees, 2010).
Similar to other studies, this study observed the presence of norovirus in oysters that had levels of