Towed fishing gear has a little selectivity for the size of fish captured by the nets. The massive gear is towed at high speed to chase the fish into the nets. Trapped fish are often exhausted and have no energy reserves for escaping the codend. The collateral catch (bycatch) of non-targeted species and small juvenile fish of targeted taxa is of great concern; the issue has become a focus of attention for researchers in fisheries management and resource maintenance (Sea Grant, 2014). Non-targeted species include fish, birds, turtles and marine mammals of all sizes. Bycatch reduction is a major objective for sustainable fisheries management. Most of the bycatch reduction procedures exploit supplementary devices that operate using traditional net gear (Bycatch Reduction Devices, BRD) to separate species. In addition, gear design structures have been modified to reduce the catch of small fish as the square mesh window, for example (Sala et al., 2015).
Commercial fishery bycatch procedures focus on reducing the take of smaller fish, thereby reducing the manual effort for size-sorting onboard. Escaping juveniles will contribute to future growth of fish stocks. The sizes of caught fish are controlled by legal regulation of mesh diameter in most countries. Mesh materials, twine diameters, mesh openings (e.g., the hanging ratio, mesh shape, grid intervals), and the length and circumference of the codend are seldom restricted by law. More effective modifications of fishing gear and new legislation will certainly contribute to improved bycatch reduction in the future (Chopin and Suuronen, 2009). Trawler fishermen believe that bycatch reduction procedures also reduce the catch of larger desirable target fish.
BRDs for towed gear have been investigated over decades. They have been adapted according to gear type, locality, target species, and unwanted fish species; modifications have also been aimed at preventing the catch of specific animals (MacLennan, 1992; Broadhurst, 2000; Matsushita, 2000; Ryer, 2008; Sea Grant, 2014). Most BRDs function as mechanical separators (e.g., sieve filters) and are fabricated from rigid materials. They are used with flexible nets and can cause difficulties in gear handling. Rigid BRDs are bulky. Flexible devices have been developed in recent years (Massuti et al., 2009; He and Balzano, 2011). Current BRD systems are prone to masking effects as the catch accumulates; this is especially true for juveniles of the target species.
Therefore initial approaching concept for bycatch reduction was simple modification of the gear or least additional device using flexible material by using fish behavior to triggering escape easily like most of fishing method developed (Beutel et al., 2008). From above point, reduction in juvenile catch of same species as a basic concept is using stimulating of the device and response behavior of fish to disrupt an optomotor response which is maintaining relative position and speed to prevent escape through the mesh (Wardle, 1993; Kim et al., 2008). There were several active stimulating devices were examined for disturbing the optomotor behavior or to drive fish close to the mesh by fluttering the net or twine, and shaking canvas as well generated in the turbulent flow inside the codend (Kim and Whang, 2010; Kim, 2011; Kim, 2013a; 2013b). More recently, trials have been carried out in water tanks with a shaking codend and sea trials by shrimp beam trawl have demonstrated a 30% reduction in juvenile catch (Kim and Whang, 2014). Among the various stimulating devices shaking canvas seems to be more practical considering simple attachment in codend and fishing operation without any modification inside codend and not to interfere existing hauling process.
Following the previous sea experiments by shrimp beam trawl (Kim and Whang, 2014), Fishing experiments by the bottom trawl were carried out to examine the effects on the reduction of juvenile fish by generating a shaking motion in the codend using a round canvas as a preliminary trials for practical application.
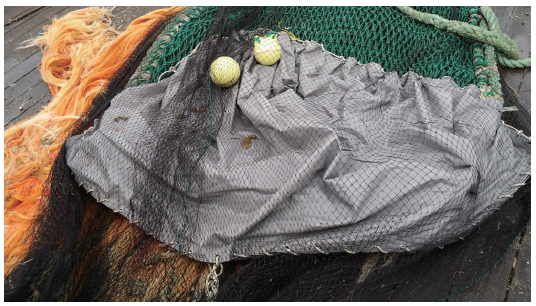
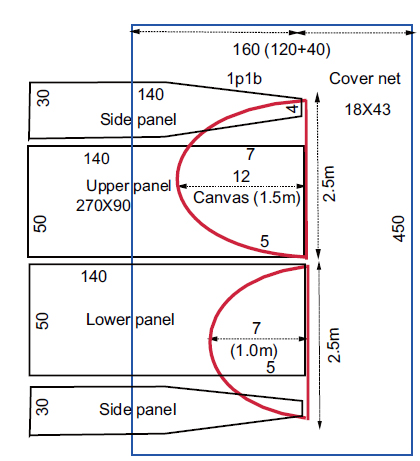
The fishing gear used was a regular six-panel bottom trawl with a total length of 58.7 m and headrope length of 45.2 m. The gear was deployed from the training ship “Saebada” (999 G/T, 3000 HP) (Kim, 2014). Linear dimensions in the fishing gear were as follows: normal warp length, ~500 m; otter pendant, 13.8 m; hand rope 96 m; and net pendant 47 m. The otter board used was a super-V type that was 3.4 m high, 2.0 m wide, weighed 1,697 kg underwater, and had an attack angle of 24°. The codend was made from double-panels of 90 mm diamond mesh made up from 5.7-mm-thick polyethylene (PE); the codend was 140 meshes in length and 160 meshes in circumference. The codend rope was 12.3 m long (Fig. 1). A circular canvas segment (tarpaulin, 1 mm thick, 2.5 m in diameter) was divided into two semicircular pieces cutting straightforward along normal direction at 1.5 m of diameter 2.5 m considering pulling out catch. The larger semicircle was attached at one end with a 12-mesh upper panel to the upper cord-seaming at the end of the codend. The smaller semicircle was attached with a 7-mesh lower panel to the lower cord-seaming. A flapping canvas segment was fixed to the codend mesh using 6 mm twine passed through the outer holes (arrayed at 15 cm intervals) around the circumference of the canvas to span a 1.5 m section at the end of the codend (Fig. 2).
The codend cover-net was made from PE (18 ply), and the mesh size was 43 mm. The cover-net was 160 meshes long and 450 meshes in circumference. The total length was 5 m. It was attached at its front end of the codend with four floats (15 cm diameter). The circumference was 2 m wider and 1 m longer than the codend without using a hoop to reduce masking effect (Wileman et al., 1996; O’Neill and Kynoch, 1996; Mituhasi et al., 2000; Deval et al., 2006).
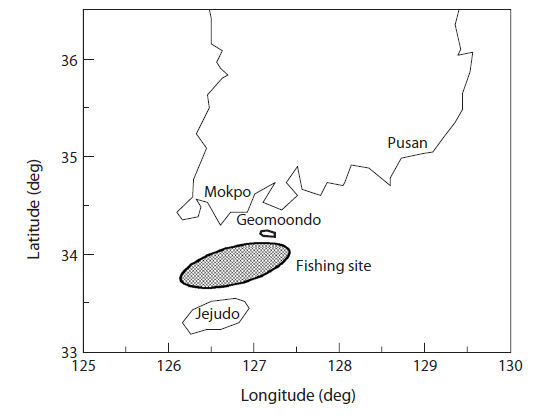
The shaking motion in the codend was measured at the top-front sector of the canvas and at the front end of the codend using a DST-tilt sensor (Star-Odi, Reykjavik, Iceland) (Kim and Whang, 2014) during trials T2-5 of steady codend and S2, S4-7 of shaking codend. The sensor was 15 mm in diameter, 46 mm long, and weighed 12 g in water. Its sensitivities were as follows: depth, ± 0.4%; tilt (yaw, pitch, roll), ± 1°; temperature, ± 0.1°C with selected sampling interval of 1.0 s. The towing speed was measured using a ship-installed Doppler log meter (TS-310, Tokimec, Tokyo, Japan) and a GPS device (Furuno, Tokyo, Japan). Fishing trials were performed 14 tows with and without flapping canvas between the islands of Gemoondo and Jejudo in western waters off the South Sea of the Korean peninsula (Fig. 3). Tows were made during the period 06/2014–07/2015 (Table 1).

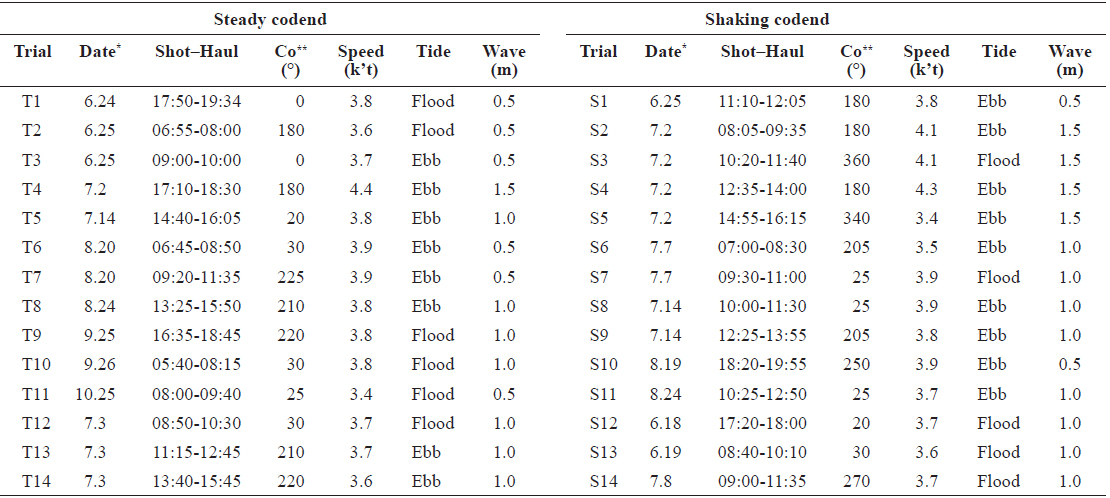
Details of bottom trawl fishing trials with traditional steady motion of codends (T) and experimental shaking motion of codends (S). Trials T1? T11 and S1-S11 were performed in 2014; trials T12-T14 and S12-S14 were performed in 2015
DST-tilt sensor measurements were analyzed to reveal the relevant shaking motion, which was detected as depth changes at the codend (vertical displacement) (Kim, 2014; Kim and Whang, 2014). Three-dimensional tilt changes representing rotational motion were collected by the DSTtilt sensor. The shaking motion was defined by the period and amplitude of the codend depth variation over short time intervals (< 30 s). Sampling at short time intervals reduced the confounding effect of variations in water depth above the seafloor. Using a custom Fortran program adapted an event analysis procedure calculated peak and trough values in the depth difference data; the analysis readily estimated period and amplitude in a single step (Narasimha et al., 2007; Kim, 2014).
After each haul, the catches in the codend and in the cover-net were sorted into marketable (mainly larger fish and squid) and bycatch (mainly smaller fish) components and then weighed (30 kg scale with 0.1 kg accuracy or 5 kg scale with 0.05 kg accuracy). The catch per hour (as catch per unit effort, CPUE) of each bottom trawl was estimated as the relevant catch weight divided by towing time, as indicated in Table 1. The bycatch in each haul was sorted, individual total body lengths (from snout to the end of the caudal fin) and maximum girth were measured to the 1.0 mm unit, and body weights were measured using a digital balance (0.01 g accuracy, EB-4000HU; Shimadzu, Otsu, Shiga, Japan). A t-tests was used to detect statistically significant differences between steady and shaking codends.
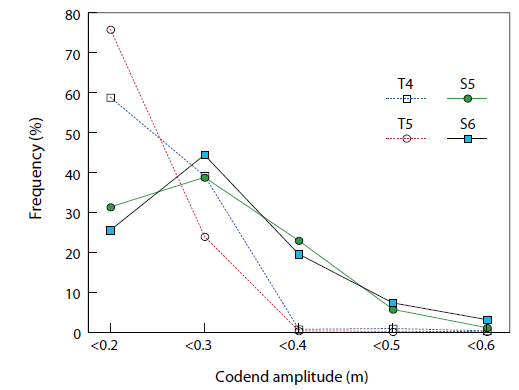
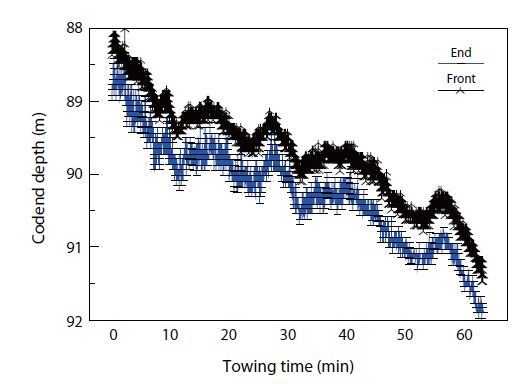
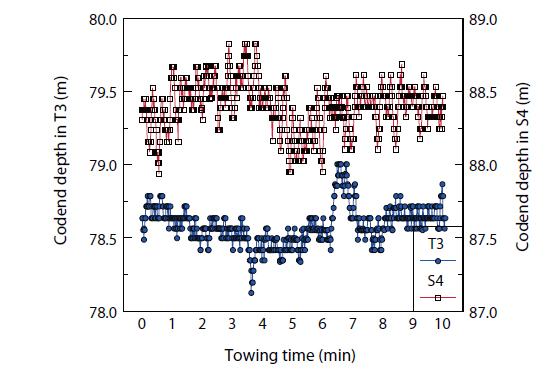
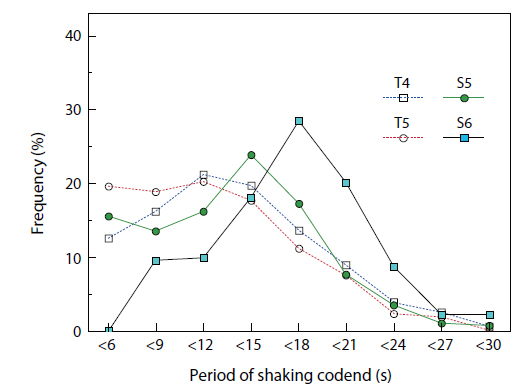
Variations in depth over towing duration at the front and rear ends of the codends when flexible canvas was attached are shown in Fig. 4. The rear of the codend experienced shaking motion, but depth at the front varied little. Depth variation at the rear end of the codend was greatest when the shaking canvas were attached (Fig. 5). The frequency distributions of the shaking periods (calculated by peak event analysis) during two steady codends and two shaking codends are shown in Fig. 6. The amplitudes of two steady codends and two shaking codends are shown in Fig. 7.
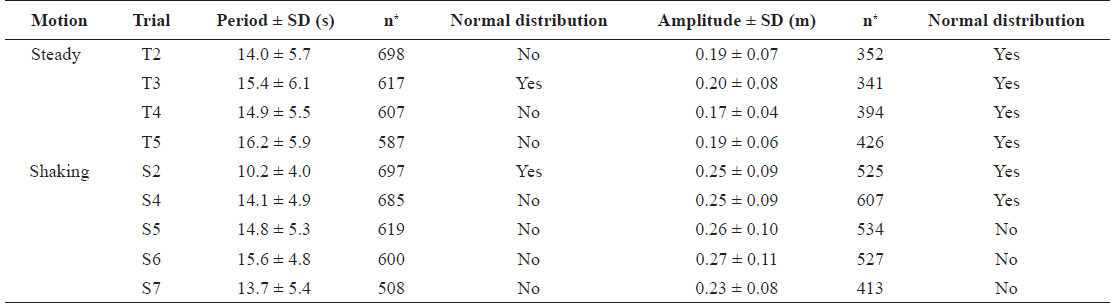
Mean values (± SD) of the shaking periods and amplitudes for each fishing trial (calculated by peak event analysis) are listed in Table 2. The shaking amplitudes with flapping canvas in codends significantly exceeded those of steady codends (

Periods and amplitudes of depth change (calculated by peak event analysis). Values are means ± SD
CPUE estimates for steady and shaking codends are listed in Table 3. The main catch in the codend comprised sea bream, horse mackerel, moonfish, and squid; the main bycatch comprised also juvenile sea bream, horse mackerel, and moonfish, among others. The mean CPUE of 68.0 ± 40.9 kg for the shaking codend exceeded the catch in the steady codend (56.4 ± 46.5 kg), but the difference was not significant (
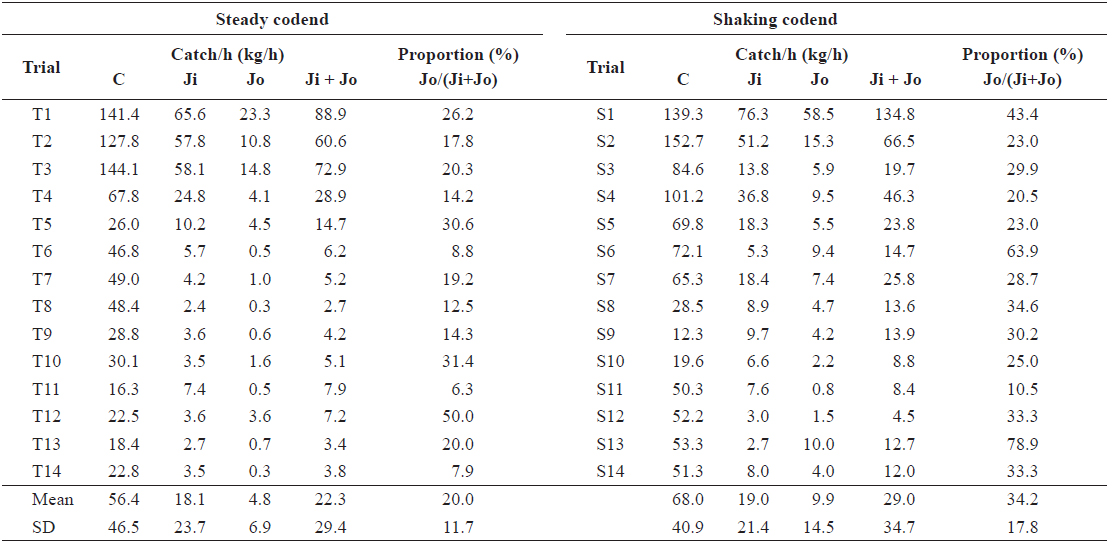
Market catch of fish (C) and bycatch of juvenile fish in the codend (Ji) and in the cover-net (Jo) measured as CPUE (kg/h) in steady and shaking codends
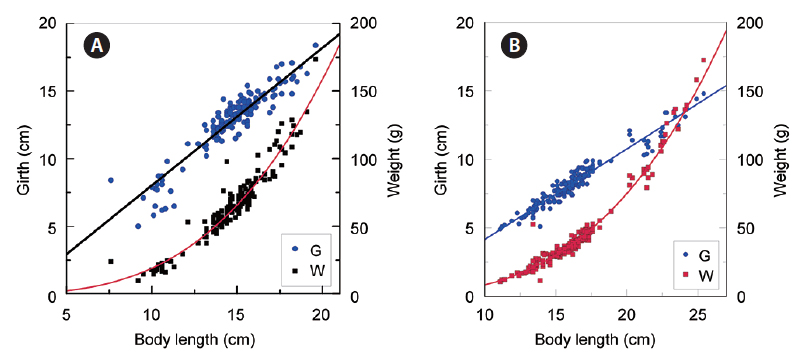
The total body lengths (BL, cm), girths (G, cm) and weights (W, g) of the two main bycatch (juvenile sea bream and horse mackerel) were expressed as follow;.
Sea bream: G = 1.02 BL – 2.16 (n = 164, r = 0.93) W = 0.0163 BL3.07 (n = 164, r = 0.96) Horse mackerel: G = 0.661 BL – 2.47 (n = 191, r = 0.97) W = 0.00565 BL3.17 (n = 191, r = 0.97)
Relationships among these variables are shown in Fig. 8.
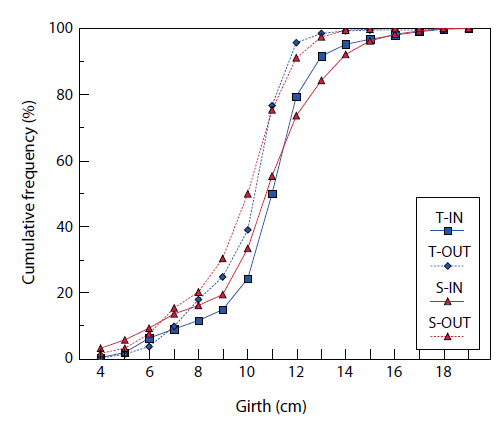
Bycatch selection by the codend mesh was closely related to body girth for both species. The girths of most of the bycatch fish were smaller than the circumference of the codend mesh (18 cm). The thick twine and double panel of the codend may have affected girth selection (Özbilgin and Tosunoğlu, 2003; Sala et al., 2007). The frequencies of girth distribution for the main bycatch in the codend and in the cover-net under steady and shaking are shown in Fig. 9. Girth frequencies were not significantly different between steady and shaking codends, or between codends and covernets (paired t-test;
As in previous trials using a shrimp beam trawl (Kim and Whang, 2014), the flapping canvas in the codend had little effect on fishing operations, although some small fish that escaped from the codend remained trapped between the codend mesh and the canvas. The range of fishing grounds and seasons in this study were large, leading to large variations in catches and species. Unfortunately, this element of variation was unavoidable at the time due to the scheduling of ship time for training voyages. Nevertheless, catch and species composition differences between steady and shaking codends were consistent (Table 3), allowing us to perform CPUE comparisons between the two treatments.
The bycatch reduction in this bottom trawl trial (18%) was nearly 0.6 of that obtained in the shrimp beam trawl trial (30%; Kim and Whang, 2014). The difference between trials may have been related to the amplitudes of codend depth variations. The mean amplitude in this study (0.3 m) was a quarter of the codend height (≈1.2 m); the mean amplitude in the shrimp beam trawl trial (0.4 m) was 40% of the codend height (1 m). The shaking force (i.e., the lifting force of the canvas ; Kim. 2013b) in the current work may have been relatively weak because of the relationship between the size of the flapping canvas and the codend drag. The constructions of the canvas in this bottom trawl as two pieces of semi circular also differed than one circular canvas in the shrimp beam trawl (Kim and Whang, 2014). The bottom trawl codend had a rigid construction based on thick mesh twine and hard wire rigging, whereas the shrimp beam trawl codend used flexible ropes and nets. Further tank experiments are needed to optimize turbulent flow in rigid, elongate codends. Theoretical analyses of turbulent flow in shaking codends are also required. Empirical trials of simple flapping canvas shapes (e.g., the split round type) with simple attachments should be undertaken.