Bats are the most unusual and specialized of all terrestrial mammals. They are the only extant vertebrates apart from birds that are capable of powered flight and, with the exception of Pteropodidae species, have mastered the night skies largely by using echolocation (biosonar) to perceive their surroundings (Griffin, 1958; Thomas et al., 2004). Echolocation calls show a great diversity in form, duration and amplitude, and key characteristics are correlated with the environment in which the bat species generally flies (Jones and Teeling, 2006). Typically, bat species which forage in an open habitat will emit a low-frequency ultrasonic call that will not rapidly attenuate, with a long duration and a narrow-frequency bandwidth. By contrast, bat species foraging in dense vegetation (i.e., a cluttered habitat) will emit short broadband calls, which are suited to localizing prey in clutter (Schnitzler et al., 2003; Jones, 2005). Therefore, describing echolocation call structure can provide insights into the ecology of species that are otherwise difficult to study.
Recently the use of ultrasonic bat detectors to make acoustic surveys of bat activity has been rapidly increasing (e.g., Racey et al., 1998; Loeb and O’Keefe, 2006; Morris et al., 2010; Minderman et al., 2012; Stahlschmidt et al., 2012). Acoustic survey can be especially useful in habitats where capture is generally difficult, such as large open fields and high in the forest canopy (Kunz et al., 2009). Also, acoustic surveys can be carried out at multiple sites simultaneously by using automated recording systems. To conduct such acoustic surveys, however, it is necessary to have a reference collection of calls of known bat species and then reliable methods should be developed to identify the resident species.
The structure of echolocation calls varies, not only between species, but also within species. A variety of factors have been shown to influence call structure, including geographical variation, foraging habitat and foraging mode (Aldridge and Rautenbach, 1987; Norberg and Rayner, 1987; Thomas et al., 1987; Fenton, 1990; Barclay and Brigham, 1991; Obrist, 1995; Barclay et al., 1999). This means that reference calls recorded in a particular region, or in a particular habitat type, may not be applicable to other regions, or to other habitat types. Therefore, as far as possible, echolocation call structure should be described and species identification methods developed for the particular region and habitat type where they are to be used. Numerous previous studies have analyzed and described echolocation call structure of a variety of bat species, although the majority has been done in Europe and North America (e.g., Russo and Jones, 2002; Rydell et al., 2002; Redgwell et al., 2009; Britzke et al., 2011).
The Korean Peninsula is an important area to consider in biogeographical studies of East Asian mammals. At least 21 bat species are known to be distributed in Korea (Yoon, 2010). However, the ecology and behavior of Korean bats are almost unknown, except for some cave- and house-dwelling species (Chung et al., 2009, 2010b, 2011; Kim et al., 2009, 2012). Also, although Chung et al. (2010a, 2010c) have described the echolocation call structure of three Korean bat species, the echolocation call structure of most Korean bat species has not been analyzed or described yet. The aim of this study is to describe the echolocation call structure of 14 of the 21 Korean bat species. In this paper, we compare characteristics of echolocation call structure between species. This is the first study to present an analysis of interspecific differences in echolocation calls of Korean bats.
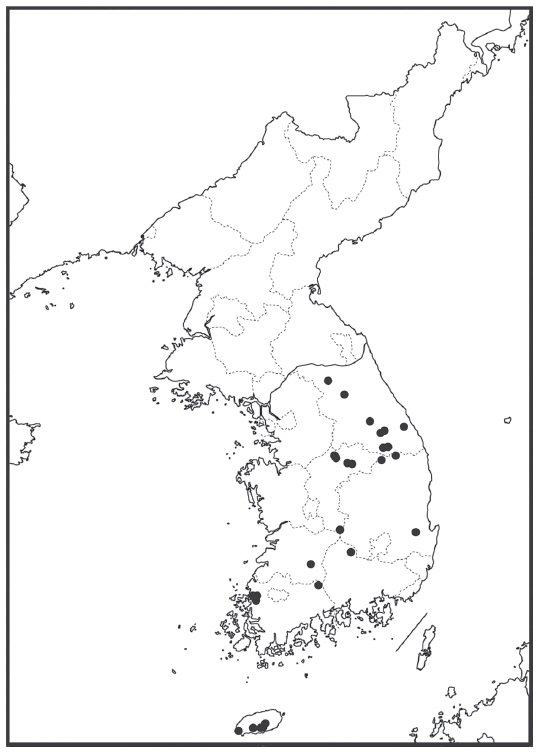
From 2011 to 2012, fourteen species of bats (Eptesicus serotinus, Hypsugo alaschanicus, Miniopterus fuliginosus, Murina leucogaster, Mu. ussuriensis, Myotis aurascens, My. formosus, My. ikonnikovi, My. macrodactylus, My. bombinus, My. petax, Pipistrellus abramus, Plecotus ognevi, and Rhinolophus ferrumequinum) were caught from a range of locations throughout the country (Fig. 1), using mist nets and harp traps in forests, or using a hand net at day or night roosts (caves and houses). After capturing bats, we checked their sex, maturity and reproductive condition, and measured their forearm length using calipers and body weight using a balance. In this study scientific names follow Yoon (2010), except for My. aurascens, My. bombinus, My. petax, H. alaschanicus, Mi. fuliginosus, and P. ognevi. The taxonomic status of Korean small-sized Myotis bats is not well studied. Although My. aurascens is not described in Yoon (2010), we follow Tsytsulina et al. (2012), who have suggested the occurrence of My. aurascens in Korea. Although My. petax had been included in My. daubentonii in Asia, we follow Matveev et al. (2005), who proposed it as a valid species for the “eastern” group of My. daubentonii. Yoon (2010) has described My. nattereri from Korea, but the east Asian population is now considered to be My. bombinus (Simmons, 2005). Although H. (Pipistrellus) alaschanicus had been treated as a subspecies of H. (Pipistrellus) savii, we follow Horácek et al. (2000), who argued that H. alaschanicus from Mongolia, China, the Russian Far East, Korea and Japan, should be recognized as a valid species of the genus Hypsugo (Pipistrellus) and different from H. savii. Although Yoon (2010) treated the bent-winged bat from Korea as Mi. schreibersii, we follow Tian et al. (2004), who proposed the Asian population as a separate species, Mi. fuliginosus. In addition, although P. auritus is described in Yoon (2010), recent genetic and morphological analyses indicate that the Far Eastern population is a distinct species P. ognevi (Spitzenberger et al., 2006).
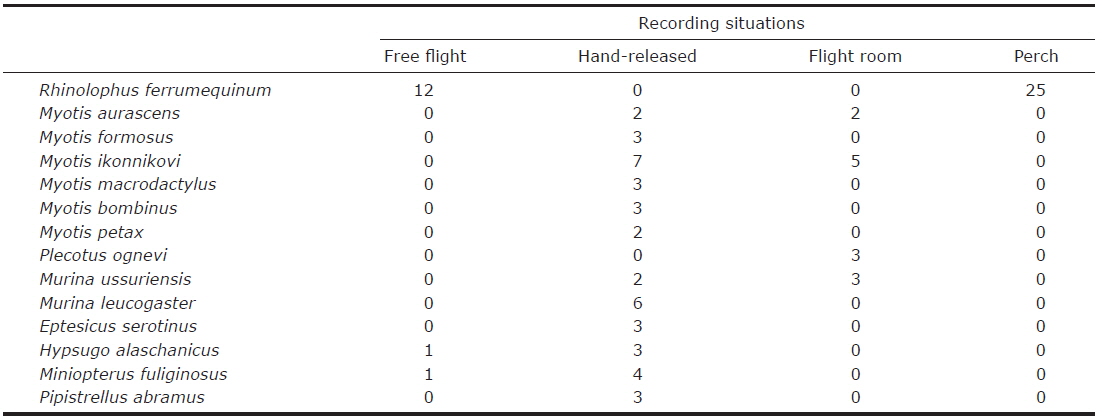
Calls were recorded using a Pettersson D240x bat detector (Pettersson Elektronik AB, Uppsala, Sweden) linked to a solid state recorder (R-05; Roland, Shizuoka, Japan). The D240x was set to time-expansion mode, in which it records 3.4 s of ultrasound, slows the signal down ten times to bring it into the audible range, and plays it back. This technique preserves all characteristics of the original sound and allows accurate measurement of acoustic parameters. The recordings were made in the following four situations. (1) Handrelease: Captured bats except all individuals of Rhinolophus ferrumequinum and some individuals of other species (see below) were released by hand on a forest road (width >5 m) near the point of capture, and the calls produced from 1-2 seconds after release were recorded. Recordings were made with the detector held at the same height as, and about 2 m away from the released bat. (2) Free-flight: If we were able to make positive species identification of flying bats (e.g., checking individuals at a night roost, or individuals that went into mist nets after observed flight), we recorded echolocation calls during their flight. (3) Flight room: Some bats were brought back to the laboratory to be prepared as specimens. Before making specimens, these individuals were released in a flight room (4.7 m length, 3.0 m width, and 2.7 m height) in National Institute of Biological Resources (NIBR), and echolocation calls were recorded during their flight inside the room. (4) Perch: For R. ferrumequinum, perch calls were recorded when the bats hung from the roof of a mesh bag (40 cm square by 40 cm height).
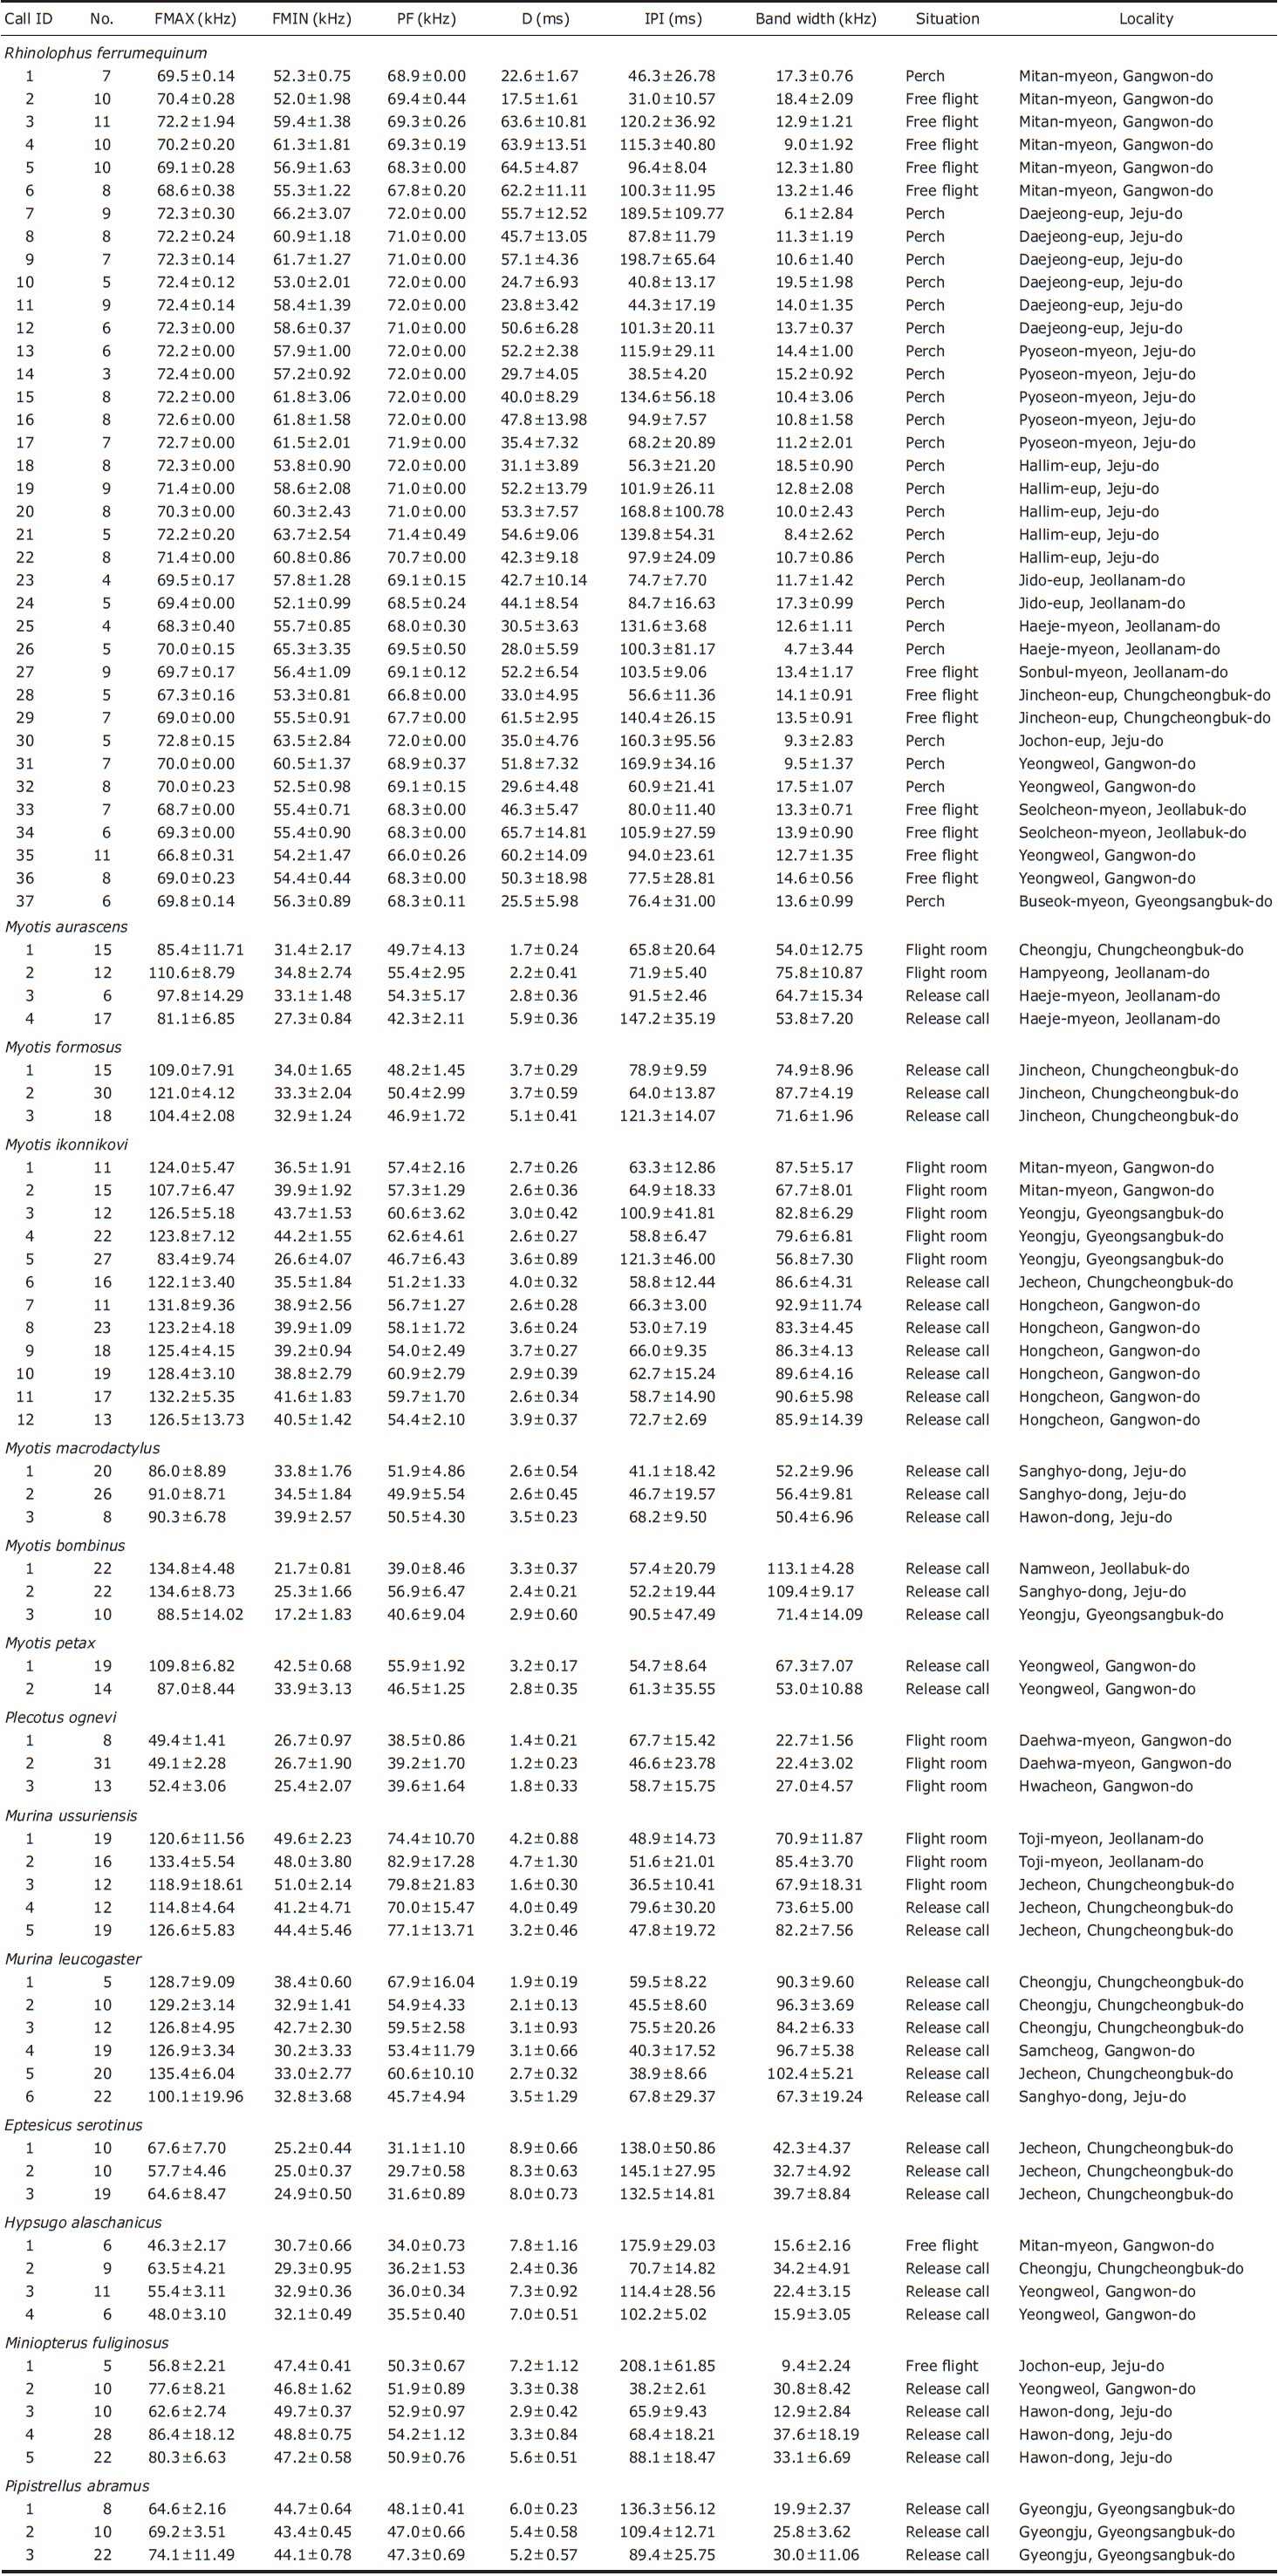
The structure of recorded calls was analyzed using Bat Sound 3.1 software (Pettersson Elektronik AB) with a sampling rate of 44.1 kHz and a Hanning window. Fast Fourier Transform size was 512 for sonograms and power spectra. All pulses in each 3.4 s recorded call (call sequence) were analyzed. We measured the following parameters from each pulse: duration (D), maximum frequency (FMAX, the highest frequency of the pulse), minimum frequency (FMIN, the lowest frequency of the pulse), peak frequency (PF, frequency of maximum energy of the pulse), and interpulse interval (IPI, time from the beginning of measured pulse to the beginning of next pulse). D, FMAX, FMIN, and IPI were measured from spectrograms, and PF from power spectra.
If calls of the species were recorded in more than two situations, the differences in call parameters between recording situations (hand-release, flight room, free flight and perch) were analyzed using linear mixed models (LMMs). In the analyses, the recording situation was the fixed effect, and the call sequence was treated as a random effect to account for potential differences among individuals. A value of p<0.05 was considered statistically significant. Next, we compared the pulse structures between each species by canonical discriminant analysis (CDA) using all five parameters. In the CDA, the last pulse in each call sequence was excluded because it did not have a following call, and therefore there was no IPI (as defined above). All analyses were performed in the R environment for statistical computing (R Development Core Team, 2012) and its extended nlme and MASS packages (Pinheiro et al., 2012).
In total, 93 echolocation call sequences were recorded from 93 individuals of 14 species (Table 1). From these 93 call sequences, 1,129 pulses were analyzed. Descriptive statistics of calls from all species are shown in Appendix 1. Analyzed pulses could be classified into the following three types according to the pulse shape.
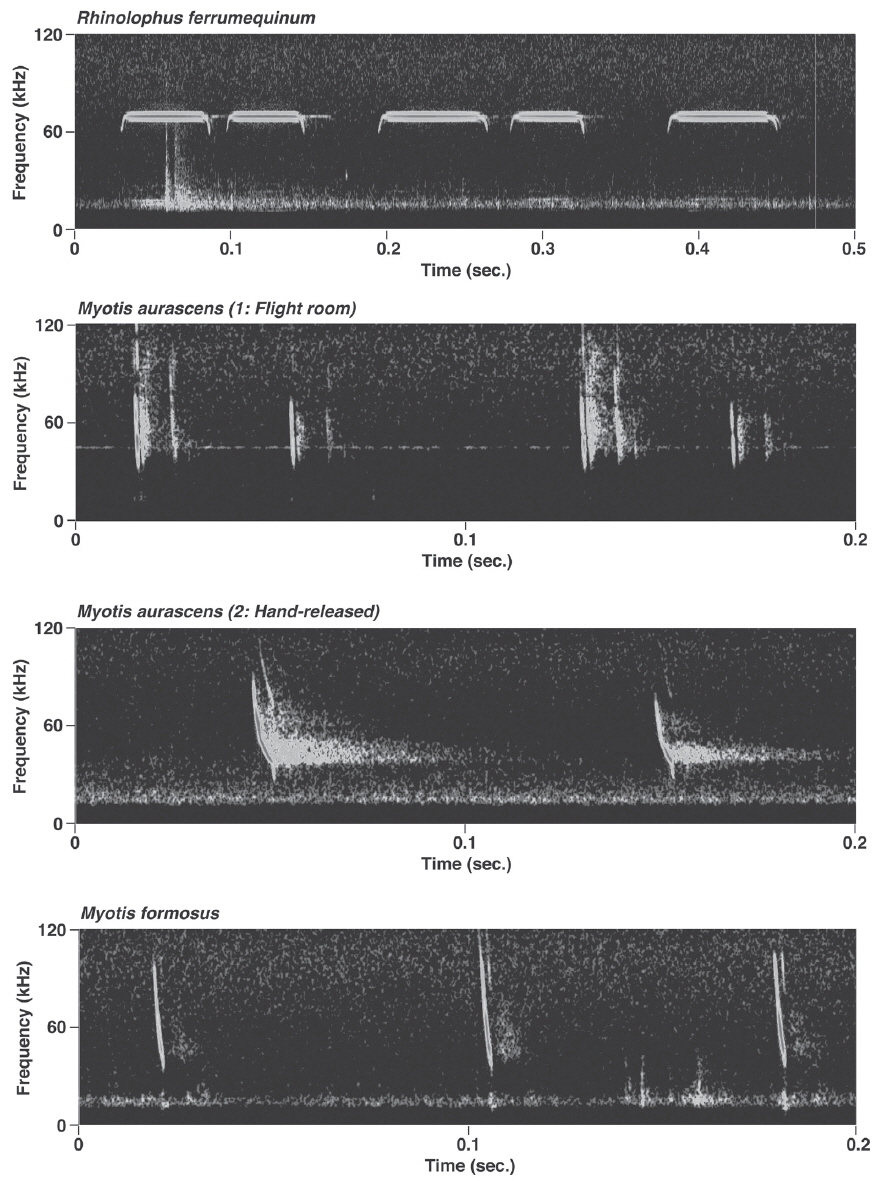
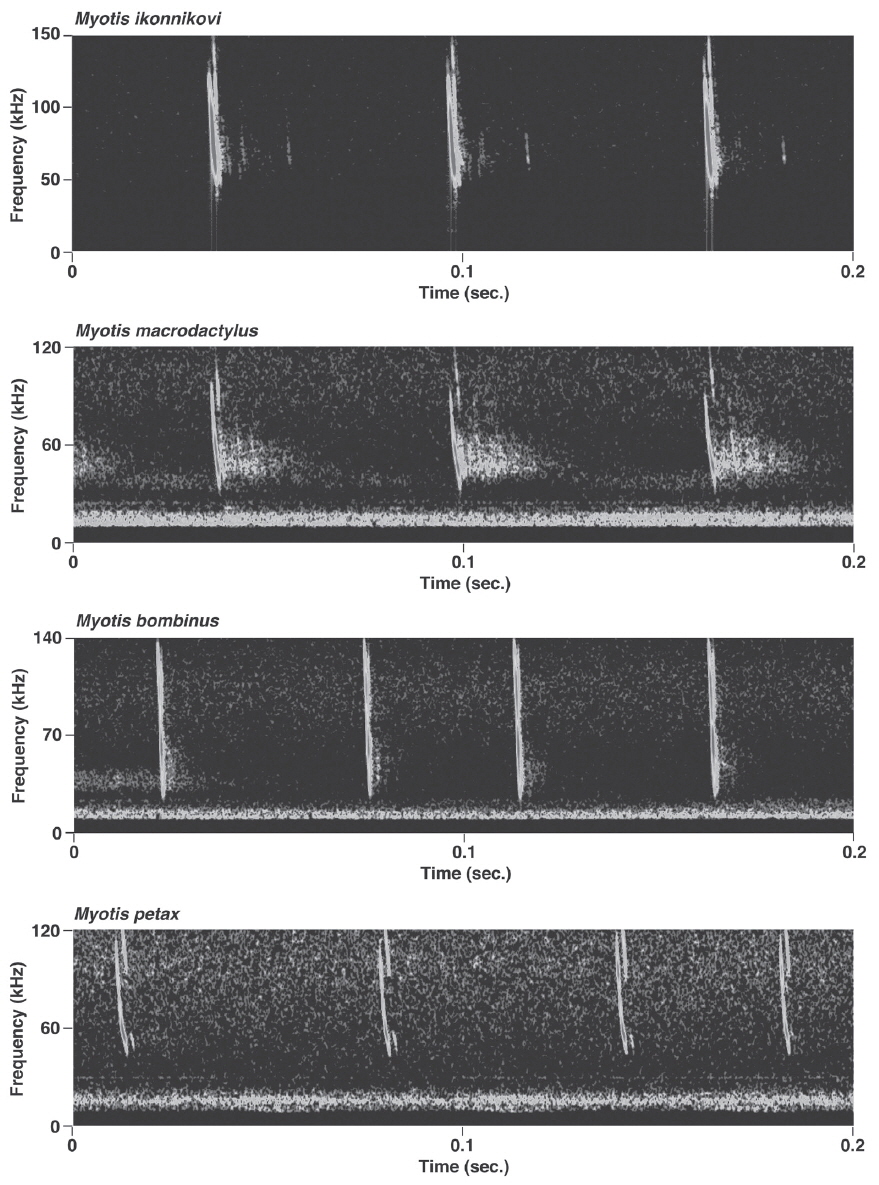
Rhinolophus ferrumequinum produced typical FM/CF/FM echolocation pulses, i.e., pulses with a long, strictly constant-frequency (CF) component preceded and followed by a brief, frequency-modulated (FM) sweep (Fig. 2). Mean bandwidth was 4.7-19.5 kHz. Calls of the individuals from Jeju island had significantly higher FMAX and PF than those from the peninsula (LMMs, FMAX: t= - 9.29, p<0.05; PF: t= - 12.22, p<0.05) (Appendix 1). The only significant difference between the free-flight and perch calls was in D (LMM, t= - 2.51, p=0.02).
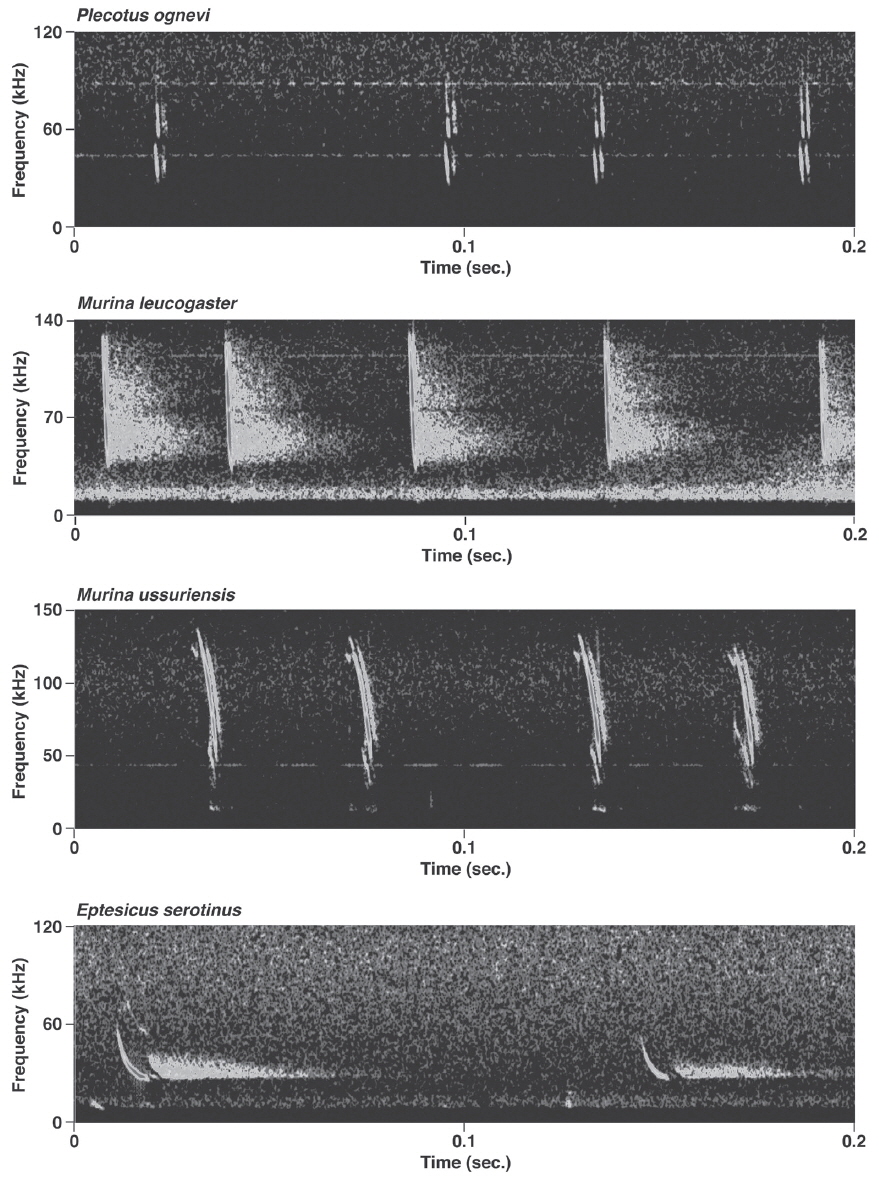
Pulses of nine species of the genera Murina, Myotis, and Plecotus were classified as this call type. All six Myotis species captured in this study had similar mean PF (about 40.0-60.0 kHz (Figs. 2-4, Appendix 1). Pulses emitted by the genus Myotis had broad bandwidth (>50 kHz). Pulses emitted by My. bombinus had particularly broad bandwith (71.4-113.1 kHz) (Fig. 3, Appendix 1) similar to those of genus Murina. My. formosus and My. ikonnikovi also emitted pulses with relatively broader bandwidth (71.6-87.7 kHz and 56.8-92.9 kHz, respectively) (Figs. 2, 3, Appendix 1). D for these species was short (1.7-5.9 ms) but slightly longer than for the genus Murina or Plecotus. For pulses of My. aurascens and My. ikonnikovi, which were recorded in two situations (flight room and hand release), there were no significant differences between situations in any parameter except for bandwidth of My. ikonnikovi (LMM, t=2.27, p=0.047). Plecotus ognevi had the lowest mean PF of the nine FM type species (38.5-39.2 kHz) (Appendix 1). Pulses emitted by this species had shorter bandwidth (22.4-27.0 kHz) and a distinct harmonic (Fig. 4). The mean PF of Murina ussuriensis was the highest among those of the nine FM type species (70.0-82.9 kHz) (Appendix 1). Although it was variable, the mean PF of Murina leucogaster was also relatively higher (45.7-67.9 kHz) than other FM type species (Appendix 1). D for both species was relatively short (1.6-4.7 ms in Mu. ussuriensis and 1.9-3.5 ms in Mu. leucogaster), and bandwidth was broad (67.9-85.4 kHz and 67.3-102.4 kHz, respectively) (Fig. 3, Appendix 1). There were no significant differences in call parameters of Mu. ussuriensis between different recording situations.
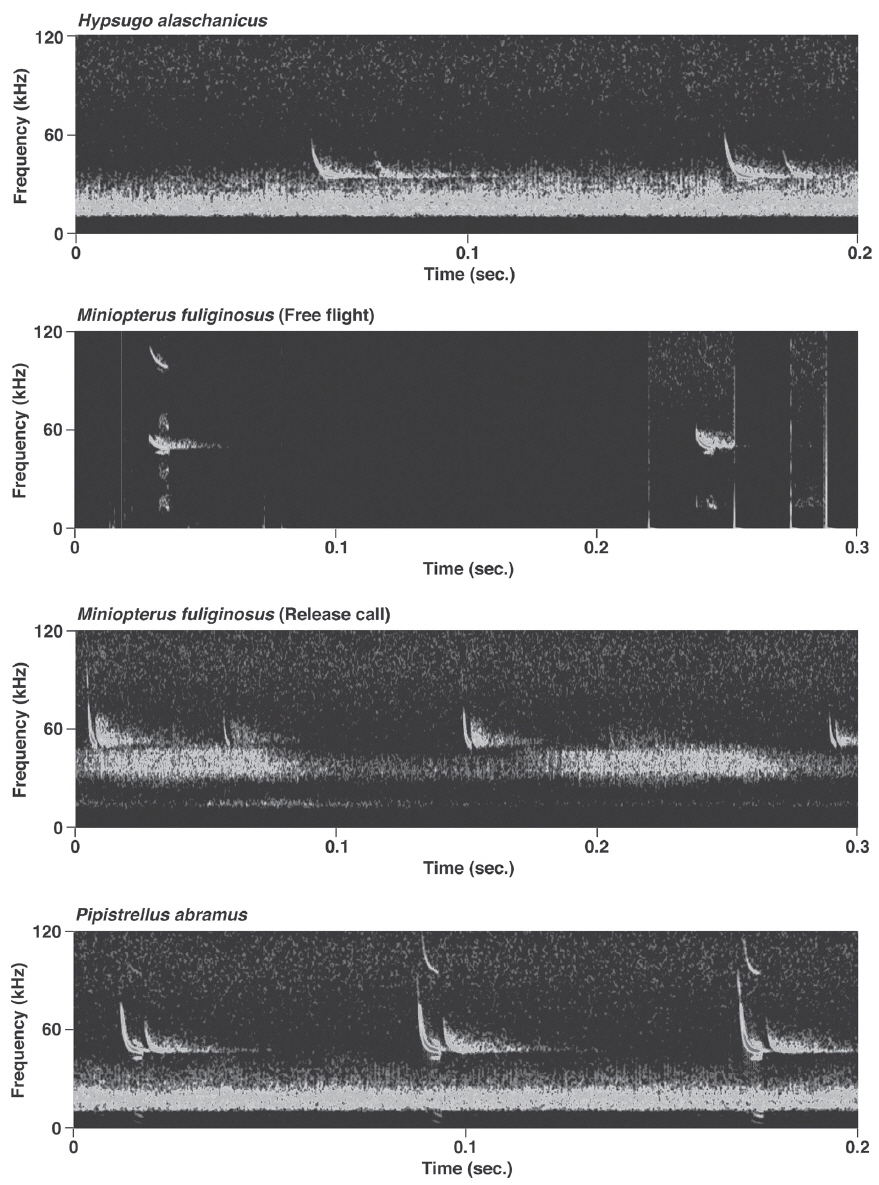
Calls of Eptesicus serotinus, Hypsugo alaschanicus, Miniopterus fuliginosus, and Pipistrellus abramus were all defined as FM/QCF type (Figs. 4, 5). These pulses had two components: they began with steep FM, and moved to shallow FM (quasi-constant frequency, QCF) in the latter part of the pulse. Pulses of these species had relatively longer D and shorter bandwidth than the FM type species. Among these species, pulses of E. serotinus had the lowest mean PFs (29.7-31.6 kHz). D and bandwidth of E. serotinus were 8.0-8.9 ms and 32.7-42.3 kHz, respectively (Appendix 1). H. alaschanicus also had lower mean PFs (34.0-36.2 kHz) than all other species except for E. serotinus. D and bandwidth of H. alaschanicus were 2.4-7.8 ms and 15.6-34.2 kHz, respectively (Appendix 1). Hand-released calls of H. alaschanicus had significantly higher PF than free-flight calls (LMM, t=4.40, p=0.048), whereas there were no differences in other parameters. The mean PFs, Ds, and bandwidths of the pulses from Mi. fuliginosus were 50.3-54.2 kHz, 2.9-7.2 ms, and 9.4-37.6 kHz, respectively (Appendix 1). Free-flight calls of M. fuliginosus had significantly longer D and IPI than hand-released calls (LMMs, D: t= - 3.53, p=0.038; IPI: t= - 6.74, p=0.007). The mean PFs for Pi. abramus were slightly lower than those for Mi. fuliginosus (47.0-48.1 kHz), whereas there were no distinct differences in Ds (5.2-6.0 ms) or bandwidths (19.9-30.0 kHz) (Appendix 1).
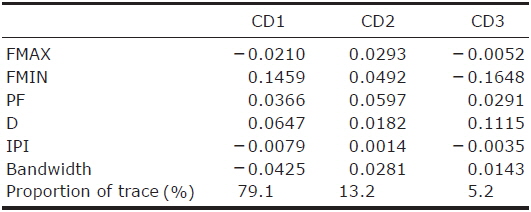
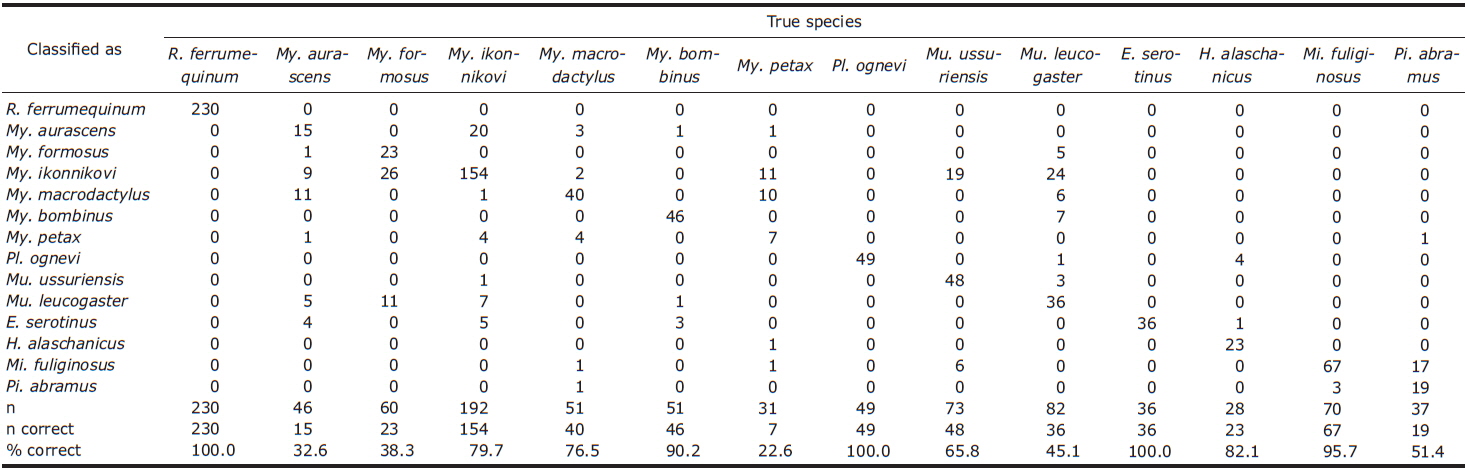
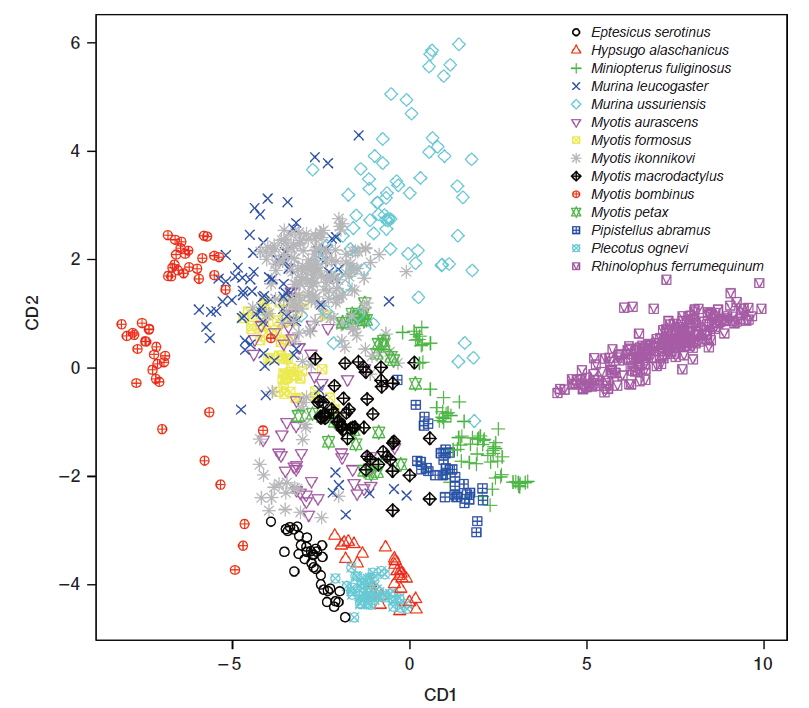
CDA using 5 parameters resulted in 76.4% of 1,036 records of echolocation pulses being correctly classified to one of the 16 species (Table 2). The first 3 discriminant functions explained 97.5% of total variation (Table 3). Pulses from three species (Eptesicus serotinus, Plecotus ognevi, and Rhinolophus ferrumequinum) were all classified correctly, and pulses from Miniopterus fuliginosus and Myotis bombinus were classified with more than 90% accuracy. On the other hand, pulses from My. petax were the least accurately classified (22.6%), and were mainly misclassified as being from My. ikonnikovi and My. macrodactylus. Pulses from Murina leucogaster, My. aurascens and My. formosus were also poorly classified (45.1%, 32.6%, and 38.3%, respectively). In the canonical score plot, the cluster of R. ferrumequinum was distinct from clusters of other species (Fig. 6). There was considerable overlap among the clusters of the Myotis species, although that of My. bombinus was relatively distinct from other species. The clusters of FM/QCF type species had relatively little overlap with each other.
Of the 14 bat species treated in this study, call structures of 11 species were described from Korea for the first time. The pulse parameters measured for each species were generally consistent with those of other studies in surrounding regions, such as China and Japan, whereas some species seem to show geographical variation in pulse parameters.
Rhinolophus ferrumequinum was the only species in this study with FM/CF/FM type calls. The pulse structures of this species have been described previously for other regions (Vaughan et al., 1997; Parsons and Jones, 2000; Russo and Jones, 2002; Huihua et al., 2003; Fukui et al., 2004; Sun et al., 2008), and our results agree with those of a previous study of this species in Korea (Chung et al., 2010c). It is known that PF of R. ferrumequinum shows a geographic cline along which frequency decreases continuously from west to east in its distributional range (Heller and von Helversen, 1989). In East Asia, the PF of this species also decreases from west to east (Beijing-China: 75.1 kHz, Jilin Province-China: 69.6 kHz, Kyushu-Japan: 67-69 kHz, western Honshu-Japan: 67-68 kHz, eastern Honshu-Japan: 65-67 kHz, Hokkaido-Japan: 63-66 kHz) (Huihua et al., 2003; Fukui et al., 2004; Matsumura, 2005; Sun et al., 2008), so shows the same trend at a smaller spatial scale. The PF of this species from the Korean peninsula in this study (67.8-69.5 kHz) (Appendix 1) is consistent with this trend. However, we found that the Jeju population of R. ferrumequinum has distinctively higher PF (72 kHz) (Appendix 1) than populations in surrounding regions such as Kyushu and the Korean Peninsula. This phenomenon may be due to the isolation effect. In fact, the PF of R. ferrumequinum (69-70 kHz) (Matsumura, 2005) from Tsushima island, which is also isolated from the continent and Japanese main islands, is higher than surrounding populations. Yoshino et al. (2008) revealed that restricted dispersal of females causes echolocation call frequency variation within rhinolophid bats between regions because the CF component is determined by mother-offspring transmission. Further phylogenetic analysis in east Asia is needed to confirm the isolation effect.
Pulse characteristics of all six Myotis species were typical FM calls that have been described for Myotis species by previous studies (e.g., Russo and Jones, 2002). Our results suggest that all Myotis species in this study seem to be “narrow space gleaning foragers” or “edge space aerial/trawling foragers”, following the call categorisation described by Schnitzler et al. (2003). In fact, all individuals of Myotis were caught at the forest edge or interior, and we had frequently observed “Myotis-like” bats flying above water surfaces (D. Fukui, personal observation). Of the six species, pulse structures of five (My. formosus, My. ikonnikovi, My. macrodactylus, My. bombinus, and My. petax) have been described in previous studies (e.g., Fukui et al., 2004, 2007; Sun et al., 2008), and our results are all consistent with these studies. However, we cannot assess geographical variation for Myotis species because measured parameters of these species showed large intra-specific variation (Appendix 1), as has been noted by other studies (Fukui et al., 2004; Obrist et al., 2004).
Pulse characteristics of Plecotus ognevi were similar to those of Pl. auritus from Europe, and of other Plecotus species. The PFs for Pl. ognevi in this study were 38.5-39.6 kHz (Appendix 1), whereas those of Pl. auritus from British, Swiss and Italian populations are 29.9, 37.7, 33.1 kHz, respectively (Parsons and Jones, 2000; Russo and Jones, 2002; Obrist et al., 2004). In Japan, the mean PF of Pl. sacrimontis, which was treated as Pl. auritus before Spitzenberger et al. (2006), is 36.7 kHz (Fukui et al., 2007). Recent genetic and morphological analyses indicate that the east Asian populations should be divided into several species, and the Korean population is considered to be Pl. ognevi (Spitzenberger et al., 2006). Thus, this variation in mean PF may represent inter-specific variation, although recording situation may also have influenced the results.
Pulse characteristics of both Murina species in this study were similar to those described for three Murina species in Malaysia (Kingston et al., 1999) and two in Japan (Fukui et al., 2004). Short, broad-band and low intensity FM calls are thought to be used for the detection of arthropod prey in clutter (Simmons et al., 1979; Neuweiler, 1989; Schnitzler et al., 2003). Echolocation calls of Murina in this study area would be suitable for highly cluttered forest understory. Almost all individuals in this study were caught inside forests (D. Fukui, personal observation). As with the genus Myotis, it is difficult to compare between populations because of large intra-specific variation in the measured parameters.
Pulse structures of four FM/QCF type species in this study were also consistent with previous studies, which have described pulse structures of these species in other regions. Although pulse frequencies of Hypsugo alaschanicus and Pipistrellus abramus were similar to those of Japanese populations (PF of H. alaschanicus: 33.9-36.4 kHz, mean PF of Pi. abramus: 46.9 kHz) (Fukui et al., 2002, 2013), the other two species seem to show variation between studies. For example, PF of Eptesicus serotinus varies with regions (U.K.: 33.6 kHz, Switzerland: 26.8 kHz, Italy: 29.9 kHz, Greece: 31.7 kHz) (Parsons and Jones, 2000; Russo and Jones, 2002; Obrist et al., 2004; Papadatou et al., 2008). Also, the PF of Miniopterus fuliginosus was different from that of Japanese Mi. fuliginosus (47.2-49.8 kHz) (Funakoshi, 2010). It is possible that there are geographic variations in the pulse frequency. We cannot determine the extent to which these differences represent geographic variation, however, because recording conditions may have varied between studies. It is known that echolocation pulse parameters change with flying situation (Schnitzler and Kalko, 2001), and our results showed differences in some pulse parameters of H. alaschanicus and Mi. fuliginosus between recording situations. To reveal geographic variations in the calls of FM/QCF and FM type species, we would need to compare calls of each population that were recorded under the same conditions.
In this study, the overall classification rate provided by the CDA was similar to or lower than previous studies where discriminant analysis was applied (e.g., Parsons and Jones, 2000; Russo and Jones, 2002; Fukui et al., 2004; Papadatou et al., 2008). This result may have been caused by low classification rates of FM type species, apart from Myotis bombinus, whose calls are identifiable because of their broad bandwidth. Generally, echolocation calls from most Myotis and Murina species show similar pulse structures and large overlap in spectral and temporal parameters (Vaughan et al., 1997; Russo and Jones, 2002; Hughes et al., 2011). Eight of the 14 species in this study were Myotis or Murina species. On the other hand, the CDA showed relatively high classification rates for the FM/QCF type species, except for Pipistrellus abramus. Previous studies have also shown high classification rates on the FM/QCF type species (Parsons and Jones, 2000; Russo and Jones, 2002; Papadatou et al., 2008; Hughes et al., 2011). This may be related to the QCF component in the pulse. In general, the QCF component seems to be less variable than the FM component in spectral parameters. Coefficients of first canonical discriminants indicate that the most important variable in the model was FMIN, which is measured from the QCF component of the FM/QCF type pulse. Our results indicate that acoustic monitoring in Korea may be a powerful tool to assess bat activity, including identification to species, at least for the four FM/QCF and one FM/CF/FM species.
This study reveals echolocation call structures of the 14 Korean bat species and those of 11 species are described from Korea for the first time. Patterns of habitat use and foraging behavior of bats have been interpreted in terms of the structure of echolocation calls. In theory, it should be possible to predict the kinds of habitat that each species in a bat community is likely to be associated with on the basis of these characteristics. Such predictions could then be used to develop plans for conservation management that would enhance habitats for bats. In this study calls of seven additional species that have been recorded in Korea could not be investigated. To understand feeding habitats of Korean bats and make a more accurate and comprehensive acoustic identification model, larger sample sizes are needed.