Shallow wetlands tend to be heterogeneous areas with varying degrees of structural complexity, forming a mosaic of different microhabitats (Chick and McIvor 1994). Shallow wetlands exhibit substantial variation in water depth, wave action and turbulence, water temperature, bottom substrate, density of macrophytes, and the presence or absence of other natural or artificial structures, such as trees, woody debris, stones, and landing stages. In particular, aquatic macrophytes play an important structuring role in freshwater ecosystems (Meerhoff et al. 2007) and have been identified as a factor that causes variation in trophic cascades (Timms and Moss 1984). Some authors have suggested that aquatic macrophytes influence the spatial distribution of various aquatic organisms, such as phytoplankton, zooplankton, and fish (Lauridsen and Lodge 1996, Schindler 1999, Van Donk and van de Bund 2002), in addition to mediating trophic interactions (Piana et al. 2006, Jeppesen et al. 2007). Plants with dissected leaves are often complex (owing to the high ratio of surface area to plant mass), with this complexity possibly increasing the number of microhabitats and overall niche space for associated animals (Warfe and Barmuta 2004, Hansen et al. 2011).
Most previous studies on the interaction between aquatic macrophytes and animals have focused on how aquatic macrophytes influence zooplankton (Jeppesen et al. 1994 and 2004). Because freshwater zooplankton are frequently utilized as major food items for predators, such as fish and macro-invertebrates, macrophytes provide a refuge for zooplankton to avoid predators. The function of aquatic macrophytes as a zooplankton habitat is determined by the number of individuals, morphology, and arrangement of plant species (Lillie and Budd 1992). The colonization of different macrophyte species with different morphologies generates more complex habitat structures in the water, resulting in macrophytes supporting a higher assemblage of zooplankton (Dudley 1988). In particular, submerged macrophytes generally increase the physical complexity of aquatic environments and provide a suitable habitat for colonization by zooplankton (Meerhoff et al. 2003). Furthermore, vegetated beds dominated by submerged macrophytes strongly decrease the foraging activity of planktivorous fish, which are the main predators of zooplankton (Padial et al. 2009), and contribute to the population growth of zooplankton. Among zooplankton species, however, epiphytic species were hard to observe in submerged macrophyte beds, and submerged macrophytes were frequently utilized by mainly pelagic species (i.e., daphniid).
Macrophytes frequently dominate shallow water ecosystems, with the diversity of zooplankton being largely affected by the presence of plant-attached species (i.e., epiphytic species; Gyllström et al. 2005, KuczyńskaKippen and Nagengast 2006). Some epiphytic zooplankton species often reside on free-floating and/or floatingleaved macrophytes (Moss et al. 1998, Choi et al. 2014a); however, the pattern of macrophyte utilization by this group remains unclear, with their abundance often being underestimated. Previous research on epiphytic zooplankton distribution has focused on explaining the causal relationships among macrophytes, epiphytic species, and other environmental factors (such as predation and food availability), indicating the importance of macrophyte type.
The main purpose of our study was to elucidate how microhabitat heterogeneity influences different zoo-plankton groups (epiphytic versus pelagic). To test this objective, we surveyed 40 lentic ecosystems in South Korea, and combined the physicochemical parameters of water, macrophytes, and zooplankton assemblages in the self-organizing map (SOM) model to identify any relationships of interest. We expected that biomass and the species number of macrophyte to positively influence the abundance of zooplankton and species composition of the community. Based on the SOM results, we discussed ecological relevance associated with the interaction between aquatic macrophytes and the zooplankton community.
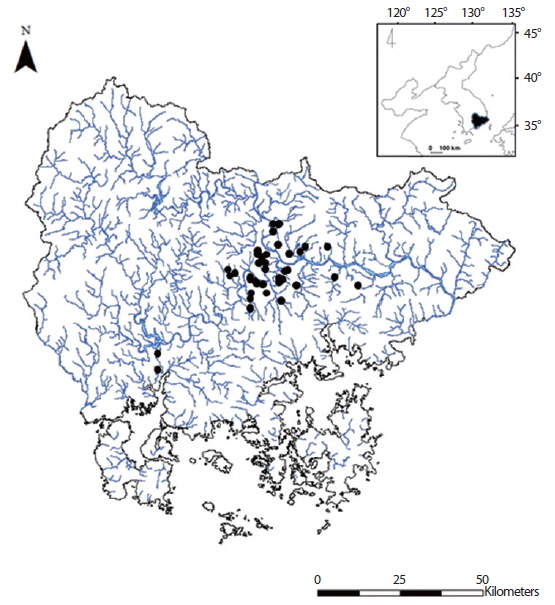
South Korea is located in the East Asian region, and has a temperate climate with four distinct seasons. The annual average rainfall after the 1980s is approximately 1150 mm based on the Korea meteorological agency (www.kma.go.kr). Freshwater ecosystems in this country experience the maximum rainfall in summer (more than 60% of annual rainfall occurs from June to early September; Jeong et al. 2007). The wetlands monitored in this study are located in the southeast of Korea, in the mid-lower reaches of the Nakdong River. Historically, there were numerous wetlands in this area (Son and Jeon 2003), but large areas of wetlands have vanished due to the expansion of human society. We investigated 40 shallow wetlands to determine how environmental parameters influence zooplankton (Fig. 1). We created two criteria to select the study sites: (1) the average water depth of a study site should not exceed 2 m, and (2) the surface area of the study site must be covered more than 60% by aquatic macrophytes. The studied wetlands ranged from 1517 to 3684 m2 in size, while the water depth ranged from 0.5 to 0.9 m. Most of the wetlands were used as a water supply for agriculture at the time this study was conducted.
We monitored the study sites from May to June 2009 before the onset of summer monsoons and rainfall (July to August). We established 3 sampling locations in the littoral area of each site. At each sampling point, 3 quadrats (1 m × 1 m) were used to investigate environmental parameters, macrophytes, and zooplankton.
Water depth, water temperature, dissolved oxygen, conductivity, pH, turbidity, and chlorophyll a were measured at each study site. Water depth was measured using a depth finder in each wetland. We used a dissolved oxygen (DO) meter (Model YSI 58; YSI Research Inc., Yellow Springs, OH, USA) to measure the water temperature and dissolved oxygen. Conductivity was measured using a conductivity meter (Fisher conductivity meter model 152; Fisher Instrument Co., Pittsburg, PA, USA). Chlorophyll a concentrations and turbidity of the water were measured three times in the laboratory. Turbidity was measured using a turbidimeter (Model 100B; HF Scientific, Inc., Fort Myers, FL, USA). The water samples were filtered through a mixed cellulose Ester (MCE) membrane filter (Model No. A045A047A, pore size, 0.45 µm; Advantech MFS Inc., Dublin, CA, USA), and chlorophyll a concentration was detected based on the methods of Wetzel and Likens (2000). Each wetland area was measured using ESRI ArcGIS ver. 9.3 (ESRI Inc., Redlands, CA, USA) and a digital map from the National Geographic Information Institute (http:// www.ngii.go.kr), with a scale of 1 to 25,000. The fishing factor was evaluated as the presence and absence of fisherman when we investigated the study sites. In order to accurately investigate the fishing factor, we interviewed local residents about the presence or absence of fisherman near the sites, and searched for traces of fisherman based on direct observation.
For the zooplankton collection, we collected water samples using a column sampler (10 L, 6.3 cm radius, 80 cm height). The sampler was placed vertically in the water to collect zooplankton from the entire water column of a quadrat. The water was filtered through a plankton net (68 µm mesh size), and the filtrate was preserved in formaldehyde (final concentration: ca. 5%). The zooplankton were identified and counted using a microscope (Axioskop 40; Carl Zeiss, Oberkochen, Germany), based on the classification key by Mizuno and Takahashi (1991).
After the zooplankton collection, we identified all species of macrophytes within each quadrat. All macrophytes in each quadrat were collected to estimate the dry weight. Only the submerged parts of the macrophytes were used for the dry weight measurement. The stalks above the water surface were removed. The collected macrophyte samples were dried at 60℃ for 48 h, and weighed using an electronic microbalance (Model AE 240; Mettler Toledo Group, Greifensee, Switerzerland).
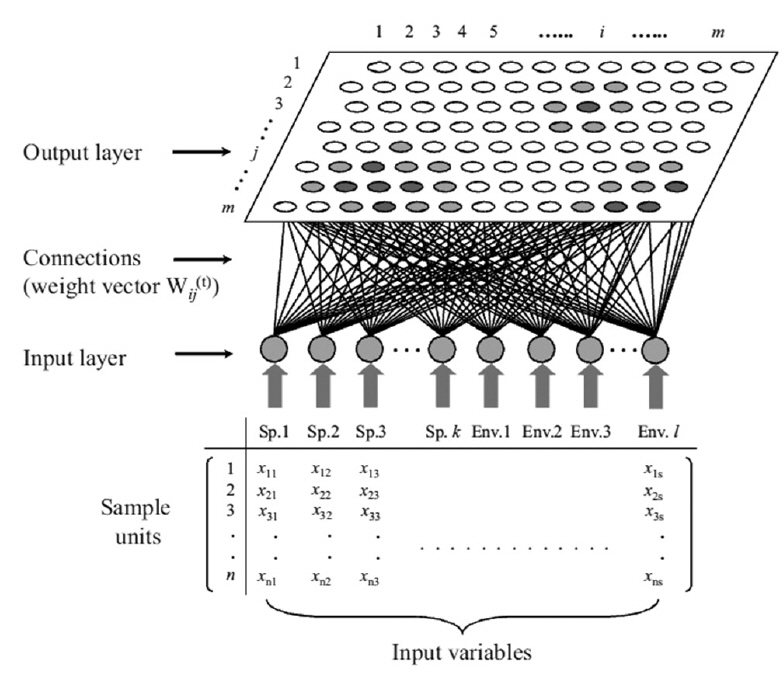
The self-organizing map (SOM) originates from the Kohonen network (Kohonen 1982, 1997), which is an unsupervised learning algorithm of artificial neural network. This network mimics the intellectual functioning of higher animal brains. The SOM is widely used as a tool for mapping high-dimensional data into a two-dimensional representational space (Kohonen 1982). This type of mapping effectively retains the relationship between the input data; thus, a topology preserving representation of input similarities is described in terms of distances in the output space (Fig. 2). Therefore, it is possible to identify clusters on the map visually. The main advantage of this type of mapping is the ease with which a user may interpret the relationship between data.
The potential of using such neural networks in ecosystem simulations was first suggested by Odum (1994), who hypothesized that it may be useful for understanding life systems, including many aspects of ecology (Odum 1994). The SOM network is a competitive system in which the neurons (i.e., sample units) in the Euclidean map space compete with one another, converting non-linear relationships into simple geometric relationships. This algorithm is effective at clustering and visualizing essential features of complex data, and has a unique structure that allows multivariate data to be projected nonlinearly onto a rectangular grid layout with a rectangular or hexagonal lattice (Fig. 3).
Once the data set is trained, the approximation of x means finding this centroid vector (the so-called winning neuron), mc, which is the best fit in the input space. During the learning process (i.e., data training), the neurons activate each other to learn something from the same input. Every node of the output layer, j, was connected to each node in the input layer, i. A hexagonal array of neurons was selected (Fig. 2). The weight vector, w(t), representing the connection between input and output layers, consisted of a weight value, wij(t), and was adaptively changed at each iteration, t, as training proceeded. In the initial stage of training, w(t) was randomly and uniformly distributed in the network architecture. The winning neuron and its neighborhoods learn by updating the model by reducing the distance between the model and input vectors. The following equation is used for this purpose:

where
In this study, the identified zooplankton groups were used as input variables in the SOM. Zooplankton species that accounted for more than 5% of total zooplankton abundance were included. Further, to compare the influence of environmental parameters on the habitat characteristics of zooplankton, we classified the zooplankton species into 2 habitat groups (pelagic and epiphytic) according to Sakuma et al. (2002), Gyllström et al. (2005) and Choi et al. (2012b). The Appendix Table summarizes the information about the habitat groups based on the aforementioned references. We applied the following criteria: (1) if a genus is identified as either “pelagic” (the term “planktonic” was replaced with “pelagic” in the current version) or “epiphytic” in all three references, then the genus was identified accordingly, and (2) if a genus is differently identified (e.g., one reference indicates the genus as pelagic, but the others as epiphytic; or more than one reference indicates the genus as “ambiguous”), then we identified the genus as “ambiguous”. During the training process, a number of nodes that the SOM plane consisted of were determined as being adjacent to 5*sqrt(
[Appendix.] Division of rotifer genera into different habitat groups
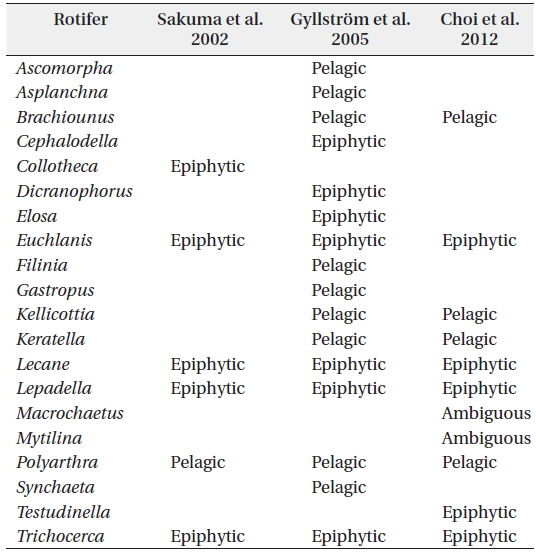
Division of rotifer genera into different habitat groups
>
Biological factors and regression analysis
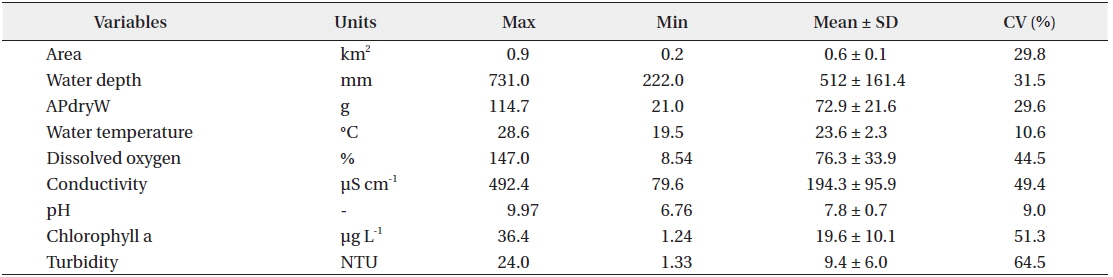
There was relatively little difference in the environmental characteristics of water among the study sites (Table 1). While some study sites had exceptionally high or low values, the coefficients of variation (CV; standard deviation/mean × 100%) were lower than 100%. Among the environmental characteristics, turbidity had the highest CV; however, the variation was just approximately 64%.

Mean macrophyte dry weights and environmental parameters measured at the study sites (n=40 for each variable)
There were differences in both the composition and dry weight of macrophyte species among study sites. Among the total of 14 species of macrophytes found (
>
Classification of various features by SOM
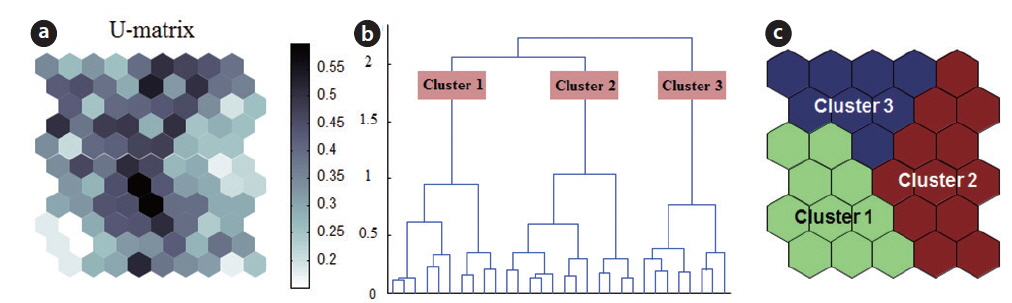
The SOM model was adaptively fitted to the input data (quantization error = 0.739; topographic error = 0.02). The optimal structure of the SOM model consisted of 30 hexagonal cellular planes (5 × 6 matrix; Fig. 3). The U-matrix (Fig. 3a) and distance among nodes (Fig. 3b) delineated a total of 3 distinctive clusters. The characteristics of each input variable in each cluster are summarized in Table 2, which presents the mean values of each variable.
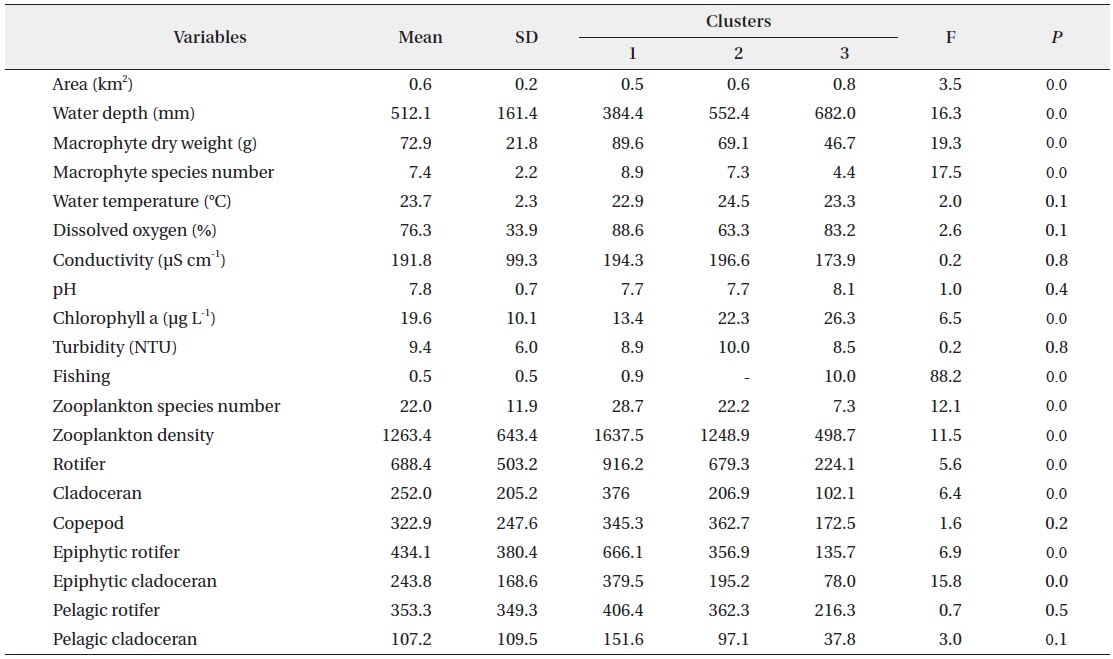
Data configuration for the self-organizing map and input variable means for each of the clusters.
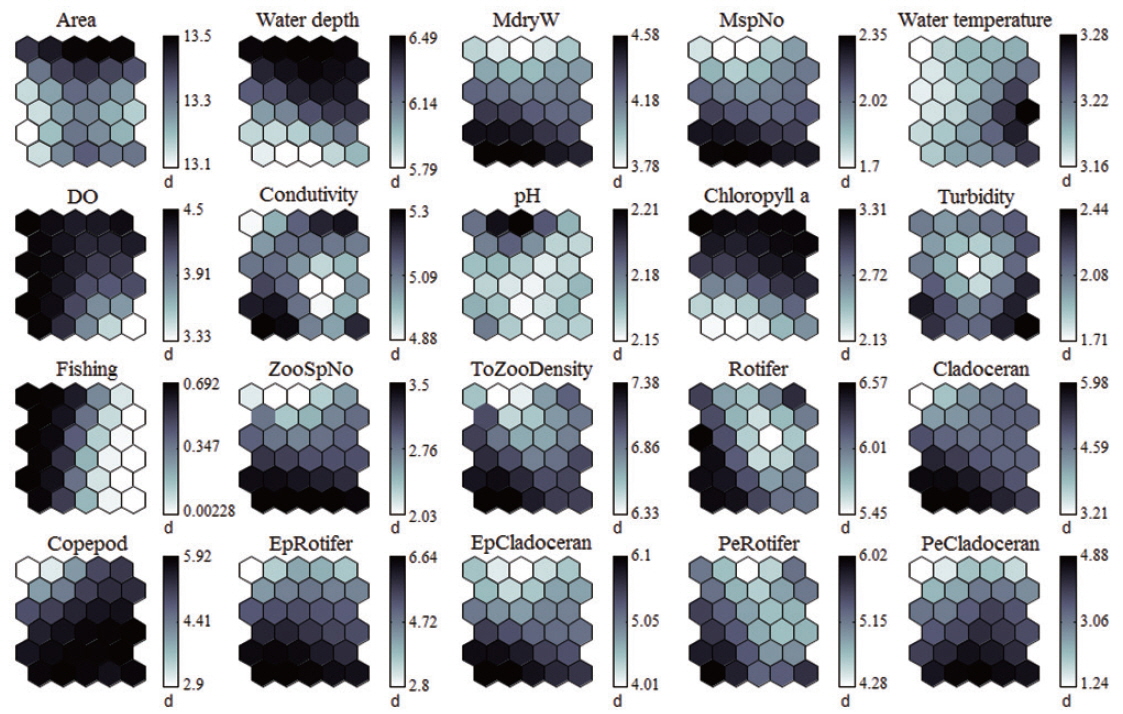
Each environmental parameter and zooplankton group exhibited different shapes and gradients on the map plane (Fig. 4). The gradients of environmental parameters on the map plane were helpful for interpreting how environmental parameters influence the zooplankton groups. Among the environmental parameters, wetland area, water depth, pH, and chlorophyll a were mainly located in the upper part of the map (cluster 3 and partly cluster 2), whereas macrophyte group (dry weight and species number) patterns were located in the lower part of the map. High water temperatures were mostly grouped in cluster 2, whereas low water temperatures were grouped in cluster 1 and 3. In contrast, DO was higher in most of the clusters, except where high water temperatures were located in the map. High fishing levels were located on the left part of the map. Conductivity and turbidity were randomly distributed on the map. Among the zooplankton groups, zooplanktons, rotifers, cladocerans, epiphytic cladocerans, and pelagic rotifers were mainly distributed on the lower-left part of the map (cluster 1). The high number of zooplankton, epiphytic cladoceran, and pelagic cladoceran species was also mainly located on the lower part of the map (in both cluster 1 and cluster 2). The zooplankton groups tended to be positively correlated with dry weight and the number of macrophyte species. However, high copepod density was present in most parts of the map, except the upper-left section.
The sites belonging to cluster 1 were dominated by high macrophyte dry weight and species number, high levels of dissolved oxygen, and a very high abundance of zooplankton groups. In particular, the cluster contained the highest density of zooplankton, with rotifers, cladocerans, epiphytic rotifers, epiphytic cladocerans, and pelagic rotifers. The sites belonging to cluster 2 were characterized by high water temperature. Cluster 2 belonged to an intermediate zone (i.e., middle). This cluster had the second highest abundance of zooplankton groups. In particular, copepod numbers were high, with some sites containing high numbers of zooplankton species, high epiphytic cladoceran density, and high pelagic cladoceran density. Sites belonging to cluster 3 had high values of wetland area, water depth, and pH. However, this group was characterized by low numbers of macrophyte groups and low water temperature. This cluster contained the lowest number of zooplankton groups. Thus, macrophyte characteristics (dry weight and species number) strongly related to the abundance and species diversity of zooplankton (in particular, epiphytic species).
>
Effectiveness in visualization of ecological patterns by the SOM
The SOM is one of the most popular non-linear data ordination processes available. It extracts information from multi-dimensional data and maps it onto a reduced dimensional space (Kohonen 1997). Dealing with diverse and complex ecological data requires handling of datasets with high dimensionality. Dimension reduction of the data is beneficial in efficient analysis and elucidation. Progressive advance in ecological data collection and automation will accelerate, producing a large supply of data. Conventionally, statistical ordination or clustering methods have been adopted for such datasets. Compared to principal component and correspondence analyses, the SOM has been recognized as one of the most powerful and applicable methods available in recent ecological research, because it is easy to visually interpret information (Chon et al. 1996). Giraudel and Lek (2001) compared some classical statistical techniques with the SOM, and recommended it as not only a new visual way of finding structures in ecological communities, but also an exploratory approach in which unexpected structures might be discovered.
>
Clustering characterization of the SOM network
Previous studies have suggested that microhabitat (i.e., macrophytes) has a significant influence on zooplankton assemblage (Jeppesen et al. 1998, Van Donk and van de Bund 2002, Choi et al. 2014c). The researcher reported that morphological characteristics of macrophytes determine the distribution of microcrustaceans (Kuczyńska-Kippen and Nagengast 2006). In this regard, one major apparent role in aquatic ecosystems is the construction of a heterogeneous mosaic of niches at different scales through (1) provision of refuge against predators and suitable spawning and foraging substrates (Warfe and Barmuta 2004), and (2) mediation of trophic interactions among various biotas (Jeppesen et al. 1998, Piana et al. 2006). However, these studies have been conducted using a limited number of zooplankton groups (i.e., total zooplankton or rotifers, cladocerans, and copepods). The present study used a SOM model to cluster the field-surveyed data, demonstrating a clear relationship between environmental parameters and zooplankton groups.
Even though previous studies have suggested a clear relationship between physicochemical parameters and zooplankton communities over time (Dejen et al. 2004), we found that most environmental parameters (e.g., water temperature, dissolved oxygen, conductivity, pH, and turbidity) were not significantly related to the distribution of zooplankton. These parameters were evenly distributed on the trained SOM plane, which indicates that they were not correlated with well-clustered zooplankton patterns. Some studies suggested that physicochemical factors such as water temperature are important to determine seasonal distribution of zooplankton (Islam 2007, Choi et al. 2012a). In temperate regions, environmental parameters in the water body change with the season (Jenkerson and Hickman 1983, Charkhabi and Sakizadeh 2006). However, the current study is a “snapshot” approach to elucidate the role of macrophytes as zooplankton microhabitats. Therefore, we considered that zooplankton largely affected habitat heterogeneity than water physico-chemistry. Among environmental parameters, water depth and chlorophyll a negatively related to zooplankton groups. Light may penetrate to the bottom layer in shallow wetlands and improve the development and growth of photosynthetic organisms such as macrophytes and phytoplankton. Although excessive dominance of macrophyte in the water surface may reduce light penetration in the water (shading effect; Sand-Jensen and Søndergaard 1981), it increased the edible food source of the zooplankton community. Phytoplankton competed with free-floating plants on the surface area, especially for nutrients (Van Donk and van de Bund 2002) and prevented excessive dominance of some phytoplankton species (e.g., inedible food for zooplankton). Consequently, we suggest that shallow wetlands are directly regulated by macrophytes and indirectly regulated by water physicochemistry.
>
Influence of macrophytes on zooplankton
The study sites with high dry weight and high numbers of macrophyte species supported a high abundance and species diversity of zooplankton. Empirical studies have shown that freshwater macrophytes provide suitable habitats for zooplankton (Estlander et al. 2009). Moreover, high macrophyte biomass largely contributes to complexity of the habitat structure in water (Manatunge et al. 2000, Meerhoff et al. 2007). In this study, we found that high macrophyte biomass (i.e., dry weight) supported more zooplankton with higher species diversity. Among the zooplankton community, rotifers and cladocerans were positively related to macrophyte dry weight and the number of macrophyte species. High copepod densities were recorded in wetlands with both low and high macrophyte biomass. Rotifers and cladocerans are the main food source of aquatic predators, such as fish; thus, these species frequently use macrophyte habitats as refuge to avoid predators (Kuczyńska-Kippen and Nagengast 2006). Furthermore, epiphytic species need to attach to substrates, such as underwater stems or leaf surfaces (Choi et al. 2014b). Therefore, high epiphytic zooplankton abundance primarily occurred in wetlands with high macrophyte biomass. However, copepods move faster than other zooplankton (Bundy et al. 1993); thus, they are not dependent on macrophytes for refuge. For this reason, copepods were present at high densities in most of the wetlands regardless of macrophyte biomass.
In this study, we recorded a high abundance of epiphytic zooplankton species (e.g.,
>
Importance of macrophytes in supporting zooplankton assemblages
In this study, we found a positive relationship between zooplankton communities and the role of macrophytes as a microhabitat. This survey provides baseline information about the protection and restoration value of macrophytes in relation to maintaining high zooplankton species diversity and abundance. We demonstrate that the diversity and abundance of zooplankton was closely related to macrophyte characteristics; this relationship is commonly found in other animals (Tews et al. 2004). The convergence of the animal species number implies that it is necessary to determine optimal macrophyte species diversity to satisfy both esthetic and ecological functioning of wetlands in restoration and management. Therefore, we suggested the introduction of proper macrophyte species for restoring or creating wetlands in order to not only increase biodiversity in the wetland, but also to sustain an ecologically healthy food web.
In this study, the zooplankton community of wetlands in South Korea was successfully visualized on the SOM, with zooplankton assemblage patterns being clearly correlated with macrophyte characteristics. On the SOM, the zooplankton community was clustered into 3 categories, with zooplankton distribution patterns being clearly partitioned by macrophyte dry weight and the number of macrophyte species. In particular, epiphytic species (i.e., epiphytic rotifers and cladocerans) exhibited a clear relationship with macrophyte characteristics, with high macrophyte biomass and species numbers supporting high epiphytic zooplankton assemblages. Zooplankton groups also showed a relationship with water depth and chlorophyll a. Light may penetrate to the bottom layers in shallow lakes and improve the development and growth of photosynthetic organisms such as macrophyte and chlorophyll a. However, most environmental parameters were not strongly related with any of the zooplankton groups. Thus, we suggest that the microhabitat structure created by macrophytes has a critical influence on zooplankton assemblages in wetland ecosystems, rather than water environmental parameters.