As international concerns over climate change have increased, there has been rising interest in forests, which sequester more carbon (C) than any other terrestrial ecosystem (Gibbs et al. 2007). Any forest-based project that aims to mitigate climate change requires an accurate and precise estimation of forest C (Ravindranath and Ostwald 2008). Further research on tropical forest C stock estimation is needed for the following reasons: firstly, tropical forests have a great potential for sequestrating carbon dioxide from the atmosphere because they have the highest primary productivity and occupy the largest area of all of the global forests (Pan et al. 2011); secondly, more reference data are needed to lower the uncertainty when estimating tropical forest C stocks because complex stand structures and high species diversity make the estimation prone to many errors (Chave et al. 2004); and lastly, 15-20% of global greenhouse gas emissions are caused by C emitted into the atmosphere by tropical deforestation (Gibbs et al. 2007); therefore, greenhouse gas emissionreduction projects must be given priority. However, there have been few studies conducted on the estimation of tropical forest C stocks, because tropical forests are generally located in developing countries, in which adequate research funding is difficult to obtain (Malhi et al. 2009), particularly in Southeast Asia (Pan et al. 2011).
One of the typical forest types in Southeast Asia is mixed dipterocarp forest (MDF). The Dipterocarpaceae is a family of tall and fast-growing trees that dominate the upper canopy of tropical forests. These vegetation zones are called MDFs due to their overwhelming presence (Appanah and Turnbull 1998). This family plays an important role in the timber market of many Southeast Asian countries because of their excellent quality (Poore 1989). It has been documented that the floristic compositions and canopy structures of MDFs vary with precipitation, topography, and soil nutrients (Ashton and Hall 1992, Appanah and Turnbull 1998). In addition, the biomass in MDFs exhibits high variance (e.g., 271 ± 19 to 478 ± 38 Mg ha-1) (Laumonier et al. 2010). Consequently, in order to decrease uncertainty in C stock estimation in MDFs, obtaining reference data is essential.
Kuala Belalong lowland MDF (i.e., this study area) has been protected by the Bruneian government; consequently, there are no records of significant disturbances, either natural or artificial (Cranbrook and Edwards 1994). Therefore, it is a completely intact primary forest. This is important, as many forests in developing countries that have been destroyed were tropical forests, and it is very difficult to find completely intact tropical forests for research purposes. For greenhouse gas emission-reduction projects, studies conducted in intact tropical forests can provide important data. In addition, the study area was established as the part of the Center for Tropical Forest Science (CTFS) project, which is a global network of forest researchers (http://www.ctfs.si.edu). Over 60 forest research plots in the Americas, Africa, Asia, and Europe are included in long-term research using the same methodology, for easy data sharing. Therefore, the scientific value of this study area can be considered very high. There have been approximately 260 papers published concerning Kuala Belalong lowland MDF, on various subjects: biodiversity, soil, forest structure, biogeography, etc. However, this is the first study that has investigated C stocks.
Knowing spatial variations in forest biomass is also important because carbon dioxide emissions from deforestation are determined by the original biomass of the forest that was destroyed, not necessarily by the average biomass for that geographical region (Houghton 2005, de Castilho et al. 2006). Consequently, it is essential to take into account several environmental factors when describing biomass variations. Tropical forests exhibit large spatial variability in tree biomass (Laurance et al. 1999, Chave et al. 2001, 2003); however, this variation is poorly understood (Houghton 2005). Therefore, investigating the effects of topography on variations in biomass is necessary to understand the forest in large-scale.
This study aimed to achieve the following objectives: 1) to provide reference data for estimating C stocks of an intact lowland MDF in Brunei; and 2) to investigate the relationship between biomass (aboveground and deadwood) and topographical factors. This is the first study that has estimated forest C stocks in Brunei and recorded not only the generally reported aboveground biomass (AGB) but also the total biomass in a forest ecosystem.
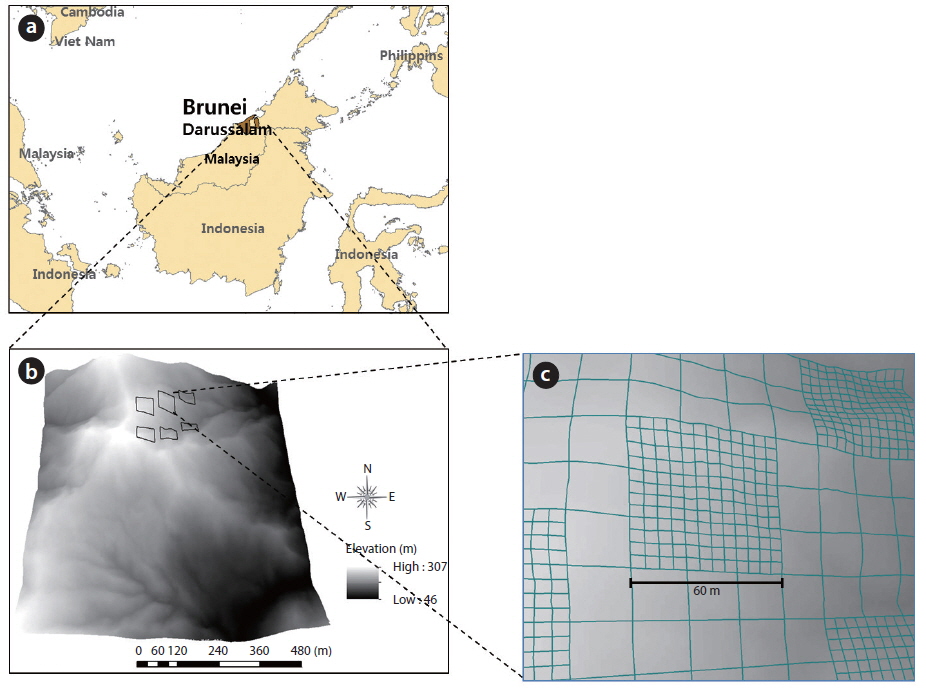
The study was conducted in the undisturbed Kuala Belalong lowland MDF, which is part of the Ulu Tembulong National Park, Brunei Darussalam (04°63′50.3″ N, 115°22′79.1″ E) (Fig. 1a). Meteorological data that were collected from 2006 to 2010 at Semabat Agricultural Station, which is located 9 km northwest of Kuala Belalong, show that the temperature is slightly variable, with monthly mean maxima of between 31.1℃ (July 2010) and 34.2℃ (May 2007) and minima around 26℃. The mean annual precipitation is approximately 4,582 mm, with no distinct dry season. The soils are yellow or red and are mainly inceptisols and ultisols derived from shale parent materials (Ashton and Hall 1992), according to the United States Soil Survey Classification. A detailed description of the local climate, topography, soil, and hydrology is provided by Cranbrook and Edwards (1994). The canopy consists of the crowns of the biggest trees at 30-40 m above the ground, which are only surpassed in height by emergents that are over 60 m tall (Poulsen et al. 1996). The dominant canopy family is Dipterocarpaceae, with individuals of the genera
The study was conducted in six 60 × 60 m quadrats, separated by a distance of approximately 100 m at an elevation of between 200 and 300 m above sea level (Fig. 1b). For ease of identification, numbered poles were placed every 10 m in both directions (rows and columns), and the 10 m was measured as a linear distance that accounted for the gradient. The 60 × 60 m quadrats were divided into several sub-quadrats (Fig. 1c). Large forest plots, including the CTFS plots, were established using this design, and they share the same methods of mapping and censusing trees. A detailed description of quadrat establishment and tree measurement is given by Condit (1998).
>
Living biomass and C stock estimation
The AGB (DBH ≥ 1 cm) was estimated by using the biomass estimation equation approach (Ravindranath and Ostwald 2008). DBH data were acquired from the six 60 × 60 m quadrats. We selected the following biomass estimation equation which was developed in a tropical lowland MDF in East Kalimantan, Indonesia (Basuki et al. 2009):

where AGB is in kg tree-1, DBH is in cm, WD (wood density) is in g cm-3, and the correction factor is 1.047 (Sprugel 1983). A WD value of 0.6 g cm-3 was found in a previous study conducted in this area (Osunkoya et al. 2007). The belowground biomass (BGB) was estimated using a BGBAGB ratio of 0.18, obtained from the Pasoh Forest Reserve, Malaysia (Niiyama et al. 2010).
Understory vegetation (trees with a DBH < 1 cm and herbs) biomass was estimated using the harvest method (Ravindranath and Ostwald 2008) within 2 × 2 m quadrats, which were randomly established in each 60 × 60 m quadrat (n = 6). All of the collected samples were oven-dried at 70℃ and weighed using an electronic scale.
To convert living biomass into C stocks, we assumed that 50% of the dry mass was C, based on the results from a study in Malaysia that had a similar species composition (Kenzo et al. 2010).
>
Dead organic matter biomass and C stock estimation
Deadwood biomass was calculated as the sum of log (fallen dead wood with diameter ≥ 10 cm) and snag (standing deadwood with DBH ≥ 10 cm) biomass. The log biomass was estimated using the line intersect method (Marshall et al. 2000), which is as follows:


where Blog is the log biomass (Mg ha-1), WDlog is the log WD (g m-3), Vlog is the log volume (m3 ha-1), L is the length of the line transect (m), n is the number of log pieces that intersects the line transect, di is the diameter (≥10 cm) of log i at the point of intersection (cm), and λi is the angle from the horizontal of the log (n = i) crossed by the line transect (degrees). To estimate the Vlog, six 60 m transect lines were established in each 60 × 60 m quadrat at regular intervals. The di and λi were measured along each transect line. To estimate WDlog, all the logs were subsampled in a 20 × 20 m sub-quadrat of each 60 × 60 m quadrat (n = 6). The volumes of the samples were determined using the ethanol displacement method (Saner et al. 2012). The samples were then dried in an oven to a constant weight (70℃) and weighed using an electronic scale.
The snag biomass (Bsnag) was the product of the WD (WDsnag) and the volume of snag (Vsnag). Due to a lack of data for the WDsnag, the same value of the WDlog was applied to the WDsnag. To estimate the Vsnag, DBH, height, and snag structure (stem only or stem plus branches) were recorded for all snags in the same six 60 × 60 m quadrats. Snag height was visually estimated, and tree Vsnag was calculated following the methods described in Gale (2000). The Bsnag was estimated by multiplying the Vsnag and the WDlog. To convert dead organic matter biomass into C stocks, we assumed that 50% of the dry mass was C.
Litter (twigs, leaves, and reproductive organs) biomass was also sampled within 2 × 2 m quadrats, which were randomly established in each 60 × 60 m quadrat (n = 6). All of the collected samples were oven-dried at 70℃ and weighed using an electronic scale.
>
Estimation of soil organic C
Soil was sampled in August and December 2013 at 0 to 10 cm, 10 to 20 cm, and 20 to 30 cm depths using a 10 cm long cylindrical metal corer (406.94 cm3) at three random points in each six 60 × 60 m quadrat (n = 18). The samples were then air dried and sieved through a 2-mm mesh screen (US standard No. 10) for determining bulk density and concentrations of C. Soil bulk density was determined by dividing the weight of soil samples dried at 105℃ by the volume of the metal corer. An elemental analyzer (vario Macro cube CN, Elementar, Germany) was used to measure the soil C concentration. Soil C stocks at each depth were calculated from the soil C concentration and the bulk density of each soil sample.
>
Variations in living and dead wood biomass in terms of topographical characteristics
To analyze variations in biomass and topographical characteristics, each 60 × 60 m quadrat was divided into nine 20 × 20 m sub-quadrats. The biomass and topography were analyzed using PROC MEANS, PROC CORR, and PROC REG in SAS 9.3 software (SAS Institute Inc., Cary, NC, USA). Topographical data were obtained from LiDAR and ArcGIS.
Total AGB was estimated as 361.8 ± 21.0 Mg ha-1 (Table 1), which was classified as in the highest biomass class category (AGB > 350 Mg ha-1) according to the classification criteria proposed by Saatchi et al. (2011). Only 7% in Asia, 8.7% in Africa, and 7.4% in Latin America has more than 350 Mg ha-1 AGB (Saatchi et al. 2011). However, this value is much lower than that recorded in the Lambir Hills National Park, Sarawak, Malaysia (544.8 Mg ha-1; Katayama et al. 2013), which has a similar primary MDF near our study site. There could be several reasons for this: 1) the dominant tree height differs between areas. The canopy of our site was approximately 30 to 40 m in height, and the density of tall trees was not high, whereas Lambir National Park has a continuous 40 to 50 m tree layer (Katayama et al. 2013); 2) the result obtained in Lambir included lianas. In a lowland rainforest in Venezuela, the mean biomass of a liana with a 10-cm DBH is nearly four times the leaf biomass of a 10-cm DBH tree (Putz and Chai 1987). Therefore, lianas might be an important component in estimating the biomass of tropical forests; 3) lastly, environmental conditions are different. The mean annual rainfall in Lambir (2600 mm) is much lower than that at our site, the soil has a higher sand content (62 to 72%), and the range of elevation (20 to 470 m) is greater (Katayama et al. 2013). Consequently, the AGB depends on the area, even in the same MDF, for many reasons. The specialized estimation for a particular area might be required in this case.
The stand density of the study site was 6718.1 ± 328.5 stems ha-1 (mean ± SE), and about half (48.1%) of the AGB was in trees with a DBH greater than 50 cm, which accounted for 0.6% of the total number of stems. The AGB of the trees with a DBH of 1.0 to 9.9 cm (that accounted for 91% of the total number of stems) accounted for 8.1% of the total AGB (Table 1). This suggests that the study site is a climax forest and has a large number of highly competitive young trees, and only a small number of big trees survive (Alder and Synnott 1992). In addition, the site has an uneven topography and an easily disaggregated soil type, which results in severe soil erosion (Cranbrook and Edwards 1994); this also might inhibit the growth of large trees. Generally, trees with a DBH of less than 10 cm are usually disregarded in AGB estimations. In this study, however, the AGB of trees with a DBH of 1.0 to 9.9 cm was also estimated, and the result (8.1% of the total AGB) was not negligible. As a result, to enhance the accuracy and precision of AGB estimations in intact tropical forests with a similar DBH profile as this area, the inclusion of trees with a DBH lower than 10 cm is essential. The total basal area of the study site was 38.8 m2 ha-1, which is similar to that of a previous study conducted in an undisturbed Malaysian lowland MDF (34.5 m2 ha-1; Sato et al. 2013).
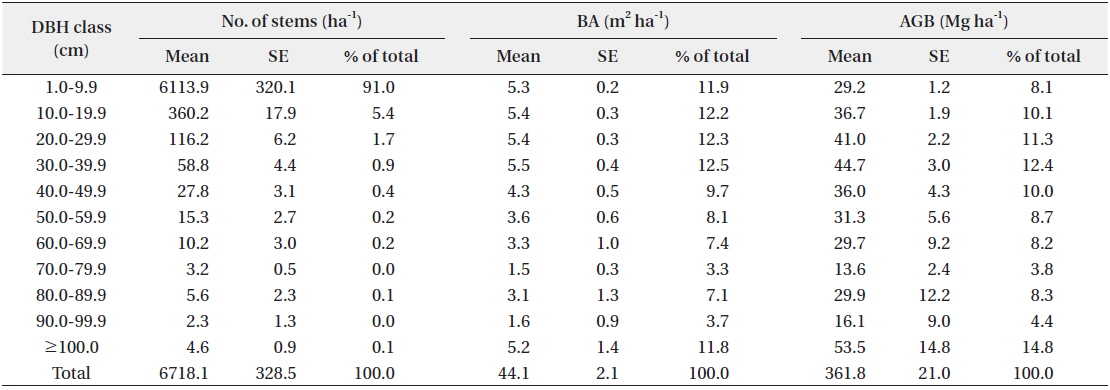
Estimates of number of stems, basal area (BA), and aboveground biomass (AGB) in Kuala Belalong lowland mixed dipterocarp forest
The BGB of the study site was estimated as 65.1 Mg ha-1, using a BGB-AGB ratio of 0.18. When the DBH-BGB regression equation developed in a Malaysian lowland MDF was used for the estimation (Niiyama et al. 2010), the resulting BGB was 120.9 Mg ha-1. According to this result, the BGB-AGB ratio is estimated as 0.33, while values from previous studies conducted in other tropical forests were 0.14 (Chave et al. 2005), 0.19 (Jackson et al. 1996), and ≤0.24 (Cairns et al. 1997). Compared to these reported values, a ratio of 0.33 might be considered an overestimation. In fact, the Malaysian study area where the DBH-BGB regression equation was developed has a DBH distribution that is different from that in our study area, and the area is dominated by trees with a large DBH. In addition, Brown (2002) reported that tree age was also an important factor that had to be considered when using a BGB regression equation. Root biomass also differs among tropical forests, and depends on meteorological and soil characteristics (Brown and Lugo 1982, Sanford and Cuevas 1996). For these reasons, using the above DBH-BGB regression equation in our study area may not have been ideal.
The biomass of woody plants (≤1 cm DBH) and herbs was 0.2 ± 0.1 Mg ha-1, and this was relatively low compared to the total living biomass (<0.1%). This result is similar to that found in a previous study (Brown 1997); biomass allocation in woody plants is a typical characteristic of mature tropical forests, and understory vegetation plays important ecological roles in tropical forests. Indeed, the rate of forest tree development is higher in areas without understory cover (Parrotta 1995). Therefore, understory vegetation may have the same value as other C pools in tropical forest restoration, even though its biomass allocation is small (Lamb 1998).
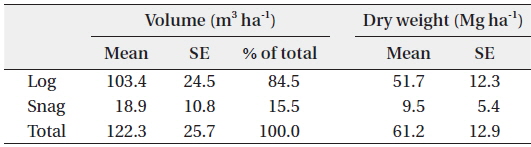
The volume of dead wood in the study site was estimated as 122.3 ± 25.7 m3 ha-1, and this value is similar to that obtained in a previous study (116 m3 ha-1; Yoneda et al. 1990) in the MDF of Sumatra island (Table 2). Log volume was 103.4 ± 24.5 m3 ha-1, and it accounted for 84.5% of the entire dead wood volume. This value is 57% higher than that obtained in a previous study conducted in the same area (66.0 ± 10.2 m3 ha-1; Gale 2000). The difference in the two results might be due to the facts that: 1) the current study included logs with a DBH of 10 to 20 cm; and 2) transect lines were established mainly on ridges. Gale (2000) found that log volume tended to decrease from the ridge to the valley. In this study, snag volume accounted for 15.5% of the entire dead wood volume (18.9 ± 10.8 m3 ha-1), and this was lower than that of the previous study (37.7 ± 4.7 m3 ha-1; Gale 2000). The log WD was 0.50 ± 0.04 g cm-3 (n = 36), which is identical to the result of a previous study conducted in a Venezuelan tropical rain forest (0.5 g cm-3; Delaney et al. 1998). Log and snag dry weights were estimated by multiplying the WD with the volume.

Estimated volume (m3 ha-1) and dry weight (Mg ha-1) of log and snag in Kuala Belalong lowland mixed dipterocarp forest
The total biomass of dead wood was estimated as 61.2 ± 12.9 Mg ha-1. In an old forest, such as in our study area, the inputs and outputs of dead wood are theoretically in balance, and dead wood biomass is relatively constant (Harmon and Sexton 1996). Therefore, it can be assumed that the total dead wood biomass would remain constant, as the study site was an old forest. Our results should be highly accurate, as the study areas (six of 60 × 60 m quadrats) were large in comparison with those in other studies, e. g., 50 × 50 m by Delaney et al. (1998); 30 × 40 m, Toriyama et al. (2014). The amount of dead wood in tropical forests has been poorly quantified, but is extremely variable (it can account for less than 10% to more than 40% of the total biomass; Brown 1997), and depends on various factors. Therefore, the current study’s results should be highly accurate and could provide useful reference data for intact tropical MDFs.
The litter dry weight was estimated as 6.2 ± 1.0 Mg ha-1, which was 10% of the dry weight of dead wood. Twig dry weight accounted for 59.7% of the total litter, and leaves accounted for 40.1%. Almost all of the litter was composed of twigs and leaves, and the dry weight of the reproductive organs was relatively insignificant. Litter dry weight was very similar to that found in a previous study: 5.75 Mg ha-1 in a MDF in the Andulau Forest Reserve, Brunei (Moran et al. 2000). Patterns of litter from standing crops usually exhibit temporal variations (e.g., seasons), and tropical forests are not an exception (3.0 to 10.5 Mg ha-1; Spain 1984). However, our study site had little seasonal variation, and monthly litterfall was relatively constant, therefore, the litter from standing crops in this area might exhibit little temporal variation.
The total soil C stocks between 0 and 30 cm in depth was estimated as 74.2 Mg C ha-1, 46.5% of which was between 0 to 10 cm, 28.7% was between 10 to 20 cm, and 24.8% was between 20 to 30 cm. The soil C concentration (g kg-1) of 0-10, 10-20, 20-30 cm depths were 38.4, 19.4, 14.2, respectively, decreasing from 0 to 30 cm. Because of frequent rain, uneven topography, and a silty clay soil type, the soil of the study site is relatively shallow, and is rarely deeper than 2 m (Cranbrook and Edwards 1994). In addition, there were many roots and stones present on the soil surface, making core sampling difficult. In a previous study conducted in a primary tropical forest in Singapore (Ngo et al. 2013), the soil was 3 m deep, and soil C stocks between 0 and 300 cm in depth were estimated as 132.5 Mg C ha-1. Variations in soil characteristics within our study area suggest that the optimal investigative method should be specialized for the target area (Carter 1993). Because soil C accounts for the second-largest proportion of the total C stock, accurate and precise soil C estimation is important.
>
Total C stocks and allocation
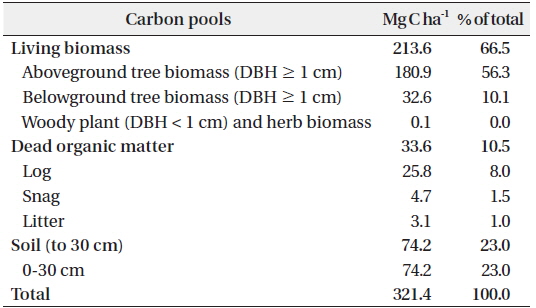
The C stocks and allocation to each C pool are shown in Table 3. The total C stock was estimated as 321.4 Mg C ha-1. This value is higher than that found in the Bukit Timah National Park, Singapore, which has a similar stand structure (337 Mg C ha-1; Ngo et al. 2013). The C stocks of the living biomass, the dead organic matter, and the soil accounted for 67%, 11%, and 23%, respectively, of the total. This suggests that living biomass accounts for a high proportion of C, whereas that by dead organic matter and soil is low. This is typical of tropical rain forests with high primary productivities and decomposition rates (Pan et al. 2011).

Estimates of carbon (C) stocks in each C pool (Mg C ha-1) in Kuala Belalong lowland mixed dipterocarp forest
>
Variations in living biomass and dead wood biomass associated with topographical characteristics
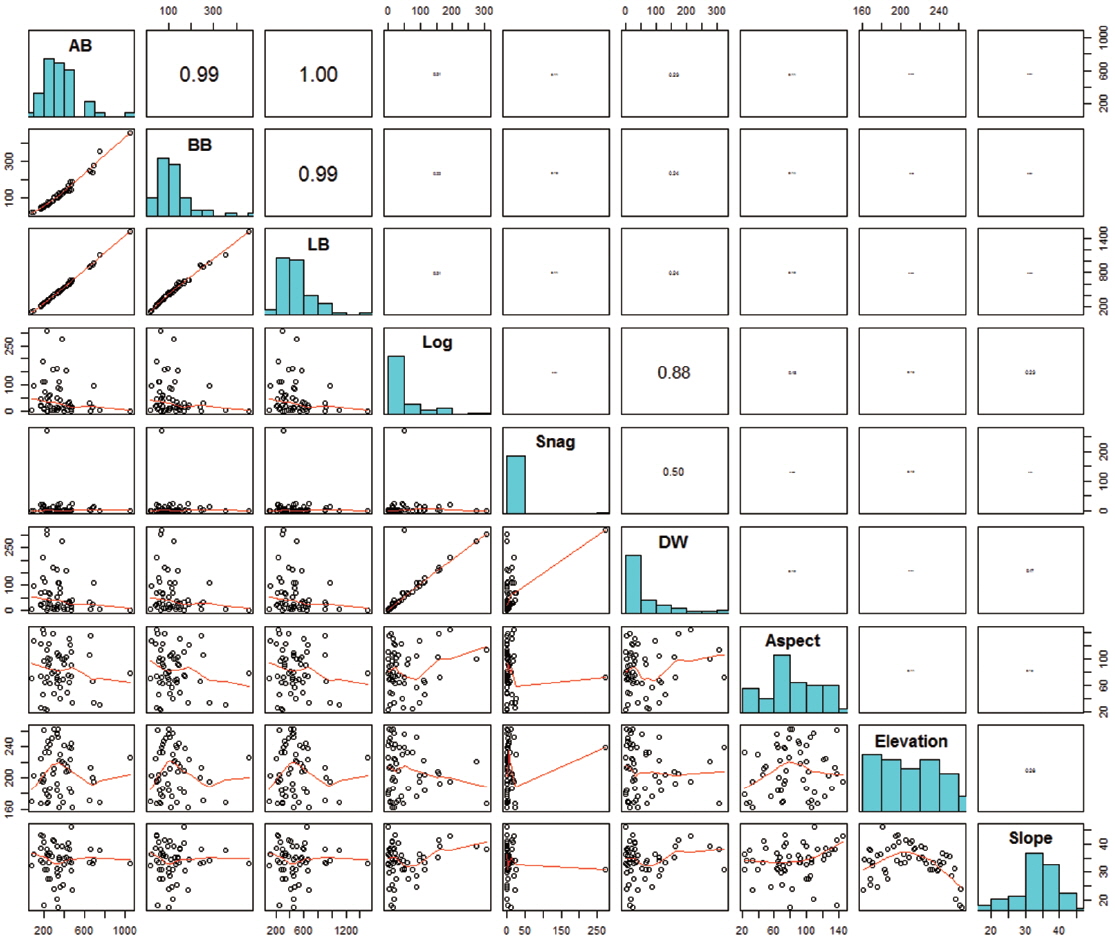
Variations in biomass and topography among the 20 × 20 m quadrats (n = 54) varied widely (Fig. 2). The total living biomass varied from 108.3 to 1509.8 Mg ha-1, which was highly variable compared to the results from a previous study (189.8 to 422.8 Mg ha-1; de Castilho et al. 2006). Dead wood biomass was also variable (0 to 321.7 Mg ha-1), and the coefficients of variation (CVs) of aboveground tree biomass, belowground tree biomass, log dead wood, and snag dead wood were 176.8%, 81.4%, 67.4%, and 37.1%, respectively. Aspect and elevation varied between 35.3° and 303°, and 161.5 to 262.5 m, respectively, and the slope ranged from 17.3° to 46°.
No statistically significant correlations were found between biomass and topographical factors (Fig. 2), and only weak, non-significant correlation was found between log biomass and slope (
Our study quantified the C stock of the Kuala Belalong lowland MDF, Brunei Darussalam, which was 321.4 Mg C ha-1. Living biomass, dead organic matter, and soil accounted for 67%, 11%, and 23%, respectively, of the total C stock. One of the remarkable characteristics of this forest is that it is dominated by small trees. Variations in living and dead wood biomasses were high; however, there were no significant relationships between biomass and topographical factors. Our results provide useful reference data and background information for understanding the biomass variations specialized in lowland MDFs.