Interferometry, which offers high resolution and nondestructive and high-speed measurements, is widely used in precision metrology, such as for liquid crystal displays (LCDs) [1], semiconductors [2, 3], and microelectromechanical systems (MEMS). Interferometry acquires interferograms as it moves along the
Accelerometers are widely used in industry to measure vibrations. However, they have some disadvantages, one being that the accelerometer needs to be attached to a vibrating part. Furthermore, the mass of the sensor can distort vibration measurements.
The most extensively studied methods for measuring vibration are speckle pattern interferometry (SPI) [4-8] and digital holographic interferometry (DHI) [9-11], which have been used to measure the vibration of the interferometry system itself. These methods use a laser as a light source and measure the deformation of the sample. The light source is a limitation for these systems.
Techniques for vibration measurement with Michelson interferometry have been studied in various ways. A method for real-time measurement of out-of-plane vibration using an additional beam splitter (BS) and two gratings has been proposed [12]. This system requires additional optical components, and it was difficult to align the gratings and reference mirror. Some problems also arose when measuring linear and sharp vibrations.
Interferometry with a self-pumped phase conjugate mirror (SPCCM) has been used to measure vibration [13]. Vibration on a rough surface could be measured by this system, but the range of measurable amplitude was too narrow, because of the properties of the SPCCM. Dual Michelson interferometry using optical fibers has been studied [14, 15]. These systems have the advantage of being comparatively insensitive to external noise and long measuring distances. However, they require an additional laser and a complicated feedback loop to compensate for external noise [14]. Several other ways have been studied, including the use of Moiré interferometry with gratings [16, 17] and frequency-scanned interferometry [18]. A vibration-measurement method using Michelson interferometry without any additional component has been studied [19]. This method obtains the intensity as a function of time and converts it to the frequency domain by fast Fourier transform. This method has the advantage of a simple set-up and low costbut it only measures vibrational frequency, not vibrational amplitude or phase error.
In this paper, we propose methods for measuring displacement and phase error caused by vibration. These methods use variations of the fringe pattern in reflective monochromatic interferometry, without additional components. These methods can measure environmental vibrations, along with those of the interferometry system. The most important advantage of the proposed methods is that they can be easily applied to any kind of interferometry.
A basic Mirau interferometry approach is shown in Fig. 1. Light from an LED or a laser is incident upon BS1 and is reflected to the objective lens. Then, the reflected beam is split by BS2 into sample and reference arms. The split beams are reflected from the sample and reference mirror respectively, and then the reflected beams pass through BS2 and BS1. Finally, the beams are detected by a charge-coupled device (CCD) camera. These two beams travel different paths and create an interferogram.
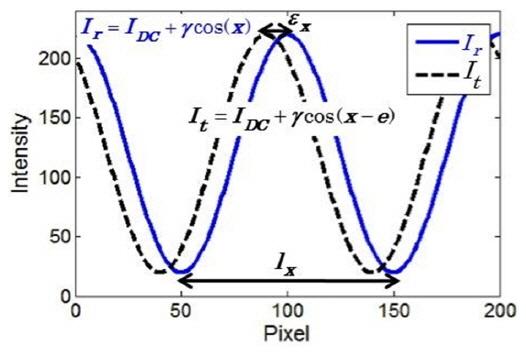
The interferogram frommonochromatic interferometry can be described as:

where
The difference in the distances that the two beams travel, 2(

where

However, out-of-plane vibrationcauses a change in OPD during mechanical adjustment. In the presence of vibration of a single frequency, Eq. (1) can be re-expressed as:

where
Vibrations cause uncontrolled changes in OPD, and this can induce phase errors in the reconstruction process. When the surface profile is restored, phase errors introduce ripples into the measured results for a flat surface [22]. Thus, it is important to measure the variations of the interference fringe caused by vibrations to optimize an interferometry system and compensate for phase errors.
III. PROPOSED MEASUREMENT METHODS FOR VIBRATION
In interferometry, several fringe patterns appear when the sample has a tilted flat surface. Variations in fringe patterns are detected as they move laterally due to out-of-plane vibration.
The OPD is changed when the sample moves from position A to position B due to out-of-plane vibration, as shown in Fig. 2. If a dark fringe appears at point 1 when the sample is placed at position A, it shifts to point 2 as the sample moves to position B. Therefore, the fringe pattern shifts a distance
Out-of-plane vibration is the main source of measurement error among various types, including in-plane vibration and tilt vibration. In-plane vibration does not change the OPD; therefore, the proposed method cannot measure in-plane vibration. On the other hand, tilt vibration alters thetilt angle
3.1. Displacement Measurement Method
Images are captured by CCD at a fixed time interval without any mechanical moving process, while the sample is vibrated vertically. We call the first captured image the
Figures 3(c)-3(d) show the profiles that were extracted from reference (Fig. 3(a)) and target images (Fig. 3(b)) in the lateral direction. The displacement of the sample can be calculated by analyzing variations in the extracted profiles.
As shown in Fig. 2, the ratio of the half wavelength

In this paper
Figure 5 shows a procedure for calculating the displacement caused by vibration. Images are captured, profiles are extracted from reference and target images, and finally the displacement of vibration is calculated from all extracted profiles using Eq. (5).
3.2. Phase Error Measurement Method
The phase error due to vibration can be calculated using the fringe spacing and the distance that the fringe pattern shifts. However, if the flat part of the sample is not wide enough, or the tilt angle is very small, the fringe spacing and the distance that the fringe pattern shifts cannot be obtained. Therefore, the following method is required to measure the phase error due to vibration.
The phase error can be measured by the subtraction of one profile from another profile. Figure 6 shows that
As in the section above, we should assume that the phase difference between two profiles is less than
Let the position at which

The two cosine values cannot be the same because

Similarly, where

Using Eq. (8), the magnitude of the phase difference |

The calculated value of |

In addition, as shown in Fig. 2,

The phase error due to vibration is proportional to the ratio of displacement

IV. EXPERIMENTAL RESULTS FOR SMALL-AMPLITUDE VIBRATION
The Mirau interferometry employed in this study is shown in Fig. 1. We use an optical band-path filter on an LED light source that provides quasi-monochromatic light. The beam after the band-pass filter has a center wavelength of 550 nm and bandwidth of 20 nm. We use a multiaxis piezo nanopositioning stage P-518.ZCL (PI) as the out-of-plane vibration generator. A 33500B series waveform generator (Agilent) is used to control the waveform and amplitude of the vibration. A Vieworks CCD camera with 640×480 pixels is used to capture the images. A 10 of the vibration. A Vieworks CCD camera with 640×480 pixels is used to capture the images. A 10x objective lens is used so that the field of view (FOV) of the experimental system is 464×348 μm.
There should be at least one whole fringe pattern in each image, to measure the vibrational amplitude and phase error. The lower limit of the tilt angle
To measure the vibration, 100 images are captured without a mechanical moving process; only variations of the fringe pattern due to out-of-plane vibration are obtained. A voltage of 15 mV is applied to the vibration generator to create vibrations of amplitude 100 nm. We measure four waveforms using the proposed methods. Images are captured at time intervals of 1/35 s during vibration, and the displacement caused by the vibration is calculated using Eq. (5). Figure 7 shows that the measured displacement has the same shape and normalized amplitude as the input voltage. These results confirm that the proposed technique for displacement is a convenient and effective approach for measureming any waveform from small vibrations.
In the same manner, we measure phase error from the captured images using Eqs. (9) and (10). Figure 8 shows a comparison of phase error to input voltage. The results confirm that the proposed technique for phase error is also useful for any waveform.
V. ADVANCED VIBRATION MEASUREMENT METHODS
5.1. Ambiguity Problem of the Proposed Methods
There is an ambiguity of 2
5.2. Advanced Method for Large-amplitude Vibration: Relative Method
In the methods proposed earlier, reference and target images are used to calculate displacement and phase error, whereas in a relative method, two consecutive target images are used. As in the earlier methods, profiles are extracted from images, and the relative displacement and phase error are calculated using profiles from consecutive captured images. Displacement and phase error are determined by the accumulation of relative values, as shown in Fig. 10. By using a relative method, large-amplitude vibration can be measured without ambiguity, if one assumes that the relative displacement between two consecutive images is smaller than a quarter wavelength. This assumption is valid for cases in which the frame rate of the camera is higher than the vibrational frequency, as the frame rate corresponds to the reciprocal of the time interval required to acquire the images. In other words, large-amplitude vibrations can be measured unambiguously if the frame rate is higher than the vibrational frequency.
[FIG. 10.] Procedure for using relative displacement to calculate the displacement due to vibration.

If we let the relative displacement of the ith and (i+1)th image be (Δ

where (Δ

In the same way, a phase error larger than 2

Thus the phase error can be determined by:

A voltage of 150 mV is used to create a vibration of amplitude 1 μm. 100 images are acquired at time intervals of 1/55 s. Figure 11 shows the two waveforms that are measured by the relative method, and a comparison of the measured results to the input voltage.
As shown in Fig. 11, the relative method solves the ambiguity problem in large-amplitude vibration. The measured results have shape and normalized amplitude identical to those of the input voltage. These results confirm that the advanced methods are convenient and effective for measuring any vibration.
VI. FREQUENCY ANALYSIS AND COMPARISON TO RESULTS FROM AN ACCELEROMETER
Frequencies of vibration are as important as vibrational amplitude, and can be determined by frequency analysis. Measured displacement can be converted to vibrational frequency by frequency analysis such as fast Fourier transform, and the main frequencies of vibration can be determined by finding peaks in the frequency domain. When a camera is used to measure vibration, the range of measurable frequencies depends on the frame rate of the camera,
To verify the performance of the proposed method, measurement results are compared to those from an accelerometer, which is used predominantly in industry. Multifrequency vibration is measured by both techniques, and the results compared in the frequency domain. The measured vibration is the sum of four sine waveforms with frequencies of 1, 5, 10, and 20 Hz respectively. The amplitudes of all of the waveforms are the same, and the vibration is expressed as:

300 images are captured at intervals of 1/110 s, and displacement is calculated by the relative method. Figure 12 shows the displacement measurements.
The measured displacement is analyzed in the frequency domain by fast Fourier Transformation (FFT). Figure 13 shows the four peaks, which are identified at 1, 5, 10, and 20 Hz.
The same vibration is measured with an accelerometer (DS 2000 series, Onosokki) and the average result for 10 s evaluated using Onosokki’s software. Figure 14 shows three peaks identified by the accelerometer at 5, 10, and 20 Hz. These peaks are obvious, but the peak at 1 Hz looks like noise. The failure to measure the peak at 1 Hz is caused by the limitations of the accelerometer at low frequencies.
Using the proposed method, the same results can be obtained for frequencies greater than 5 Hz, and better results can be achieved for lower frrequencies, than with an accelerometer. Thus the proposed method is useful for measuring vibrational frequencies.
In this paper we have proposed methods for measuring displacement and phase error due to vibration. We developed and tested the methods to verify their performance. This work is summarized as follows.
(1) Our system consisted of the following components: an LED light source, an optical band-pass filter to provide quasimonochromatic light, an objective lens, and a CCD camera to capture images. This is a basic Mirau interferometry set-up that is used extensively to measure surface shapes. Moving parts or additional optical components are not needed. The proposed methods only use variations in fringe patterns caused by changes in the OPD. Thus, the proposed methods can be applied to measurement of environmental vibration as well as the vibration of the system itself. A vibration generator was used to create out-of-plane vibration. (2) Images were captured by a CCD camera at the same time interval, without any mechnical moving process. We referred to the first image that was obtained as the reference image, and the others as target images. The profiles extracted from the reference and target images in the lateral plane were used to calculate displacement and phase error due to vibration. We assumed that the displacement caused by the vibration was smaller than a quarter wavelength. (3) The vibrations we measured had amplitudes of 100 nm and four different waveforms: ramp, sine, square, and triangle. The calculated displacement and phase error were compared to theinput voltage, and the results confirmed that the proposed methods are useful for measuring the waveforms of small vibrations. (4) In the case of large-amplitude vibrations, the measured results were distorted. To solve this problem, we proposed the use of an advanced method called the relative approach. The advanced method used the same system as the earlier methods. Two consecutive images were captured and used to calculate relative displacement and phase error. The relative values were calculated from two consecutive profiles that were extracted in the same way as in the earlier methods. Then displacement and phase error were determined by the accumulation of relative values. We assumed that the relative displacement of two consecutive images was less than a quarter wavelength. (5) The vibrations we measured had amplitudes of 1 μm and two waveforms: sine and triangle. Relative values were calculated and accumulated to determine displacement and phase error. The measured results were compared to theinput voltage. This comparison indicated that the proposed methods are useful for measuring any type of vibration. (6) To verify the performance of the proposed methods, the measurement results were compared in the frequency domain with those from an accelerometer. Multifrequency vibrations of 1, 5, 10, and 20 Hzwere measured using the proposed methods and an accelerometer. The displacement measured by the proposed method was analyzed in the frequency domain by fast Fourier Transformation; then we measured the same vibration with an accelerometer. Both the proposed method and the accelerometer identified peaks at 5, 10, and 20 Hz, but the peak at 1 Hz was only identified by the proposed method. These results confirmed that the proposed method is useful for measuring vibrational frequencies. Furthermore, the proposed method performed better than a conventional accelerometer for low-frequency vibration.
The proposed methods can be used to measure displacement and phase error due to out-of-plane vibration. Additionally, vibrational frequencies can be determined by an analysis of the displacement measured in the frequency domain. Therefore, vibration can be directly measured and easily managed using interferometry in industrial applications. The most important advantage of the proposed method is that it can be applied easily to almost any kind of interferometry, without any additional components.