Recently a new lighting technology based on white light-emitting diodes (LEDs) has begun to illuminate the world, replacing conventional lamps such as incandescent and fluorescent bulbs. White LEDs have attracted great interest as bright, energy-efficient, and environmentally friendly light sources [1-4]. Owing to rapid progress in their luminous efficiency (LE), white LEDs have been employed in most back-light units in the liquid-crystal display systems of mobile phones, laptop computers, and large flat-panel displays. In addition, light sources for general illumination are being replaced with LED lamps. The peak LE of white LEDs has been reported to be higher than 200 lm/W [5], which is more than twice the efficiency of fluorescent lamps. According to Heitz’s law, the LE of LEDs is expected to increase while the manufacturing cost drops, which should lead to wide replacement of our current light bulbs with LED lamps in the near future.
LEDs for general lighting operate at relatively high electrical input power, which requires good thermal management. Currently most white LEDs are manufactured as the phosphor-conversion type, which consists of a GaN-based blue LED chip and a yellow phosphor. In the phosphor-conversion (PC) white LED, the LE and color characteristics may change significantly as temperature increases [1]. Thermally stable operation of white LEDs is quite important for general lighting applications. The LE of white LEDs tends to decrease with increasing temperature, which is attributed to the decrease in the conversion efficiency of the yellow phosphor as well as the decrease in the wall-plug efficiency (WPE) of the blue LED chip.
Since the light spectrum emitted from the phosphor overlaps well with the highly sensitive region of the eye, the luminous flux of white LEDs is dominated by the spectrum of yellow light converted by the phosphor. Therefore, the temperature dependence of the phosphor-conversion efficiency (PCE) plays an important role in the thermal properties of PC white LEDs. However, there has been a lack of studies of the temperature dependence of PCE in white LEDs, despite its practical importance. In this paper we investigate the temperature dependence of PCE by analyzing the experimentally measured spectrum of a PC white LED. The temperature dependence of the WPE of the blue LED and that of PCE are determined separately from spectral analyses, which are used to explain the temperature dependence of LE in the white LED. It is not easy to evaluate the absolute value of PCE for the phosphor material in the white LED [6]; nevertheless, it will be shown that the relative change of PCE with temperature can be obtained through the analysis of the LED’s efficiency and spectrum.
We used commercially available white LED packages for this experiment. The white LED sample consisted of a blue LED chip and yellow-emitting Y3Al5O12:Ce3+ (YAG:Ce) phosphor. The blue LED chip was fabricated as a vertical-injection type with dimensions 1×1 mm2. The LED chip was mounted on a lead frame with dimensions 8×8 mm2, and molded with transparent epoxy resin containing the yellow phosphor. The packaged white LED sample was soldered onto a metal printed circuit board (PCB) for good heat dissipation. The metal PCB was then mounted on a copper heat sink, and the temperature controlled by a thermoelectric cooler system. The optical and electrical characteristics of the LED sample were measured by an LED characterization system with a calibrated integrating sphere [7]. Here the LED sample was operated under pulsed current injection conditions with a pulse width of 1.0 ms and a duty cycle of 1%, to minimize self-heating effects. The heat-sink temperature was varied from 20 to 80 ℃, and up to 350 mA of current was injected.
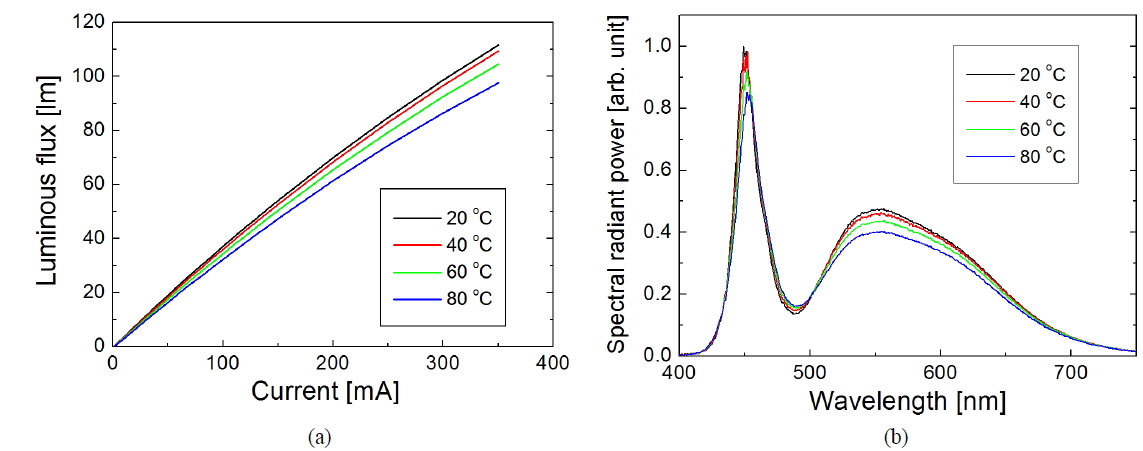
Figure 1 shows the luminous flux and spectrum of the measured white LED sample at temperatures of 20, 40, 60, and 80 ℃. The spectral data shown in Fig. 1(b) were measured at 350 mA, which has been regarded as the standard operating current for LEDs with dimensions of 1×1 mm2. The luminous flux increases sublinearly with current, and decreases with temperature at large injection current; at 350 mA it decreases from 112 to 98 lm as the temperature increases from 20 to 80 ℃. The spectrum of the white LED sample shows two peaks, due to blue light leaked from the LED chip and yellow light emitted by the phosphor, respectively. The peak wavelength of blue light increases from 450 to 453 nm as the temperature increases from 20 to 80 ℃, whereas that of yellow light remains at 555 nm, almost unchanged with temperature. The radiant power in both blue and yellow spectral regions decreases with increasing temperature.
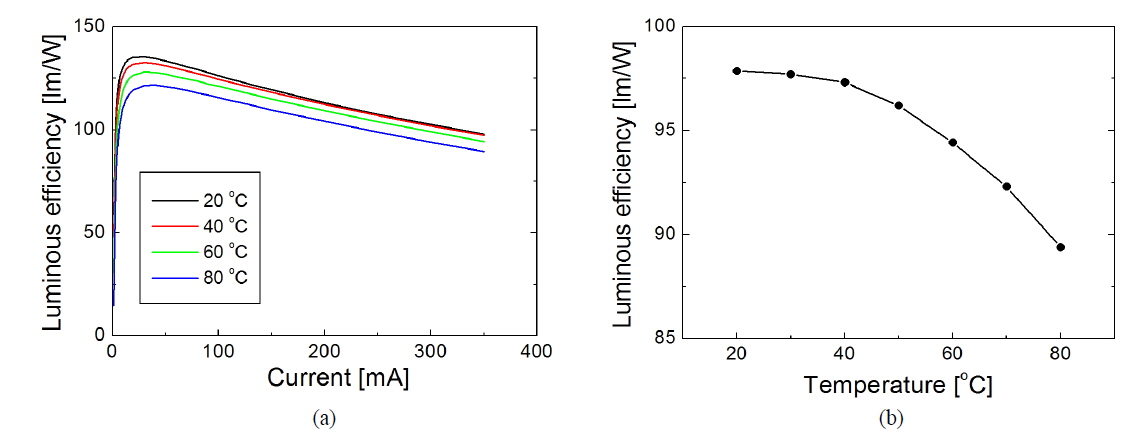
Figure 2(a) shows LE as a function of current for temperatures from 20 to 80 ℃. LE is obtained by dividing the luminous flux by the electrical input power. The decrease of LE with temperature is clearly observed even over our small current range. The peak LE, which occurs at ~30 mA, decreases from 135 to 121 lm/W as temperature increases from 20 to 80 ℃. The decrease of LE for currents above 30 mA mainly originates from the efficiency droop of the blue LED chip [8-10]. Figure 2(b) shows LE at 350 mA as a function of temperature. LE decreases from 98 to 89 lm/W as the temperature increases from 20 to 80 ℃; that is, the relative decrease of LE from 20 to 80 ℃ is 9.1%. The decrease of LE with temperature can be attributed to the decrease in both the WPE of the blue LED chip and the PCE of phosphor.
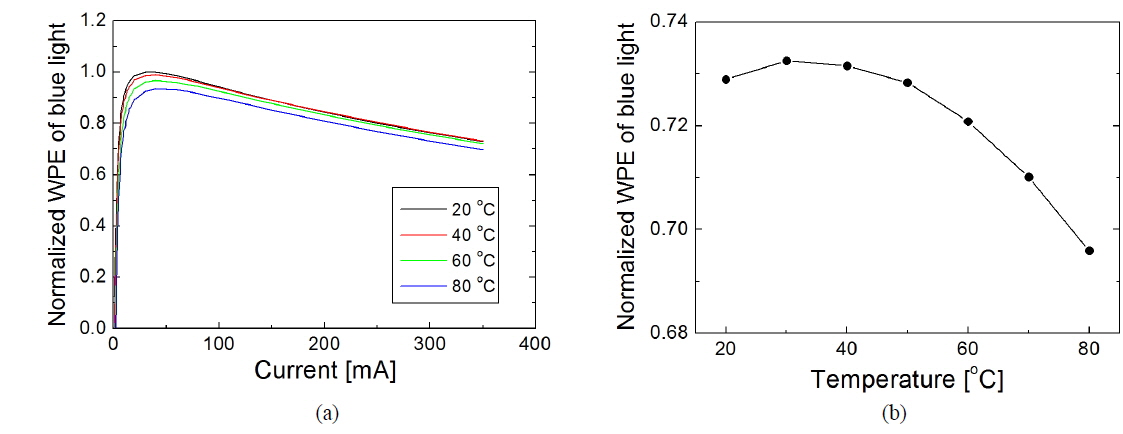
The relative variation of WPE of the blue LED with temperature can be easily obtained by integrating the blue region of the spectral data in Fig. 1(b). However, absolute values for WPE of the blue LED cannot be obtained, because only the blue light that leaks from the white LED package is measured. Figure 3(a) shows WPE curves of the blue LED chip for temperatures from 20 to 80 ℃. The WPE curves are normalized to the peak WPE at 20 ℃. Figure 3(b) shows the normalized WPE at 350 mA as a function of temperature. Unlike the temperature dependence of LE seen in Fig. 2(b), WPE initially increases from 20 to 30 ℃ but then decreases with increasing temperature. The increase in WPE from 20 to 30 ℃ mainly comes from the decrease in operating voltage with temperature in the blue LED chip [11]. The relative decrease of WPE from 20 to 80 ℃ is 4.5%, which is about half as great as that of the LE. This difference in temperature dependence between the LE of the white LED and the WPE of the blue LED can be explained by investigating the temperature dependence of the PCE. In the next section, this temperature dependence is obtained by analyzing the measured spectral data.
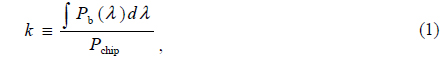
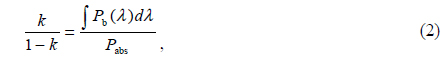
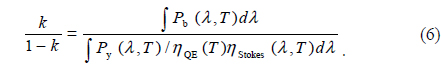
First we introduce a dimensionless quantity

where
where

where
The PCE can be decomposed as

where
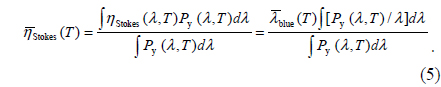
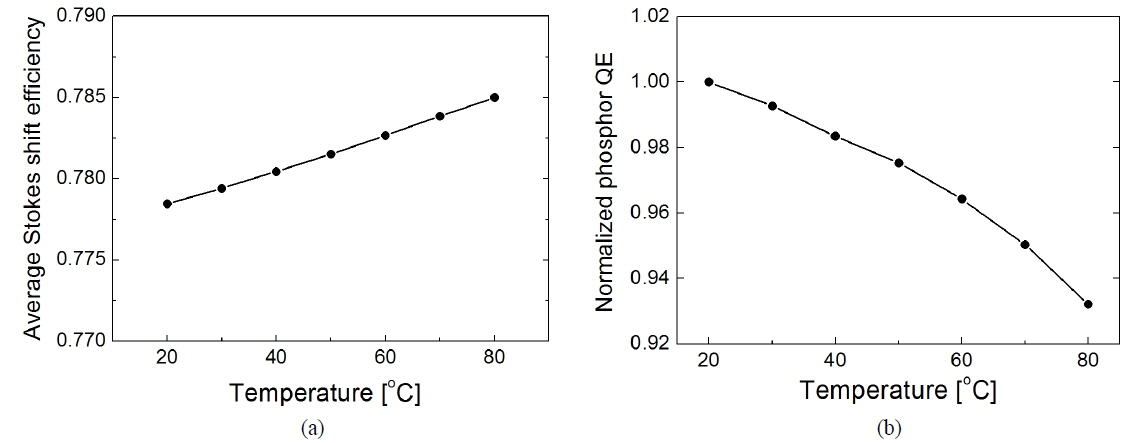
The spectrally averaged Stokes-shift efficiency at temperature

Combining Eqs. (2) and (3) yields the following relation:
Here
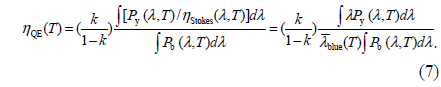
Eq. (7) allows one to determine the temperature dependence of
In Fig. 4(a), of the measured LED sample is plotted as a function of temperature using Eq. (5). It increases from 0.778 to 0.785 as temperature increases from 20 to 80 ℃. The increase of the Stokes-shift efficiency with temperature mainly results from the blueshift of with increasing temperature; however, the relative increase of from 20 to 80 ℃ is less than 1%. In Fig. 4(b), using Eq. (7)
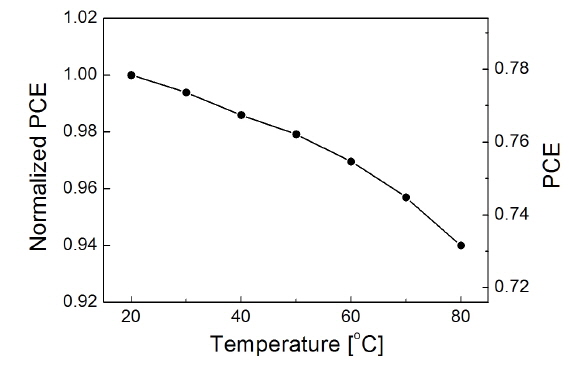
The temperature dependence of the PCE is determined using the results shown in Fig. 4 for the temperature dependence of Stokes-shift efficiency and of phosphor QE. Figure 5 shows the PCE as a function of temperature. The left vertical axis of the graph represents PCE normalized to its value at 20 ℃. The normalized PCE decreases to 94% at 80 ℃, which is a little higher than the normalized QE because of the slightly increasing contribution of the Stokes-shift efficiency with temperature. Comparing the approximately 6% decrease in PCE to the approximately 4.5% decrease in WPE over the temperature range from 20 to 80 ℃, the contribution of PCE to the temperature dependence of the white LED can be more important than that of WPE. The right vertical axis represents the absolute PCE, assuming that the phosphor QE at 20 ℃ is 100%; this is the upper limit of PCE. This upper limit of PCE is 77.8% at 20 ℃ and decreases to 73.2% at 80 ℃. PCE decreases linearly from 20 to 50 ℃, then decreases more rapidly for higher temperatures.
The temperature dependence of the LE of the studied white LED sample, as shown in Fig. 2, can be explained by combining the results for the temperature dependence of WPE of the blue LED chip from Fig. 3 and that of the PCE from Fig. 5. For temperatures lower than 50 ℃ the LE decreases only slightly, due to the stable temperature dependence of the WPE. When the temperature is higher than 50 ℃, LE decreases rapidly with increasing temperature because both WPE and PCE decrease superlinearly. The relative contributions of WPE and PCE to the temperature dependence of LE are similar to each other in this relatively high temperature range: From 50 to 80 ℃, WPE and PCE decrease by 4.4% and 4.0% respectively. The result of the PCE analysis in this section shows that the temperature-dependent conversion efficiency of the phosphor material plays an important role in the temperature dependence of LE in white LEDs. This method of PCE analysis can be used to carry out a comparative study of the temperature stabilities of various phosphor materials for LEDs. Developing an LED phosphor with increased temperature stability is expected to lead to greatly improved thermal characteristics of white LEDs used for general lighting.
We investigated the temperature dependence of the PCE in a phosphor-conversion white LED, which consists of a blue LED chip and a yellow phosphor. The spectral data for a white LED sample were used to analyze the temperature dependence of the PCE. When PCE was decomposed into the Stokesshift efficiency and the phosphor QE, the Stokes-shift efficiency was seen to increase by less than 1%, whereas the phosphor QE decreased by about 7% as the ambient temperature increased from 20 to 80 ℃. This implies that the temperature dependence of PCE is mainly influenced by that of phosphor QE. In addition, when the temperature dependence of the WPE of the blue LED chip inside the white LED and that of the PCE were compared, WPE and PCE were observed to decreased by about 4.5% and 6% respectively in the temperature range 20 to 80 ℃. That is, the contribution of the phosphor to the temperature dependence of the white LED could be more important than that the contribution of the blue LED chip. The methods to determine the temperature dependence of PCE presented in this paper can be advantageously employed to analyze the efficiency and temperature dependence of an LED phosphor.