Three-dimensional scanning technologies have been developed in automotive applications. Currently three-dimensional printing machines have become more popular than before. The growth of three-dimensional imaging systems allows reduction of the time and cost for making a prosthetic appliance because the CAD/CAM (Computer-aided design and Computer-aided manufacturing) system including a 3-dimensional imaging system performs faster without intermediate steps. New digital technologies are beginning to streamline the dental implant workflow, simplifying the delivery for the dental implant team. [1]
In particular, the dental implant is one of the most significant developments in dentistry during the past two decades. Today, the dental implant is becoming the standard of care to replace missing teeth. However there have been some limitations. The lack of engineering in the delivery of the dental implant has paved the way for the new frontier of dental implants. [1-5]
Hence, 3-dimensional scanning technology is not only expected to be used for dentistry but also to be applied for other medical fields. In particular, many researchers reported that various fringe projection methods were applied for getting three-dimensional images. In the case of the fringe projection method, micro display or illumination parts can be needed to project on the teeth and reflective powder also can be needed depending on the light source. [1-5] The fringe projection method is not appropriate for scanning a small region of the inner mouth because a beam projector is needed to project patterns onto teeth. A beam projector has more complex structure and system performance, and user convenience can be restricted by total weight and resolution of displays. For a more accurate image, a powder sometimes was used with a particular light source. It is not evitable that cost and time are increasing for scanning teeth. Another method introduced in this market is to use a stereographic system. Since the stereographic method uses two lens groups to get a depth map, alignment between the two lens groups and performance difference become more critical. Also, mechanical size should be reduced because front size of the header might be increased with two lens groups. Therefore, we need an idea to improve user convenience and to decrease time and cost when getting an accurate 3-dimensional image. [6-8]
In this paper, our system consists of two lens groups for a stereographic method to provide a deep depth of focus. Increasing the resolution of the image sensor can provide more accurate depth information of objects. For convenient usage, we introduce a new concept to make a smaller size. Our system applied two optical components and two sensors. A parallax phenomenon was used for getting a three-dimensional image.
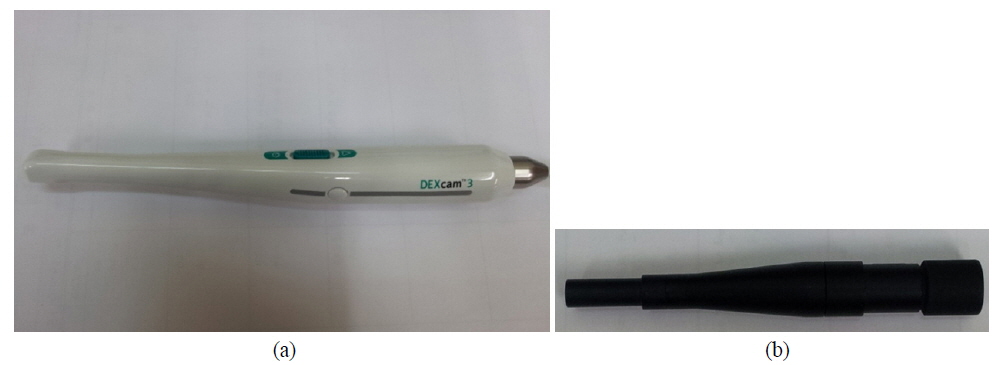
In order to squeeze out an idea for three -dimensional imaging systems, we analyzed a normal dental imaging header. Here, a dental imaging header was used to magnify teeth inside a mouth. So, its shape should be fitted for convenience. The inserted part should be small. Fig. 1 represents a dental imaging header that has been selling on the market. The resolution is VGA (640x480, NTSC output format). The reason why this dental imaging header was chosen is that it has the smallest header size among products sold in dentistry.
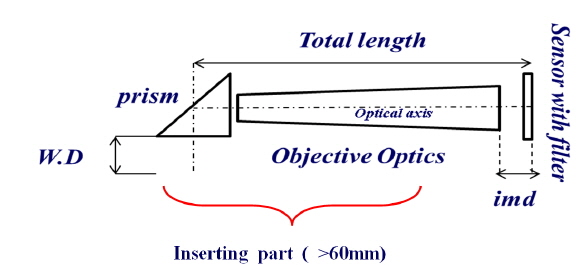
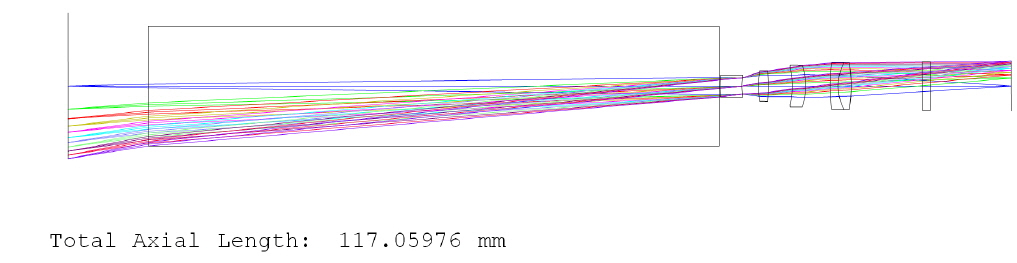
What we look at carefully is how to reduce the front size of the imaging header. Fig. 2 represents the optical layout of the dental imaging header shown in Fig. 1. They use a certain optical structure called relay lens system. In the optical field, a relay lens was used for microscope or rifle sights, etc. The reason why a relay lens system was selected for this system is to reduce a front lens size and to fit the shape of the header for handling this device inside a mouth. For convenience, however, the relay lens system has some disadvantages. For instance, a ghost problem may be generated at intermediate image position, and total length is so long that assembly can be more difficult.
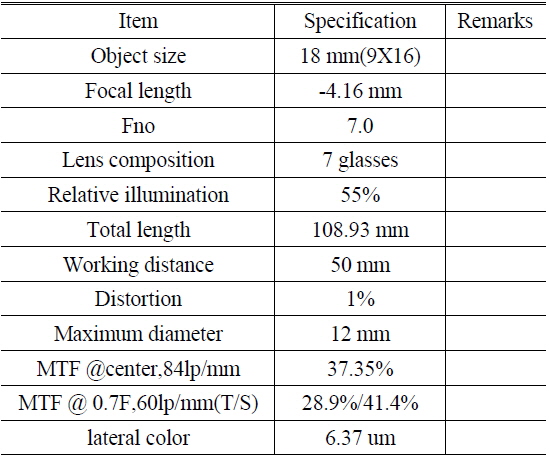
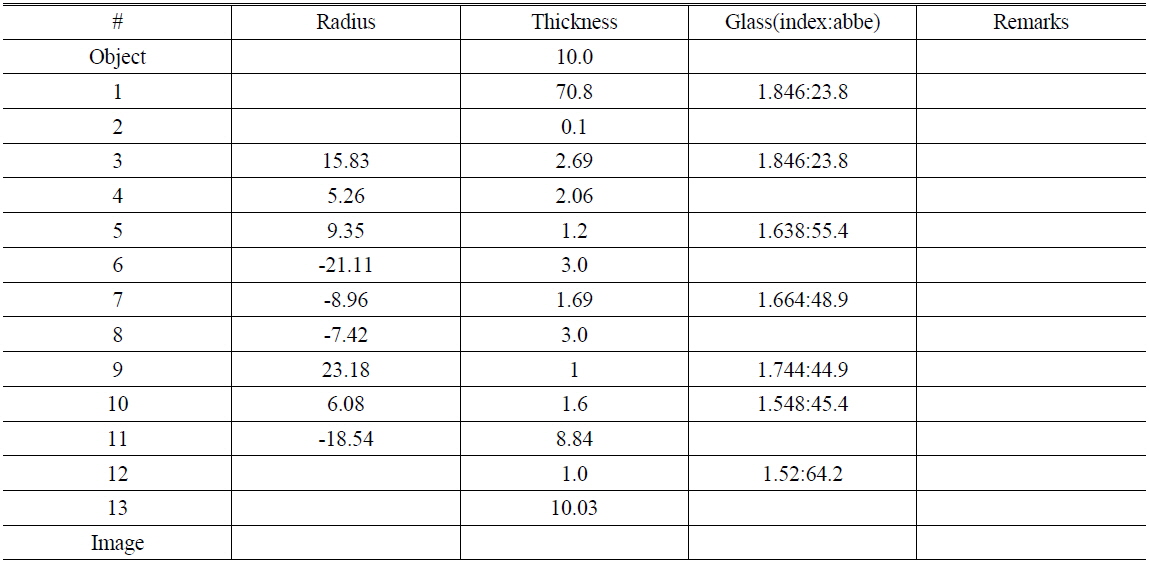
The analyzed lens specifications are listed in Table 1. F/# is 7.0 and their composition is 7 glasses. The maximum diameter of the lens system depends on the outer diameter of the 5th lens. The outer diameter of the 5th lens is 12 mm and the resolution of this lens is not enough to meet the requirements for HD sensor. We also need to reduce the 5th lens aperture size because maximum aperture size affects overall size of the device. And if we use two relay lens systems for a three-dimensional imaging system, the front size of the header is doubled to an outer diameter of the first lens. Based on a current relay lens design, the front size will be expected to be 20 mm since an outer diameter of the first element is 10 mm. It is difficult to place inside a mouth because the front size of the header depends on the size of the first lens.
[TABLE 1.] Specification and performance of relay lens

Specification and performance of relay lens
As mentioned above, we found out critical factors for a three-dimensional imaging system through the analysis of this dental imaging header. First, we have to reduce the weight of the system, so that the total number of lens elements should be reduced. Second, the front size of the system should be reduced for user convenience inside a mouth. Third, for a more accurate image, we apply a higher resolution sensor, which was defined as HD resolution, 1280×720.
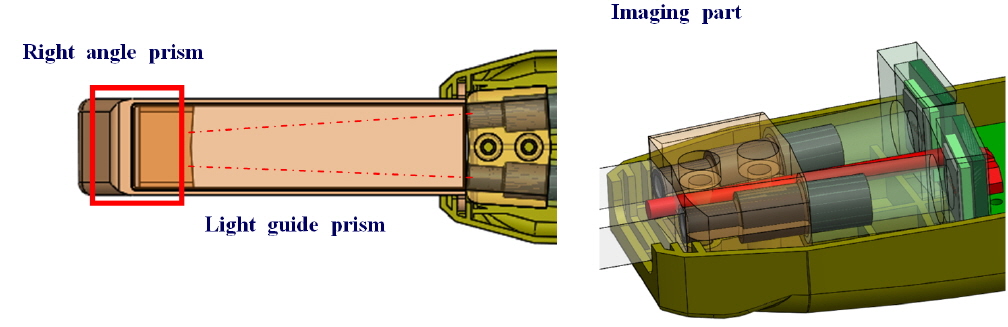
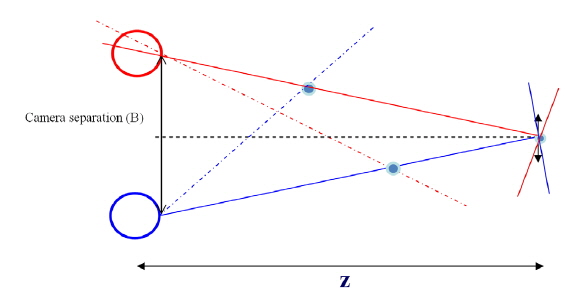
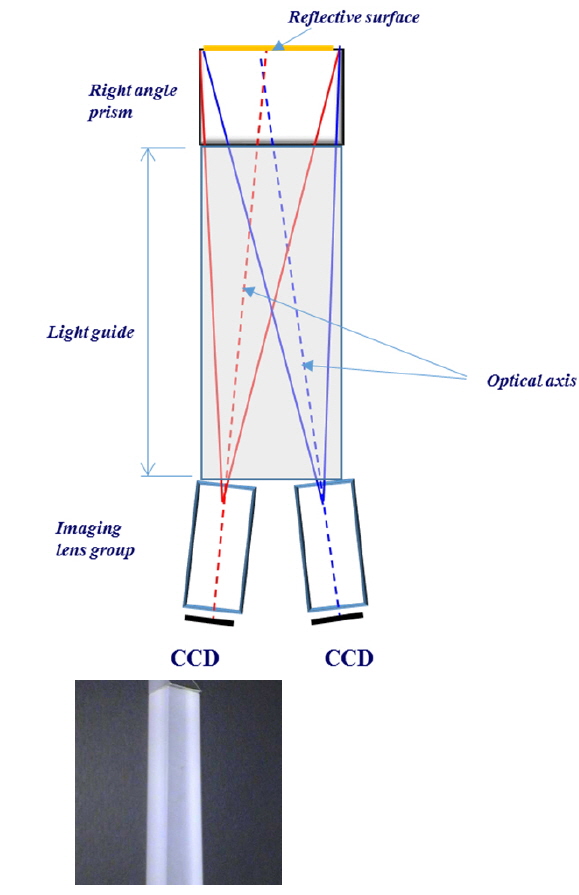
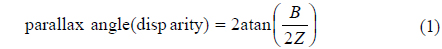
Our design approach is to divide an imaging system into two parts. The prism part and imaging part can be separated. The prism part consists of a right angle prism and light guide bar. This prism has reflective mirror surfaces and the angle between the reflective mirror surface and the optical axis corresponds to the parallax angle. Figure 3 shows a layout of the whole system designed in this research. Normally, the range of parallax angle should be from 6 to 12 degrees. Parameters to calculate a parallax angle are shown in Fig. 4. The parallax angle was determined to be 8 degrees for this system; this angle was given by eq. (1). Here, B is a distance between two cameras and Z is a distance from camera to object. The focal length of the camera is defined as
Increasing distance B between the two cameras can make a large disparity but a distorted image can be generated easily when z is not far from the object. If so, 8 degrees for parallax angle can be proper when the object distance (or working distance) is less than 30 mm.
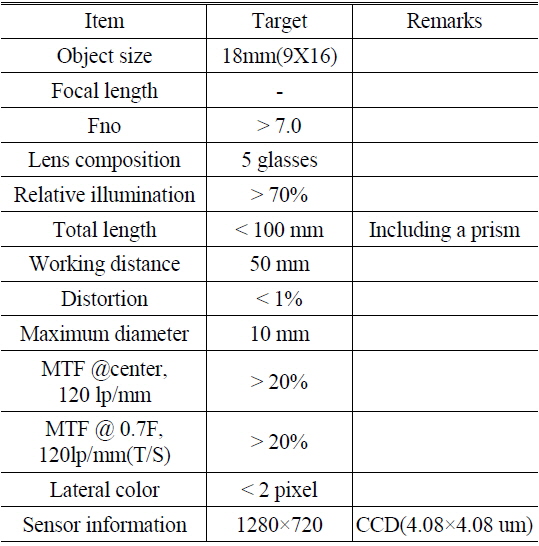
In order to make accurate images, the telecentric design was introduced for the imaging lens. The telecentric design can provide advantages for depth image because image position can be kept regardless of image position. Overall target specification is listed in Table 2. The whole system including a prism part was optimized by commercial automatic design software, ZEMAX®.
[TABLE 2.] Lens design specification for 3D intra oral scanner

Lens design specification for 3D intra oral scanner
III. MECHANICAL DESIGN AND LENS DESIGN PERFORMANCE
In this section, we analyze optical performances in the design stage and check an image quality after fabrication. As we mentioned in the previous section, two cameras are apart from each other about 8 degrees and each camera is aimed at the same point. That is called the converging type of 3-dimensional imaging system.
Therefore, a reflective surface of prism should be not normal to an optical axis of each camera. This is helpful to make a depth map easier. Figure 5 illustrates the prism shape.
Both imaging groups stick to bar light guides and bar light guides stick to a right angle prism, the large surface of which is coated with an aluminum reflector. Light guide bar and right angle prism have a high refractive index to minimize the size of the reflective surface. In this system, FDS90 was used for the prism part. As a result, we can reduce the size of the reflective surface to 14.8 mm. Figure 6 shows the mechanical design result.
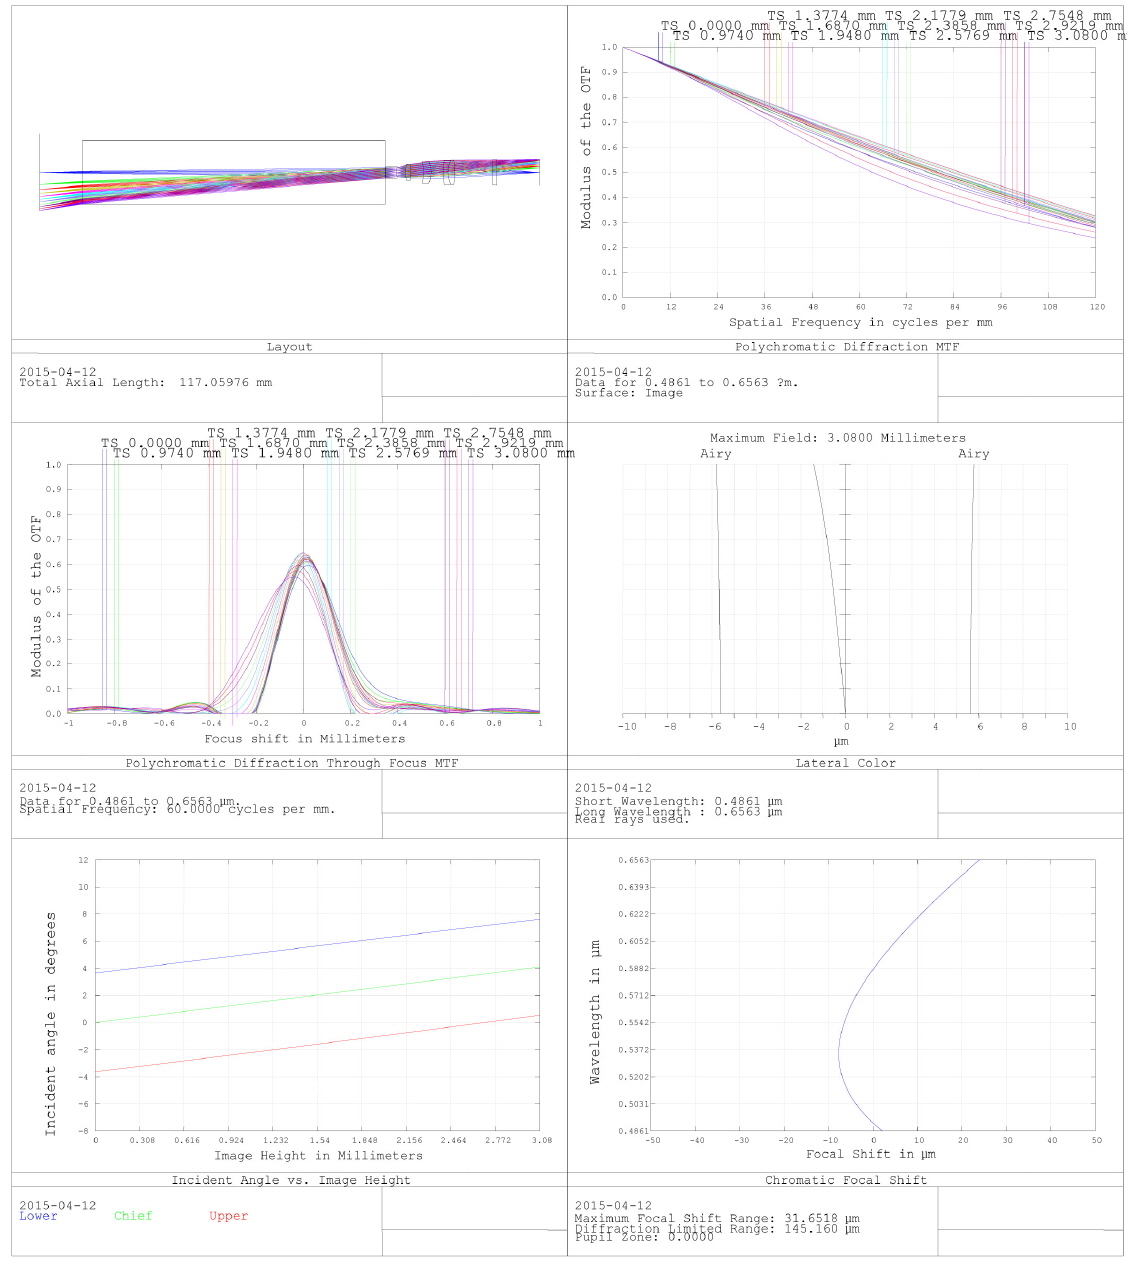
In the previous section, we introduced an image-space telecentric lens type to provide the same image position regardless of the position of the image plane. This system used a 0.9 mega pixel sensor (total pixel arrays: 1280×720), pixel size of which is 4.08×4.08 um. To estimate an image quality, MTF should be calculated at 120 lp/mm. Figure 7 represents that this lens achieves good image quality compared with criterions, which are listed in Table 2. Lateral color is corrected within 1 pixel (maximum value is 1.14 um).
The maximum of chief ray angle across the full field is 4.09 degrees at the sensor corner. Longitudinal color aberration is corrected well within 25 um.
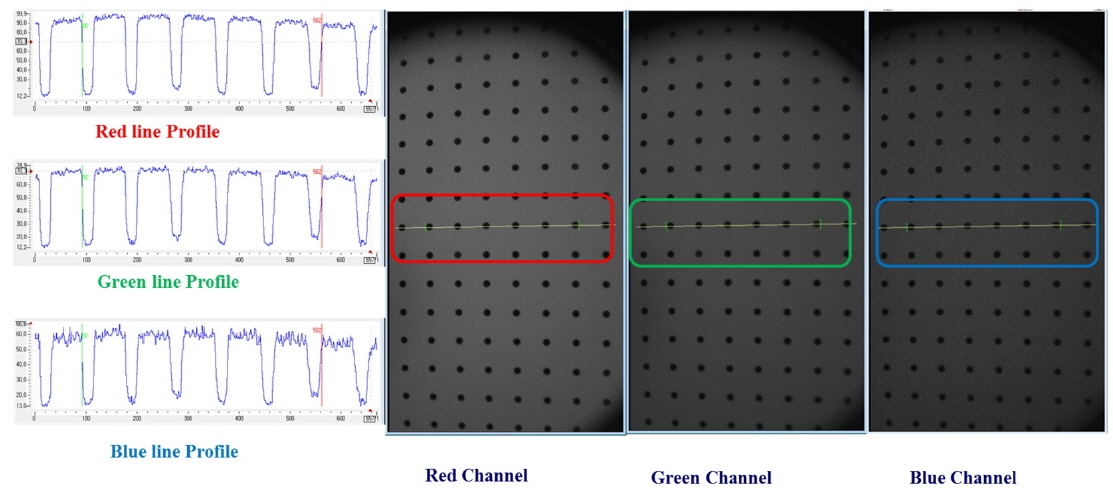
Our system is fabricated and evaluated by some tests. In this system, the depth of focus and color difference are very important to make a depth map. Color differences can be measured by a special chart. The simplest method is a comparison among the intensity profiles of each color channel. So, we applied a dot chart to take images as in Fig. 8. The intensity profile can be taken from an analysis tool. Figure 8 represents that our scan header has no color difference.
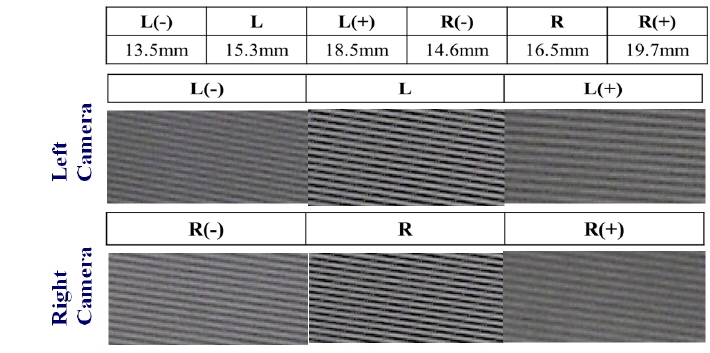
The DOF (depth of focus) also was estimated by moving a chart with respect to the z-axis. As a result, there are some differences of DOF between the two cameras but the difference can be corrected by an algorithm.
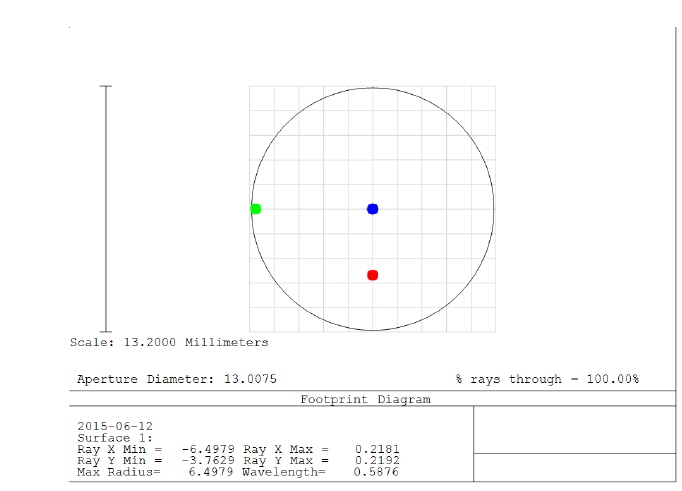
Figure 9 shows relative z-value maintains a sharp image while the scanner header is moving down or up. Both cameras have a wide range of over 3 mm. And we analyze a footprint to check how the ray bundle strikes on the reflective surface of the prism in Fig. 10. The position of the beam bundle at the corner field is 13.0 mm at the horizontal direction.
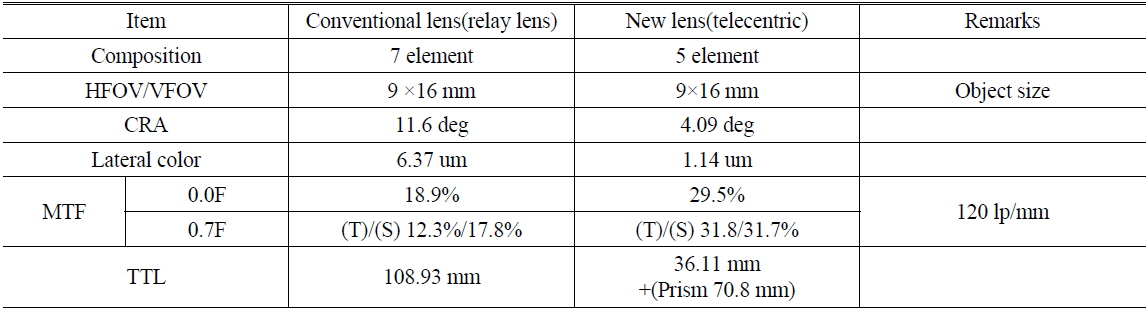
Table 3 and Table 4 show the list of a lens prescription and a summary with comparison between the relay lens and telecentric lens, respectively.

Lens prescription
[TABLE 4.] Performance comparison

Performance comparison
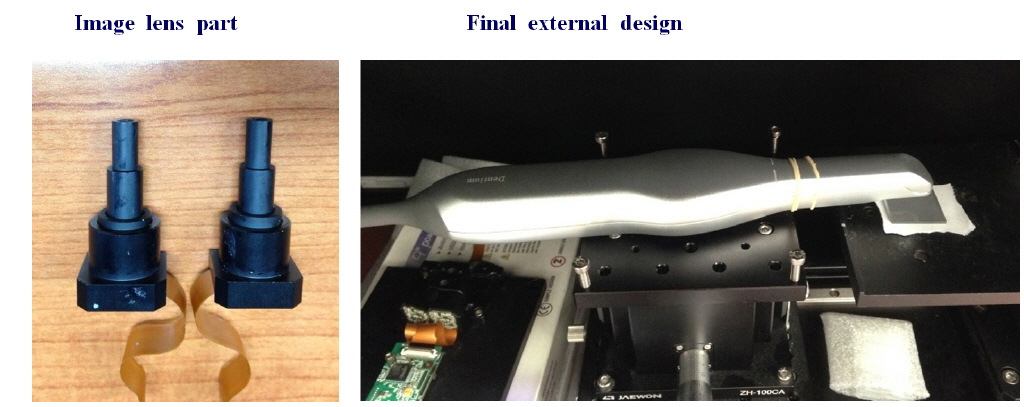
Figure 11 shows images of the final product. The left side picture is the imaging lens group and the right side picture is the final scan header after assembly.
The scan header for intra-oral 3D scanner was designed and fabricated with the development of the image-space telecentric lens since it has some advantages for three-dimensional image system such as dental application. We introduce a new layout separating optical parts into two parts. For convenient usage, we have to reduce the front size of the header, and lens composition also should be simpler. Only 5 glasses are used for the imaging lens group, and a prism part including a light guide bar is an efficient idea to reduce a front size. The front size is expected to be 20 mm with a conventional lens, but our system can provide a smaller size as much as 14.8 mm at the horizontal direction. Lens performance meets with most specifications for HD resolution. DOF (Depth of Focus) is measured to be as much as 3 mm. The lateral color is corrected within 1 pixel. As a result, a prism part and a telecentric lens are suitable for the three-dimensional scanner header. In the future, we will verify how much this system improves the accuracy of images with this scanner header.