Digital holography [1-3] is a promising technique for recording holograms digitally, typically via a CCD camera, and reconstructing them numerically. This technique has been successfully applied in various areas such as digital holographic microscopy [4-6], phase-contrast imaging [7], and encrypting information [8]. One application of digital holography is digital holographic optical coherence imaging (DHOCI), which uses a low-coherence light source and acquires
When imaging biological targets with DHOCI, the simultaneous illumination in multiple optical modes gives rise to dynamic speckle. Motility contrast imaging (MCI) [13] is an extension of digital holographic optical coherence imaging utilizing such dynamic speckle. MCI uses fully developed speckle fields that carry little structural information. This is in sharp contrast to OCT, which seeks to eliminate speckle to achieve the highest possible spatial resolution [12]. The speckle fields of MCI arise from the interference of multiple scatterers with random phases within a coherence volume inside the tissue. The holographic coherence gate localizes the detected motion to within a thin slab inside the tissue, with a thickness determined by the coherence length of the laser. Using this approach, nanoscale motion has been sensed as deep as 1 mm inside tissue, localized within 30-micron volumes (voxel size corresponding to the spatial resolution) across a field of view of 1 mm.
In light scattering from living tissue, a dynamic speckle reflects a mixture of different types of motion arising from biological scatterers, such as nuclei, organelles, and the cell membrane. The motion can be driven by molecular motors which use the energy from repeated cycles of ATP hydrolysis in metabolic activity. The motion can also be driven by cell movement during mitosis in which the entire cellular structure is reorganized prior to and during division. The resulting fluctuation spectrum of the dynamic speckle in MCI can be used to establish the specificity of different types of motion because different types of motion have different types of cellular functions.
One of the many possible applications of MCI is to image the effects of the largest class of anticancer drugs [13],
Apoptosis is the end state of many of the cytoskeletal and motility-inhibition drugs. If mitotic arrest lasts too long, or if cellular adhesions are disrupted and not allowed to reform, or if microtubule-associated protein concentrations are altered too much, then apoptosis is induced. The apoptotic response can be dramatic, with increased membrane permeability leading to edema and associated changes in cell shape, plus increased vesicle traffic as intracellular proteins are degraded by proteases and transported out of the cytosol. For these reasons, apoptosis can be a component of the motility studies, defining baselines prior to application of drugs, and participating in the end-state motility contrast after drugs are applied. To isolate the apoptotic motility contrast signature, apoptosis-inducing drugs can be applied that lead the cell into apoptosis without directly altering the cytoskeleton.
In this paper, we apply motility contrast imaging to study the effect of environmental perturbations and to screen the effect of drug combinations and an apoptosis-inducing drug, showing MCI’s potential for application in high-throughput drug testing. For this study the targets are multicellular tumor spheroids, which are the most commonly used three-dimensional cell culture systems, due to their advantages and potential for rapid development in the application of high-throughput drug screening [16-18]. A brief description of motility contrast imaging is given in section 2, including the experimental set-up for DHOCI, the numerical reconstruction of the digital hologram, and the principle of motility contrast imaging using dynamic speckle. The environmental perturbations to the tissue by changes in temperature and osmolarity are presented in section 3, followed by the screening of drug combinations and an apoptosis-inducing drug in section 4.
II. EXPERIMENTAL SYSTEM AND ANALYSIS
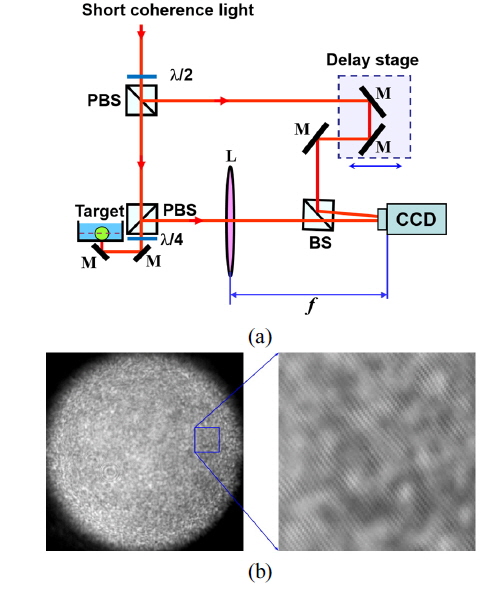
The MCI system shown in Fig. 1(a) is composed of an imaging Mach-Zehnder interferometer using a short-coherence light source and a digital image recorder. A mode-locked Ti:sapphire laser (pulse duration 100 fs, repetition rate 100 MHz) was used as the short-coherent light (center wavelength 840 nm, bandwidth 17 nm). Short-coherence light passes an initial polarizing beam splitter (PBS) to produce a vertically polarized object beam and a horizontally polarized reference beam. Using a half-wave plate before the first PBS, we control the beam ratio of the object beam to the reference beam. A quarter-wave plate behind the second PBS ensures that the backscattered object beam is horizontally polarized after returning through the quarter-wave plate.
Lens L performs the Fourier transform on the backscattered object beam, and a digital hologram is captured by a CCD camera at the Fourier plane, where the object beam interferes with the reference beam that passes through the delay stage in the reference arm. Longitudinal scanning is performed by translating the delay stage with a stepper motor. The typical power of the object beam for tissue is 5 mW, with a diameter of 1 mm. A 12-bit CCD camera with 1-megapixel resolution is used with an exposure time of 10 ms.
A typical digital hologram is shown in Fig. 1(b), which was captured by the CCD using a rat tumor spheroid as a target. The enlargement of the rectangular section shows interference fringes between reference and object waves. The contrast of the interference pattern is weak because of high scattering by the living-tissue target, making the background much brighter than the interference fringes.
2.2. Digital Hologram Reconstruction
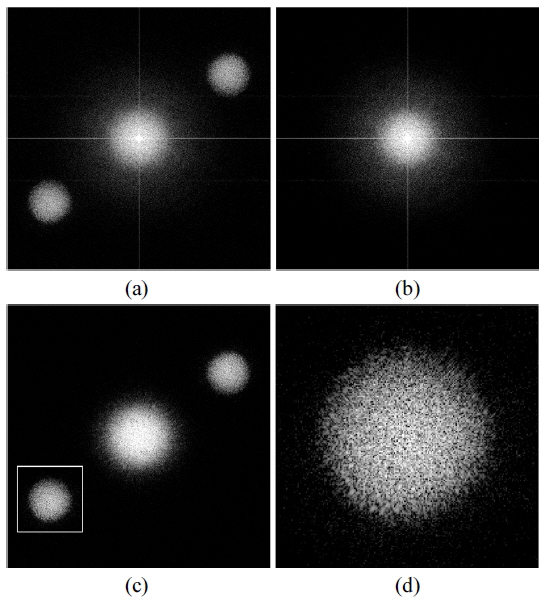
A digital hologram captured at the Fourier plane requires only a two-dimensional fast Fourier transform for numerical reconstruction. A numerical reconstruction of the digital hologram in Fig. 1(b) is shown in Fig. 2(a). The reconstructed image consists of three components: a zero-order image, a real image, and a conjugate image. The three components are spatially separated in the reconstructed image, but overlap in the margins between each component. The zero-order of a healthy tumor spheroid 600 μm in diameter. image is the main background in DHOCI, and can be suppressed by subtracting a non-zero-path-matched digital hologram from the zero-path-matched digital holograms. Figure 2(b) is a numerical reconstruction of a non-zero-path-matched digital hologram and Figure 2(c) is the zero-order suppressed image. Note that the zero-order image in Fig. 2(c) is not completely suppressed because of the time-varying zero-order image due to the dynamic living-tissue target. The real image is the same as the conjugate image, except for its spatial location and the opposite sign in its complex-conjugate value. Therefore, we select only the real image area for the data analysis shown in this paper. The image in Fig. 2(d) is the enlargement of the real image in Fig. 2(c).
2.3. Motility Contrast Imaging
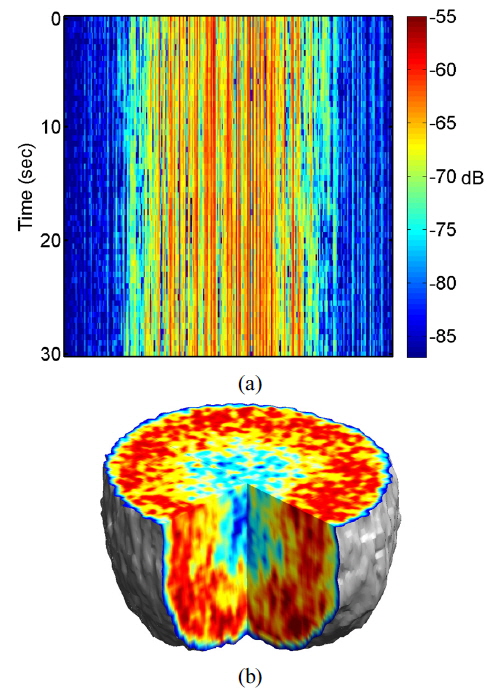
Multimode illumination of the tissue samples generates fully developed speckle that is sectioned in three dimensions, based on optical path length. In live samples the speckle is highly dynamic, and subcellular motions provide imaging contrast that differentiates the outer proliferating shell of a tumor from its hypoxic, or necrotic, core. A direct measurement of dynamic speckle is obtained by capturing successive images of the tumor at a fixed depth. The resulting data format of the digitally reconstructed images is a set of time-dependent two-dimensional intensity data
For image representation in MCI, the normalized standard deviation (NSD, as known as temporal speckle contrast) is computed as
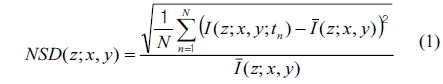
where
It is important to consider the precondition prior to application of environmental or xenobiotic challenges, because cells are constantly responding to their external and internal environments by changing their gene expression and molecular signaling. It is possible to establish initial conditions of motility for a drug-response study, even though the proliferating and metabolic status of living tissue is complex and difficult to define precisely. The initial motility of the tissue in the proliferating shell and the necrotic core is quantified using an average NSD value. We average NSD values of the proliferating shell (within a thickness about 150 μm from the perimeter) and the necrotic core. The average NSD ranged from 0.7 to 0.8 for the proliferating shell and from 0.45 to 0.55 for the necrotic core of healthy tumors at 24 °C, averaging over about 30 tumors.
III. ENVIRONMENTAL PERTURBATIONS
Cellular motility is sensitive to subtle changes in the tissue environment. In this section, we survey motility contrast imaging for measuring the response of tissue perturbed by environmental stimuli, such as changes in temperature and osmolarity. The motility contrast is changed by temperature because cellular activity and Brownian motion depend on temperature. The MCI system can feature an environmental chamber with temperature control, to allow experiments to be performed at biological temperatures. The culture temperature affects intracellular metabolism as well as cellular activities such as cell proliferation and glucose metabolism [19]. Temperature can be used to control microtubule dynamics, because low (room) temperature shifts the equilibrium of the tubulin polymerization reaction towards high concentrations of free tubulin in cells.
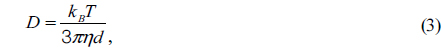
A number of organelles in the cytoplasm move randomly by Brownian motion. The movements of a Brownian particle can be measured by the mean square displacement 〈(

where

where
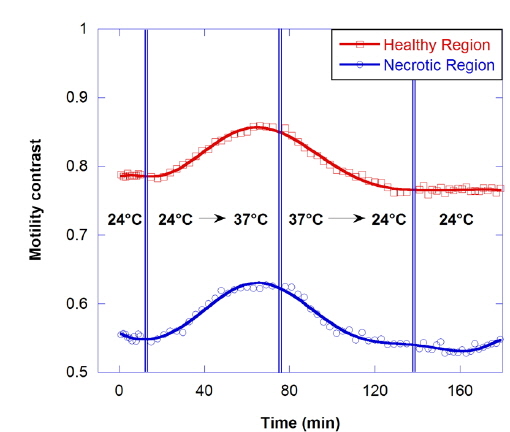
The motility contrast in response to thermal change is shown in Fig. 4, as the temperature is increased from 24 to 37 °C and then decreased to 24 °C. The motility contrast is acquired at a fixed depth of 350 μm for the healthy and necrotic regions of a healthy tumor 750 μm in diameter. Heating to physiological temperature from room temperature is accompanied by a large increase in motility contrast, because cellular functions are normally activated and Brownian motion increases at physiological temperature. In the graph the motility contrast value increases with increasing temperature from 0.79 to 0.86 for the healthy region and from 0.55 to 0.62 for the necrotic region. In contrast, initial motility contrast is almost restored by cooling to room temperature from physiological temperature.
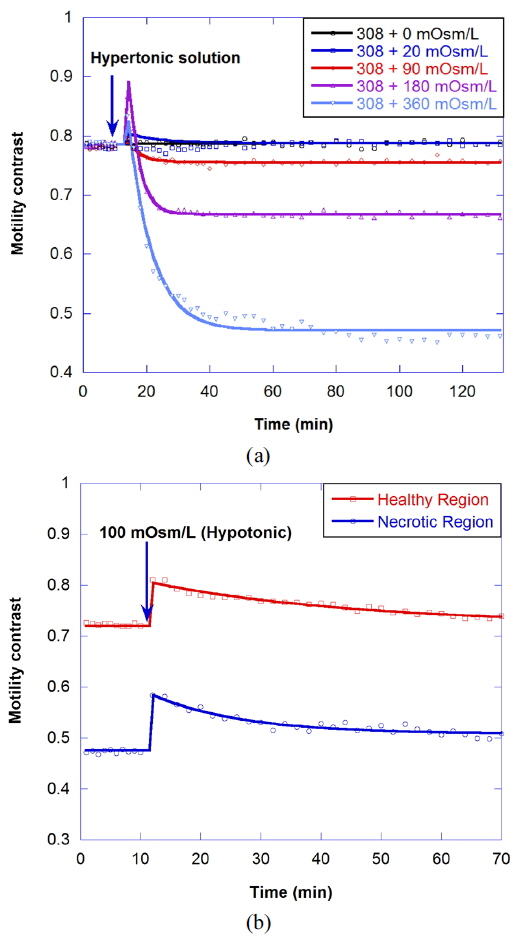
Osmosis causes water to flow out of the cell or into the cell, resulting in the change of cellular motility or Brownian motion in the cell by a decrease in cell functioning or by a change of viscosity. A cell in a hypertonic environment experiences a higher concentration of solutes in the environment than in the inside of the cell, causing a net flow of water out of the cell. The opposite of hypertonic is hypotonic, where the net movement of water is into the cell. The osmolarity of growth medium for the tumor spheroids was adjusted to be 308 mOsm/L. To evaluate correlation of motility with osmolarity, we perform time-course motility contrast imaging for healthy tumors by replacing the growth medium with four different hypertonic solutions and one hypotonic solution at 10 minutes, as shown in Fig. 5. The motility contrast in Fig. 5(a) is only for the healthy region. The change in motility contrast for the 328-mOsm/L solution is negligible, while the motility contrast in other hypertonic solutions decreases with increasing concentration. The motility contrast in the 100-mOsm/L hypotonic environment increases slightly, which may result from decreased viscosity or shape changes in cells as they swell.
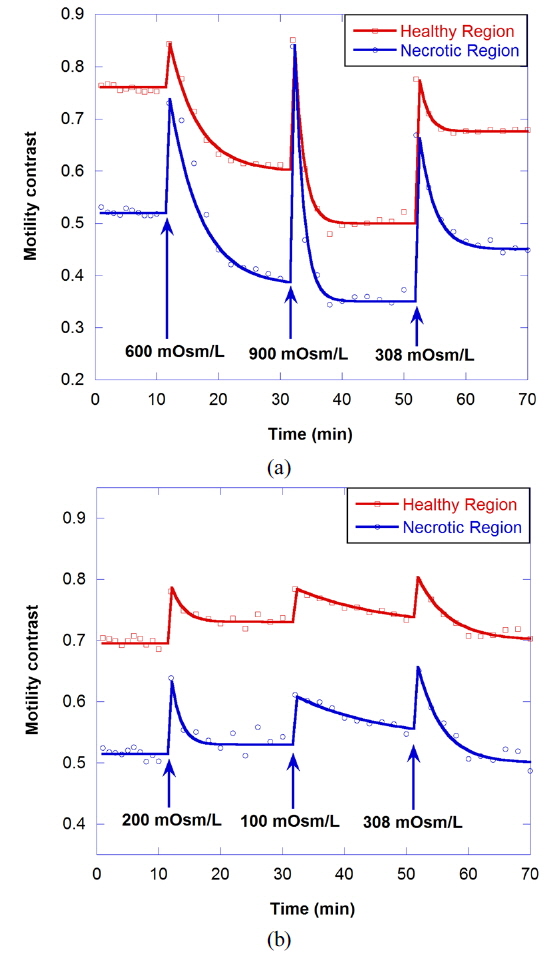
Figure 6(a) shows the motility changes for the healthy and necrotic parts of a healthy tumor, which are obtained with the consecutive treatment with solutions of 600, 900, and 308 mOsm/L, while Figure 6(b) is for the treatment with 200, 100, and 308 mOsm/L solutions. In Fig. 6(a), the decrease of motility in the necrotic area results from the shimmering showerglass effect. The graph shows that motility is not fully recovered by treatment with isotonic growth medium after treatment with hypertonic solution. This may result from death of some of the cells, or a decrease in cell function in the hypertonic environment. In the case of treatment with isotonic growth medium after the hypotonic solution, however, the initial motility is recovered, as shown in Fig. 6(b), which indicates that healthy cells can survive in the 100-mOsm/L hypotonic solution for at least an hour.
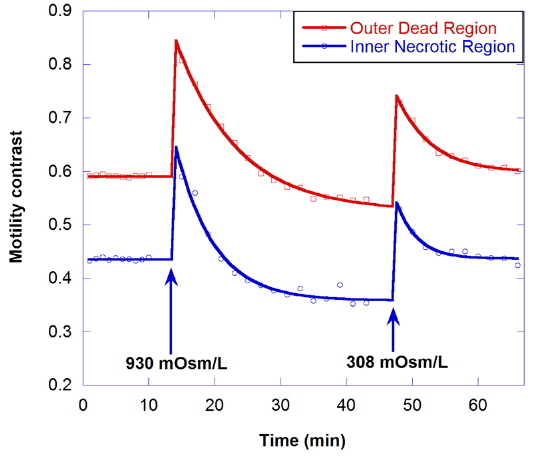
The effect of hypertonic solution on motility is investigated for a dead tumor, as shown in Fig. 7. The growth medium for the dead tumor is not replaced for one month after its removal from the bioreactor. Note that the initial motility for the outer dead region is low (about 0.59), compared to that for healthy tumors. In the graph, the decrease of motility by treatment with 930-mOsm/L solution is small, and the initial motility is recovered by treatment with isotonic growth medium after the hypertonic solution.
IV. SCREENING DRUG COMBINATIONS
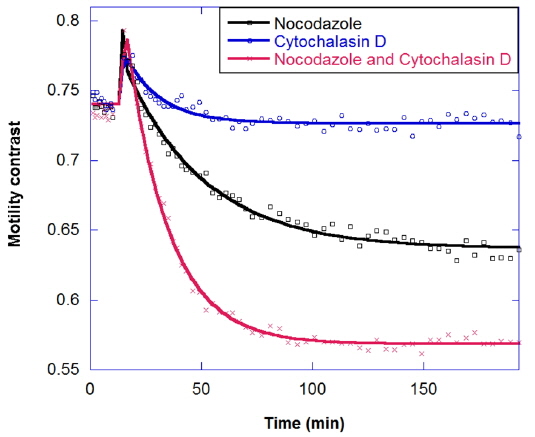
In drug combinations, the combined effect is synergistic relative to the individual responses. The goal of combination is not just to reduce the concentration of a single drug, but also to apply drugs that have different effects on different cellular functions. The response of tumors to combinations of the antimitotic drugs nocodazole and cytochalasin is shown in Fig. 8. Nocodazole is an antimicrotubule drug that inhibits the polymerization of microtubules [20]. Micrcotubules are required for cellular mitosis, but they also play important roles in the cytoskeleton, in distributing stresses and supporting organelle transport [21]. Meanwhile, Cytochalasin D is an antiactin drug [22]. Actin is also a part of the cellular cytoskeleton and plays an import role in the stiffness of the cell membrane. Actin forms a cortex of interlinked filaments inside the cell membrane that helps give it rigidity. Cytochalasin D inhibits the polymerization of the actin filaments, and the cortex degrades, leading to a floppier cell membrane. In Fig. 8 the decrease in motility contrast for 10 μg/ml cytochalasin is lower than for 10 μg/ml nocodazole, and healthy tumors show a synergistic response to drug combinations, rather than an additive response.
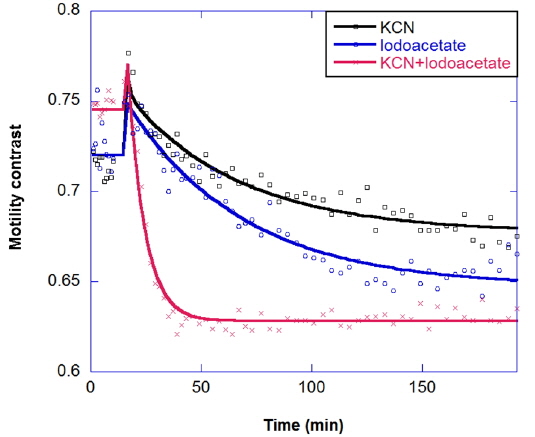
Multicomponent response can be important in the study of drug combinations. Two-component responses have been observed for a metabolic drug combination of potassium cyanide plus iodoacetate in the long-time kinetic response of tumors. Potassium cyanide (KCN) is a potent inhibitor of cellular respiration, acting on mitochondrial cytochrome oxidase and hence blocking electron transport, which decreases oxidative metabolism and oxygen utilization. Iodoacetate is a glycolytic inhibitor that depletes ATP by inhibiting glycolysis [23]. The combination response is shown in Fig. 9; the combined effect is synergistic, relative to the individual responses.
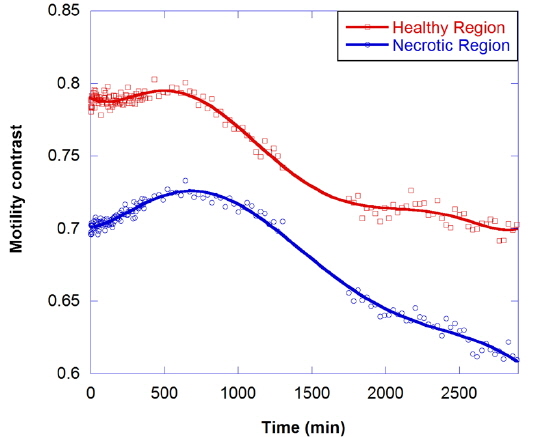
In healthy tumor spheroids, the cells on the inside of the proliferating shell are typically apoptotic because of oxygen and nutrient stress. Even within the necrotic core, there can be high densities of individual apoptotic cells or rafts of them. To isolate the apoptotic motility contrast signature, an apoptosis-inducing drug is applied to send the cell into apoptosis without directly altering the cytoskeleton. The most common apoptosis-inducing candidate is the cytokine tumor necrosis factor (TNF) [24]. An experiment using TNF is shown in Fig. 10, where the upper curve shows the response of the healthy shell and the lower curve shows the response of the necrotic core. The results show an anomalous response in which the motility of the proliferating shell is not altered significantly over several hours, but the motility of the necrotic core increases. This is opposite to the results of the other kinetic-response experiments, both metabolic and cytoskeletal, in which the motility of the outer shell decreases more than that of the core. Over a short period of several hours, TNF has a larger effect on cells already apoptotic or on the verge of being apoptotic than it does on healthy cells. The core, with its higher concentration of apoptotic cells, therefore responds more than the shell. In the long term, motility in both tissues is suppressed.
Motility contrast imaging detects dynamic speckle from living tissue using digital holography. It detects subcellular motion in living tissue as a fully endogenous imaging contrast agent. Three-dimensional imaging assays of antimitotic cancer drugs extract label-free functional signatures in tumors. In this paper, we have shown that the fluctuation response of living tissue can be tracked through motility contrast imaging as environmental perturbations and drug combinations are applied. We have tracked the behavior of cellular functions in 3D tissue spheroids responding to various environmental and pharmacological perturbations.
The emphasis in this paper is on the possibility of tissue-response screening under environmental perturbations and drug combinations, using the unique features of MCI to image actual changes in mechanisms. However, there are many possibilities and alternatives to explore with MCI. MCI is not intended to compete with or replace conventional microscopic motility studies. Conventional microscopy can be used to validate the subcellular pharmacological effects of drugs; MCI is a macroscale biomedical optical imaging approach that can detect subcellular mechanisms without requiring microscopy. The label-free character of motion as a contrast agent, the sensitivity and specificity of motion to cellular function, and the three-dimensional access to tissue properties far from surface effects, make motility contrast imaging an attractive candidate for high-throughput label-free screening of drug candidates.