Light is a potent environmental factor with several informative characteristics—quality (spectra or wavelength), quantity (intensity), and periodicity (photoperiod)—that have a profound effect on the physiological function in fish such as reproduction and growth (Boeuf and Le Bail, 1999). Among these characteristics, periodicity is a crucial determinant of reproductive success in fish and its importance in the initiation and termination of gonadal development has been studied extensively (Bromage et al., 2001; Pankhurst and Porter, 2003). In fish, sexual development and gonadal maturation are regulated by hormones of the hypothalamus-pituitary-gonad (HPG) axis, including gonadotropin-releasing hormone (GnRH), and other neurohormones, gonadotropins, and gonadal steroid hormones and peptides (Lee et al., 2001). GnRH regulates the secretion of both gonadotropins—luteinizing hormone (LH) and follicle stimulating hormone (FSH)—and acts as a key neurohormone in vertebrate reproduction (Roch et al., 2011).
Besides, a neurohormone named kisspeptin (Kiss), a member of the Arg-Phe (RF)-amide peptide family, was identified recently; it, along with GnRH, is known to regulate gametogenesis and spawn time in fish via the activity of the HPG axis (Funes et al., 2003; Seminara et al., 2003). Two isoforms of Kiss are found in the brain of teleosts and other vertebrate species (Lee et al., 2009; Um et al., 2010); further, two paralogous genes of Kiss were named as Kiss1 and Kiss2 according to the order of their discoveries. In the hypothalamus, Kiss, its receptor, G protein-coupled receptor 54 (GPR54), and GnRH neurons are located in close proximity and regulate puberty (Colledge, 2009; Roa et al., 2011). In addition, the KISS1-GPR54 signal system is known to regulate reproduction by controlling GnRH secretion from the hypothalamus (Roa et al., 2011).
In 2000, an RFamide-type neuropeptide, gonadotrophin inhibitory hormone (GnIH), was identified; it had an inhibitory effect on pituitary gonadotrophin hormone (GTH) secretion in the Japanese quail, suggesting the presence of an inhibitory hypothalamic neuropeptide in the control of the HPG axis (Tsutsui et al., 2000). In the brain of birds and mammals, hypothalamic GnIH fibers are in close contact with GnRH neurons, and GnIH might influence the GnRH system at the neuron and fiber terminal levels. Therefore, GnIH might also act at the level of the hypothalamus to regulate gonadotropin release (Bentley et al., 2003; Ubuka et al., 2008). Besides gonadotropin release, GnIH inhibited gonadotropin biosynthesis in teleost (Ciccone et al., 2004; Falcón et al., 2010). Zang et al. (2010) was reported that intraperitoneal administration of the mature zebrafish GnIH peptide could significantly reduce the basal serum LH level in goldfish. Thus, GnIH is considered to modulate maturation and reproduction at the level of the hypothalamus by interacting with GnRH neurons (Smith and Clarke, 2010).
The cytochrome P450 aromatase (P450arom), a steroidogenic enzyme, belongs to the cytochrome P450 superfamily and regulates the steroid hormone synthesis (Simpson et al., 1994). Further, P450arom regulates and catalyzes the conversion of C19 androgens (testosterone and androstenedione) to C18 estrogens (estrone and estradiol) and plays an important role in steroid hormone production and sex differentiation (Simpson et al., 1994). Two types of P450arom exist in fish: ovarian P450arom (mainly expressed in the ovary) and brain P450arom (mainly expressed in the brain); they are named P450aromA and P450aromB, respectively (Blázquez and Piferrer, 2004; Greytak et al., 2005).
Light, including photoperiod, is known to affect the activation and inhibition of GTH synthesis and secretion (Tsutsui et al., 2000; Smith and Clarke, 2010). Although considerable information on the effect of photoperiod on the initial development and maturation of gonad is available (de Vlaming, 1975; Bromage et al., 2001; Pankhurst and Porter, 2003), the effect of various light wavelengths on the physiological function of fish has been rarely investigated (Shin et al., 2012, 2013).
Recently, light-emitting diodes (LEDs), a new form of technology designed to output lights of specific wavelengths, such as narrow bandwidth light, were discovered; these can be tuned to the environmental sensitivity of a target species (Migaud et al., 2007). The spectral composition of incidental light is known to be differentially affected underwater, and rapid attenuation of light occurs with increasing depth (Lythgoe, 1979). Most studies used LEDs of specific wavelengths and reported that fish growth and maturation were enhanced by LED (Shin et al., 2012, 2013). However, Shin et al. (2012, 2013) reported that exposure to specific long wavelengths induces stress in yellowtail clownfish
In this study, we aimed to determine the mechanism of how exposure to various wavelengths affects the activity of reproduction-related genes (maturation stimulation and inhibitor) such as HPG axis and GnIH pathway. We determined the mRNA expression levels of Kiss1, Kiss2, GPR54, GnIH, GTHs, and two types of P450arom and steroid hormones in goldfish exposed to light from a white fluorescent bulb and those having long (red), short (green), and mixed (purple) wavelengths over a 4-month period.
>
Experimental fish and Light-Emitting Diodes exposure conditions
For each experiment, immature common goldfish (
The fish were euthanized by spinal transection at 2-month sampling intervals—2 month (GSI; white fluorescent bulb, 1.25 ± 0.16; red LED, 0.78 ± 0.21; green LED; 2.32 ± 0.34; purple LED, 1.86 ± 0.24) and 4 months (GSI; white fluorescent bulb, 1.82 ± 0.24; red LED, 1.91 ± 0.34; green LED; 5.09 ± 0.44; purple LED, 3.91 ± 0.34)—experimental period, brain, hypothalamus, ovary, and blood was collected from the 15 fish (mixed sex containing male and female) per tanks (
>
In vitro culture of hypothalamus cells and Kiss treatment
To investigate the effects of Kiss and LED light, the goldfish neurons were cultured using enzymatic and mechanical procedures. Hypothalamus tissue was rapidly removed and placed in 3 mL ice-cold dispersion buffer (Dulbecco’s phosphate-buffered saline, without calcium chloride and magnesium chloride, containing 100 U/mL penicillin, 100 μg/mL streptomycin, and 2.5 μg/mL fungizone; GIBCOBRL, Rockville, MD). The isolated hypothalamus tissues were then transferred to 6 mL of fresh dispersion buffer containing 0.25% trypsin (Type II-S from porcine pancreas; Sigma). The connective tissues and other impurities were removed, and the hypothalamus tissues were chopped into small pieces by using a pair of scissors. Hypothalamus cells and the minced hypothalamus tissue were transferred to a flask and incubated for 10 min at room temperature with slow stirring. The mixture of dispersed hypothalamus cells and tissues was filtered, and the culture medium (neurobasal medium, without ʟ-glutamine, containing 100 U/mL penicillin, 100 μg/mL streptomycin, 2.5 μg/mL fungizone, and 1% fetal bovine serum; Gibco-BRL) was added. The cell suspension was centrifuged at 800 g for 10 min, and the cells were then resuspended in fresh culture medium. Hypothalamus cells (1.2 × 10⁶ cells/800 μL/well) were applied to a 24-well tissue culture plate at 06:00 h. Fresh culture medium (600 μL) was added to the culture wells at 24 h. The temperature and photoperiod were 20 ± 1℃ and 12 h (lights on at 07:00 h), respectively.
For the experimental groups, hypothalamus cells were exposed to red (peak at 630 nm), green (530 nm), or purple mix (mixed 450 nm and 630 nm) LEDs and to light from a white fluorescent bulb (control). The LEDs were set 50 cm above the surface of the cell culture plate, and the irradiance at the surface of the plate was maintained at approximately 0.9 W/m2. The spectral analysis of the lights was performed using a spectroradiometer (FieldSpec®, ASD, Colorado, USA).
Each experimental group was treated with Kiss (metastin 45-54 amide; Sigma; 80% similarity with fish species), dissolved in 0.9% physiological saline at the appropriate doses (100 μM), and was added to the culture medium at a ratio of 1/1,000e (v/v). The temperature was maintained using the heat dissipating system of LEDs (20 ± 1℃) and photoperiod were 12 h (lights on at 07:00 h), and sampled after 48 h (12:00 h). Each sample was centrifuged (20℃, 10,000
>
Real-time quantitative PCR (RT-qPCR)
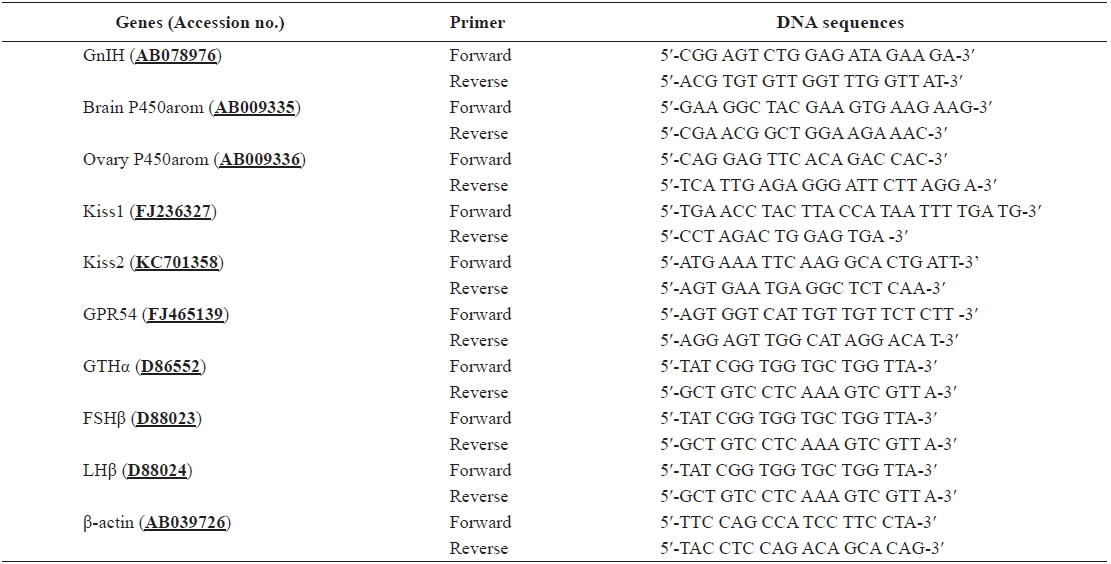
Total RNA was extracted from the brain, hypothalamus and ovary by using a TRIzol kit (Gibco-BRL, USA) according to the manufacturer’s instructions. Reverse transcription was performed using M-MLV reverse transcriptase (Bioneer, Korea) according to the manufacturer’s instructions. Real-time quantitative PCR (RT-qPCR) was performed using cDNA template to determine the relative expression levels of GnIH, P450aromA, P450aromB, Kiss1, Kiss2, GPR54, GTHα, FSHβ, LHβ, and β-actin mRNA by using the total RNA extracted from the brain, hypothalamus, pituitary, and ovary. The primers used for qPCR are shown in Table 1. The PCR amplification was conducted similar to previous work (Nelson et al., 2007), using a Bio-Rad CFX96™ Real-time PCR Detection System (Bio-Rad, Hercules, CA, USA) and iQ™ SYBR Green Supermix (Bio-Rad) according to the manufacturer’s instructions. The QPCR was performed as follows: 95℃ for 5 min, followed by 50 cycles each of 95℃ for 20 s and 55℃ for 20 s. All analyses were based on the cycle threshold (ΔCt) values of the PCR products. The Ct was defined as the PCR cycle at which the fluorescence signal crossed a threshold line that was placed in the exponential phase of the amplification curve. After the PCR program, QPCR data from three replicate samples were analyzed with analysis software of the system (Bio-Rad) to estimate transcript copy numbers for each sample. In addition, to ensure that the primers amplified a specific product, we performed a melting curve analysis, which showed that the products of each primer pair had a single melting point (only one temperature). As internal controls, experiments were triplicated with β-actin, and all data were expressed relative to the corresponding β-actin calculated ΔCt levels. The calibrated ΔCt value (ΔΔCt) for each sample (Kiss, GPR54, GTHs, P450aroms, and GnIH) and internal controls (β-actin) was calculated as: ΔΔCt = 2^-(ΔCtsample - ΔCtinternal control).
[Table 1.] Primers used for RT-qPCR amplification

Primers used for RT-qPCR amplification
Total protein was extracted from the hypothalamus of goldfish by using a protein extraction buffer (5.6 mM Tris, 0.55 mM ethylenediaminetetraacetic acid (EDTA), 0.55 mM ethylene glycol tetraacetic acid (EGTA), 0.1% sodium dodecyl sulfate (SDS), 0.15 mg/mL phenylmethylsulfonyl fluoride, and 0.15 mg/mL leupeptin). The protein samples were sonicated and quantified using the Bradford method (Bio-Rad). Total protein (30 μg per lane) was loaded onto a 4% acrylamide stacking gel and a 12% acrylamide resolving gel; a protein ladder (Fermentas, Hanover MD, USA) was used for reference. Samples were electrophoresed at 80 V through the stacking gel and at 150 V through the resolving gel until the bromophenol blue dye front had run off the gel. The gels were then immediately transferred to a 0.2-μm polyvinylidene difluoride membrane (Bio-Rad) at 85 V for 1.5 h at 4℃. Subsequently, the membranes were blocked with 5% skimmed milk in Tris-buffered saline (TBS, pH 7.4) for 45 min and washed in TBS. The membranes were incubated with Kiss antibodies (dilution, 1:4000; 80% similarity with fish species; bs-0749R; Bioss, San Diego, USA) and GTHα antibodies [anti-goldfish GTHα; a polyclonal rabbit antibody; dilution,1:4,000; courtesy of M. Kobayashi (Kobayashi et al., 2006)], followed by incubation with horseradish peroxidase (HRP)-conjugated anti-rabbit IgG secondary antibodies (dilution, 1:5,000; Bio-Rad) for 60 min. The internal control was β-tubulin (dilution, 1:5,000; ab6046, Abcam, Cambridge, UK). Bands were detected using the sensitive electrochemiluminescence (ECL) system (ECL Advance; GE Healthcare Life Sciences, Uppsala, Sweden) and exposed for 2 min by using a Molecular Imager® ChemiDocTM XRS+ Systems (Bio-Rad). The membrane images were scanned using a high-resolution scanner, and the band density was estimated using a computer program (Image Lab™ Software, version 3.0; Bio-Rad). The ratio of internal control (β-tubulin)/Kiss and GTHα for each concentration was calculated and plotted against the concentration of the internal control.
Plasma samples were separated by centrifugation (4℃, 10,000
An anti-antibody that was specific to the antibody of the hormones (FSH and LH) for fish was pre-coated onto a microplate, following which 50 μL of plasma, 50 μL HRP, and 50 μL of the antibody were added to each well. The components were mixed well, and the microplate was incubated for 2 h at 37℃. The wells were washed at three times using a wash buffer, and the remaining buffer after the last wash was aspirated or decanted off, and 50 μL each of the substrates included in the ELISA kit were added to each well. The microplate with the substrate solutions was then incubated for 15 min at 37℃ in the dark, during which the solutions changed from colorless or light blue to darker shades of blue. Following incubation, 50 μL of stop solution was added to each well, resulting in the change of color from blue to yellow. The optical density of the solution in each well was then determined within 10 min by using a microplate reader set to 450 nm. The following standard curve concentrations were used for the ELISA: FSH and LH—50, 25, 12.5, 6.25, 3.12, 1.56, and 0.78 mIU/mL.
All data were analyzed using the SPSS statistical package (version 10.0; SPSS Inc., USA) (McCullough 1999). Two-way analysis of variance followed by Tukey’s
>
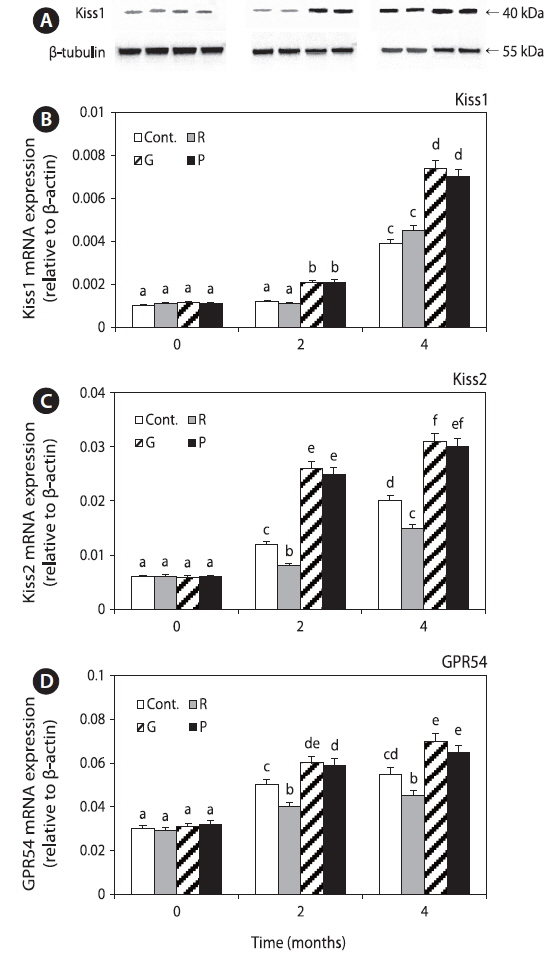
Expression of Kiss1 mRNA and protein, Kiss2, and GPR54 mRNA in the hypothalamus
We determined the effects of different light spectra on the expression of Kiss1 mRNA and protein, Kiss2, and GPR54 mRNA in the hypothalamus (Fig. 2). Their expression levels were significantly increased until 4 months in the control and red LED treatment groups; the expression levels in the green and purple LED treatment groups were significantly higher than those in the control and red LED treatment groups.
>
Expression of GnIH mRNA in the hypothalamus and cultured hypothalamus cells
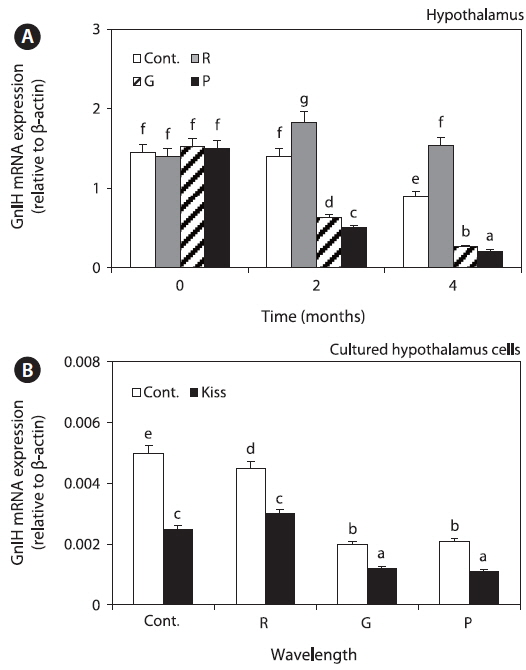
GnIH mRNA expression levels were significantly decreased in the green and purple LED treatment groups, but those in the red LED treatment group increased slightly at 2 months and then decreased until 4 months. Further, the levels in green and purple LED treatment groups were significantly lower than those in the control and red LED groups at 2 and 4 months (Fig. 3A).
GnIH mRNA expression levels in the cultured hypothalamus cells were significantly higher in the control and red LED treatment groups than in the green and purple LED treatment groups. However, the expression of GnIH mRNA was significantly lower in the Kiss treatment groups than in the non-Kiss treatment groups (Fig. 3B).
>
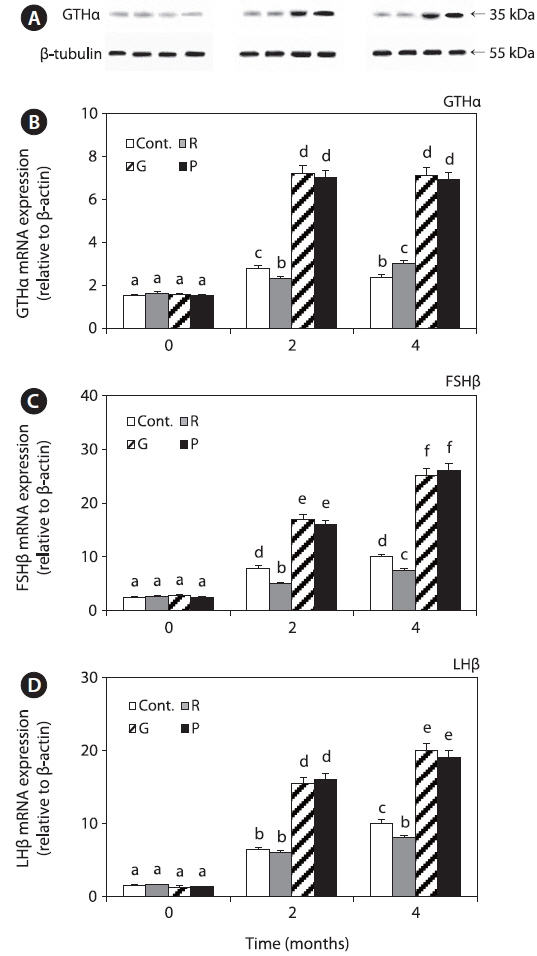
Expression of GTHs in the pituitary
GTHα mRNA and protein expression levels were significantly increased in all the groups until 4 months; however, the levels in the red LED treatment group were significantly lower than those in the green and purple LED treatment groups (Fig. 4A, 4B). Further, FSHβ and LHβ mRNA expression levels in all the groups were significantly increased until 4 months, and the levels in the red LED treatment group were lower than those in the green and purple LED treatment groups (Fig. 4C, 4D).
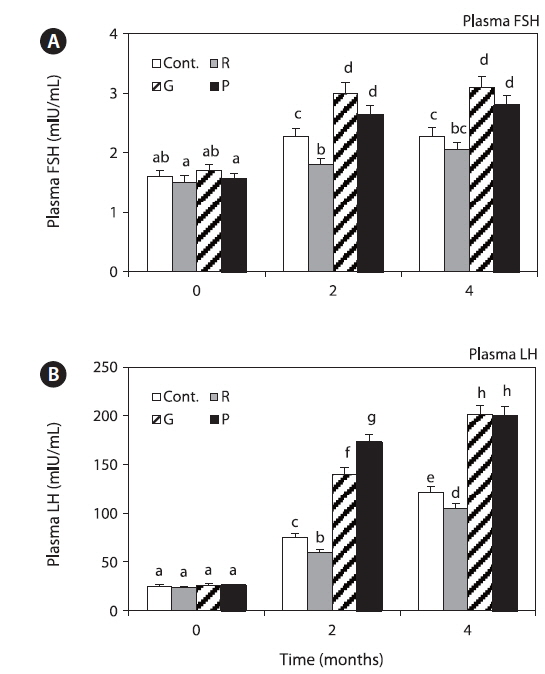
Plasma FSH levels in the control and red LED treatment groups were significantly increased until 4 months, and those in the red LED treatment groups were significantly lower than those in the green and purple LED treatment groups (Fig. 5A).
Plasma LH levels in the control and red LED treatment groups were significantly increased until 4 months, and those in the red LED groups were significantly lower than those in the green and purple LED treatment groups (Fig. 5B).
>
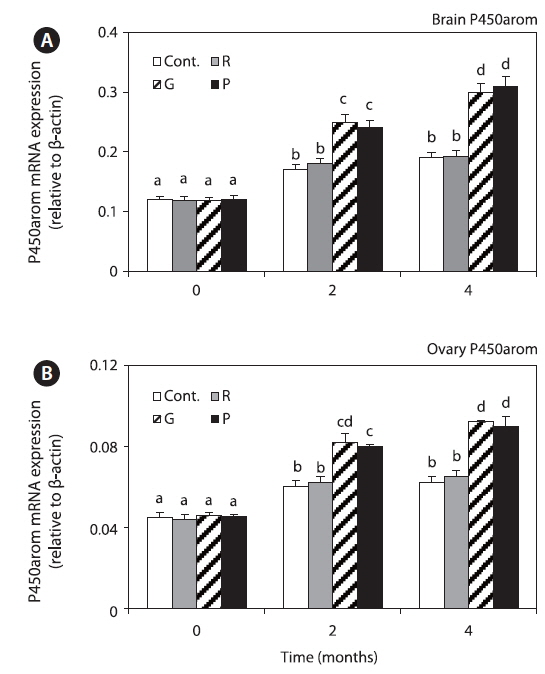
Expression of P450arom mRNA in the brain
Brain and ovary P450arom mRNA expression levels in all the groups were significantly increased at 4 months, but those in the red LED treatment group were significantly lower than those in the groups exposed to green and purple LED treatment groups (Fig. 6).
The mRNA levels of Kiss1 and Kiss2 and protein level of Kiss1 were significantly lower in the control and red LED treatment groups than in the green and purple LED treatment groups, and the patterns of GPR54 mRNA expression levels were similar to those of Kiss expression levels (Fig. 2). Kiss and GPR54 play an important role in the physiological regulation of reproductive maturation. Functionally, they participate in the regulation of reproductive function and fertilization by regulating the secretion of GTH, feedback actions of sex steroid hormones, and environmental signaling by activating GnRH neurons during puberty (Parhar et al., 2004; Tena-Sempere et al., 2012). Our results thus suggest that exposure to long wavelength adversely affects sex maturation by inhibiting goldfish sex maturation hormones.
Furthermore, we investigated the changes in GnIH mRNA expression levels after LED treatment and Kiss treatment. GnIH mRNA expression levels were significantly lower in all the experimental groups except in the red LED treatment group (Fig. 3A), and in the goldfish hypothalamus cells treated with Kiss were significantly lower than those in the not-treated group (Fig. 3B). Several ‘‘nonvisual’’ opsins are expressed in the zebrafish brain, and evidence linking deep brain photoreception to physiological responses is strongest for the hypothalamus (Yokoyama et al., 1978; Mano et al., 1999; Kojima et al., 2008). This suggests that hypothalamus has nonvisual photoreceptors and could perceive lights directly, and then affecting hormone changes on hypothalamus. Kiss, which is located in the pre-optic area (POA) cells of the hypothalamus, stimulated the secretion of GnRH in female and male cinnamon clownfish and played an important role in HPG axis activity and sexual maturation (Kim et al., 2014). Tsutsui et al. (2010) reported that, in vertebrates, melatonin induces neuropeptide synthesis and directly induces GnIH expression via the GnIH receptor; thus, reproductive status is primarily controlled by melatonin-activated signaling. Shin et al. (2014) reported that fish could detect green wavelengths because green light penetrates more deeply and reaches fish, unlike red light, and wavelengths corresponding to red light are known to secrete more melatonin than other wavelengths.
This suggests that red wavelength affects GnIH expression. Furthermore, GnIH plays a role in the interaction between Kiss1 and GPR54 in the hypothalamus (Tsutsui et al., 2010), and LH mRNA expression level increased after stimulation of the HPG axis by Kiss in goldfish (Yang et al., 2010); thus, Kiss plays a role in GnRH and GTH stimulation. We hypothesized that Kiss inhibits GnIH secretion since GnIH mRNA expression levels decreased after treatment with Kiss.
GnIH secretion inhibits GTH synthesis and secretion (Falcón et al., 2010). In this study, GnIH mRNA expression levels were higher in the red LED treatment group (Fig. 3), but GTHα mRNA and protein and FSHβ and LHβ mRNA expression levels were significantly lower in the red LED treatment group (Fig. 4). GnRH is the positive regulator of pituitary gonadotropin release, it influences the reproductive axis and GnIH directly regulates GTHs as the other hypothalamic negative regulators (Tsutsui et al., 2000). The suppressive effect of GnIH on gonadotropin mRNA was associated with an inhibition of both LH and FSH release via the HPG axis after treatment with long wavelengths. Our results are consistent with those of a study by Ciccone et al. (2004), who suggested that a physiological dose (10-7 M) of GnIH to diced pituitary glands from chickens suppressed GTHα and FSHβ subunit mRNAs.
Plasma FSH and LH levels were significantly lower in the red LED treatment group (Fig. 5); these results are also in agreement with those of Ciccone et al. (2004), who reported that GnIH-mediated inhibition of GTH mRNA expression inhibits FSH and LH release. Previous study was reported that GnIH peptide inhibits the release of FSH and by treatment GnIH in the goldfish and sockeye salmon (Amano et al., 2006; Zhang et al., 2010). These findings suggest that GnIH is an important component of the multifactorial neuroendocrine regulation of gonadotroph functions. Further, Shin et al. (2014) reported that GnRH and GTH mRNA expression and plasma LH levels of goldfish were significantly lower in the red LED treatment group; thus, we hypothesized that GnIH mRNA expression levels, which has negative effects, were significantly high in the long wavelength group.
P450aromA and P450aromB, which are related with fish maturation, were only detected in the ovary and brain, respectively, and they are related with ovary development and maturation and brain development (Min et al., 2009). This finding is consistent with those of studies in zebrafish
Although the relationship between light source of long wavelengths and regulation of sex maturation hormones remains unclear, we could infer that the reason for the different gene expression patterns for each wavelength might be associated with the light wavelength characterization in water. The short end of the visible spectrum becomes predominant in deeper waters, whereas red light only penetrates shallow waters (McFarland, 1991). This theory suggests that fish could detect green wavelengths, which can penetrate more deeply than red light. Thus, we hypothesized that our results were closely related with the amount of light detected by the fish.
In addition, purple light is mixed wavelength, while the others are single wavelengths. The effect of mixed wavelength on sex maturation hormones shows possibility that several photoreceptors with wide spectral sensitivity are involved in regulation of goldfish sex maturation hormones. The specific hormones pathway or photoreceptors by mixed wavelengths engaged in sex maturation function, however, have not been identified. Further studies need to focus on differences of single and mixed wavelengths effect in fish sex maturation hormones based on these results.
In conclusion, not only Kiss but also GnIH might be involved in the part of sex maturation regulation in green and purple LED lightening environments. Therefore, we hypothesized that RFamide peptides suggest that GnIH and Kiss act that control reproductive activity, and green and purple LED lightening environments enhance fish sex maturation function by these hormone changes. Future studies need to focus on the activities of GnIH by various LED lights.

![Spectral profiles of red, green, and purple [mixed blue (450 nm) and red (630 nm)] light emitting diodes (LEDs) and white fluorescent bulb (Cont.) used in this study. Reprinted from ref. Shin et al. (2011), with permission from Comparative Biochemistry and Physiology, Part-A.](http://oak.go.kr/repository/journal/15860/E1HKAL_2015_v18n2_211_f001.jpg)