The Achilles tendon (AT) is the most powerful of all tendons in the human body. Its role is to make extension of the foot possible by joining the soleus and gastrocnemius muscles to the calcaneus bone. The AT has effects on many other human movements due to its biomechanical nature [1].
The first report of an AT rupture was in 1575, and such cases have been constantly increasing since [2]. Sports activities are the cause of 75% of AT ruptures, and most of these activities include jumping or twisting movements [3-6]. Males in their 40s are the main victims of AT rupture [5], and it is six times more common among males than females [7, 8].
Primary acute rupture is mainly caused by use of steroids or fluoroquinolones, and prior rupture on the contralateral side. It is diagnosed based on a palpable gap and a positive result of a Thompson test. When these physical examinations are not sufficient, it can also be diagnosed with ultrasonography or magnetic resonance imaging. Acute AT rupture can be treated with or without a surgery. When treated without a surgery, the patient must wear a cast, cast-boot, or splint with the foot fixed in plantar flexion [9]. There are three types of surgeries: open, minimally invasive, and percutaneous repair of the tendon [10]. The most common way to treat AT rupture is with open surgery, but whether there is a single most effective postoperative rehabilitation protocol for AT rupture is debatable [11].
In the treatment of AT rupture, it is important to determine the extent of injury and to induce complete recovery. When to start rehabilitation is also important. However, there are limits to understanding the involved microscopic structure by ultrasonography or magnetic resonance imaging due to their low spatial resolution.
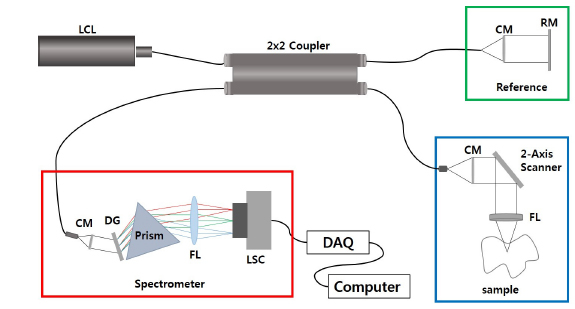
Optical coherence tomography (OCT) is usually based on a Michelson interferometer utilizing backscattering of near-infrared light from tissue. It provides cross-sectional images of microtissue morphology with high resolution (2-10 μm) in a noninvasive manner, but imaging depth is limited to 1-2 mm. Previous OCT studies have visualized changes of muscle microstructure using an mdx mouse model for Duchenne muscular dystrophy [12-14]. However, no OCT study has been done to image changes of healing tissue associated with AT injury. Thus we thought that the OCT method could be a potential tool for monitoring the healing process of a tendon. We made two rat models, denervated and non-denervated groups, to observe a variety of healing phases of AT injury. We made samples of AT injury lesions, to take OCT images and to make histopathological samples of serial sectional tissue.
2.1. Animals and Ethical Approval
Four male Sprague-Dawley rats were used in this study. Their body weights were 350-380 g. The rats were acclimated for 1 week before the experiments. The temperature in the room in which the rats were kept was maintained at 22-23℃ with a humidity of 50-55% and a 12-hour light-dark cycle. A diet of commercial rodent pellets and water was supplied
To induce rapid trauma in the AT, we performed the surgery on the lower limbs of all four rats. Before the surgery, the rats were anesthetized by Zoletil® (0.04 m1/100 g body weight, intraperitoneal inj., Virbac, France) and Xylazine (0.01 ml/100 g body weight, intraperitoneal inj., Rompun, Bayer, Germany). We incised skin on the medial side of the ankle and exposed the AT. 0.5-mm sharp trauma was made by iris scissors in both lower limbs. After the surgery, neurectomy of the sciatic nerves was conducted in accordance with surgical procedure, as previously described [15]. Two rats underwent the neurectomy operation, but the other two received only incised skin at the same place, in a sham operation.
2.3. Optical Coherence Tomography System and Histopathology
We developed the 1310-nm
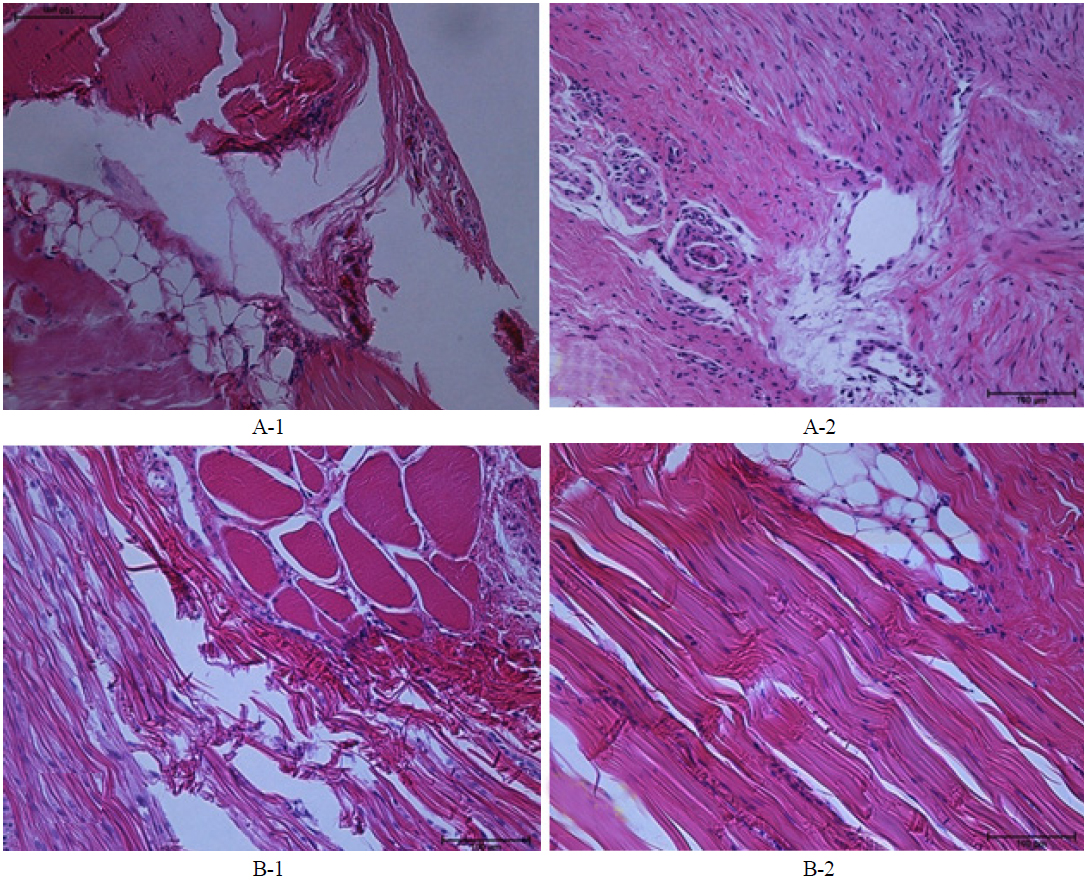
One week later after surgery, the ATs of two rats (non-denervated and denervated) were enucleated and OCT imaging was performed. At the second week, the same procedure was followed. After OCT imaging, the ATs were fixed with 10% neutral buffered formalin. These tissues were embedded in paraffin to make a paraffin block, which easily yields thin sections. The paraffin block was cut by a microtome to produce serial sections of tissues; the serial sections were fixed on slide glass and stained with hematoxylin and eosin. The images were examined and captured by a digital camera (Digital sight DS-U1, Nikon, Japan) affixed to a microscope (Eclipse 80i, Nikon, Japan).
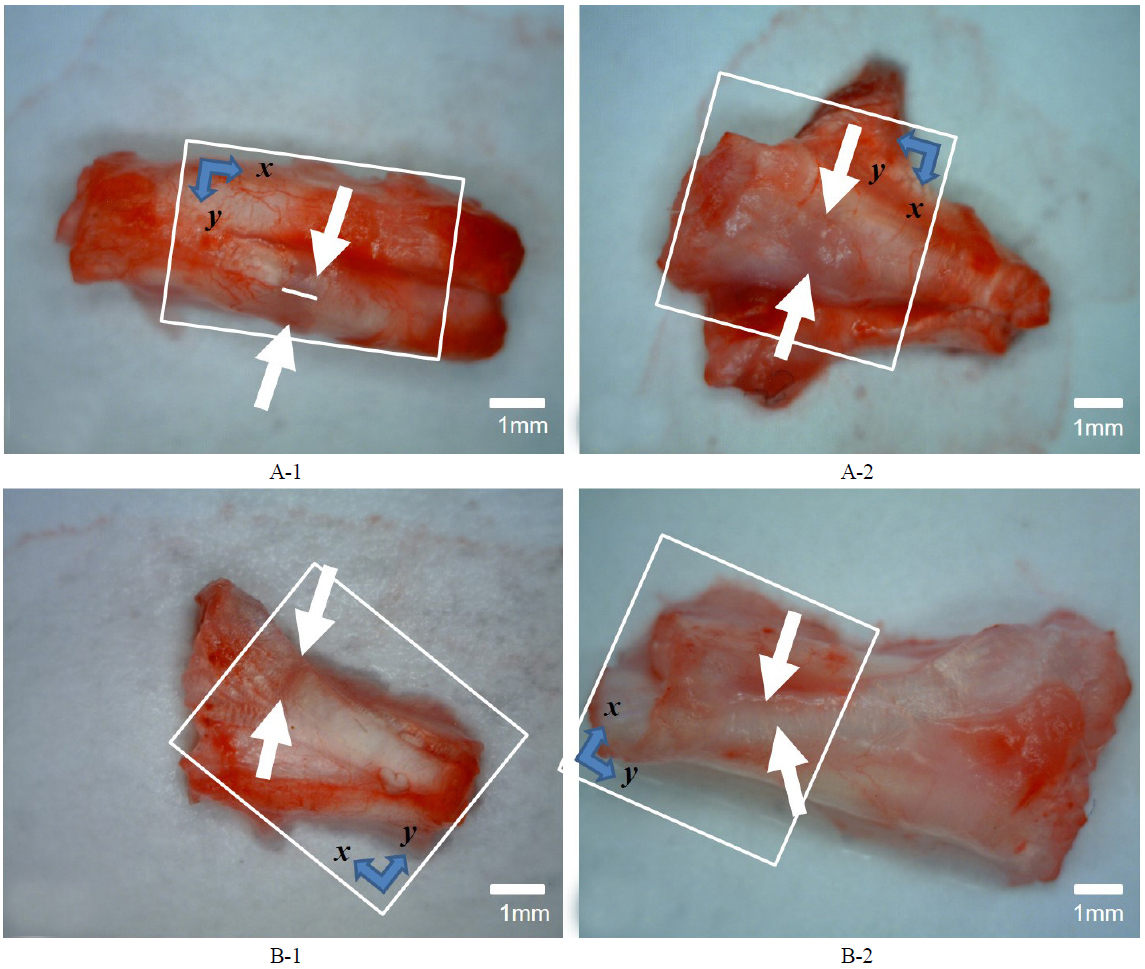
In our study we used four male Sprague-Dawley rats, all of which received surgery to generate partial Achilles tendon rupture. Then one group recieved neurectomy of sciatic nerves,while the other group did not receive neurectomy. The reason for neurectomy was to differentiate the activity of the rat and induce a difference in the AT healing phase. To the naked eye, a non-denervated rat's tendon showed a blue lesion after the first week, and a more edematous blue lesion after the second week. (See the regions between the white arrows in Figs. 2A-1 and 2A-2.) Tissue was sectioned along the midline between the white arrows in each case (for instance, see Fig. 2A-1), for histopathological analysis. In histopatholical analysis the non-denervated rat’s tendon showed an inflammatory phase after the second week, when the proliferative process did not start yet (Figs. 3A-1, 3A-2). On the other hand, the denervated rat’s tendon did not show a blue lesion after the first or second weeks to the naked eye (Figs. 2B-1, 2B-2). In histopathological analysis, the denervated rat’s tendon showed tenocytes, as remodeling had already started in the first week and type III collagen synthesis had begun, so the alignment of tendon tissue had initiated healing. After the second week, the remodeling phase has been completed and the healing tissue has been resized and reshaped, showing perfect alignment along the direction of stress (Figs. 3B-1, 3B-2).
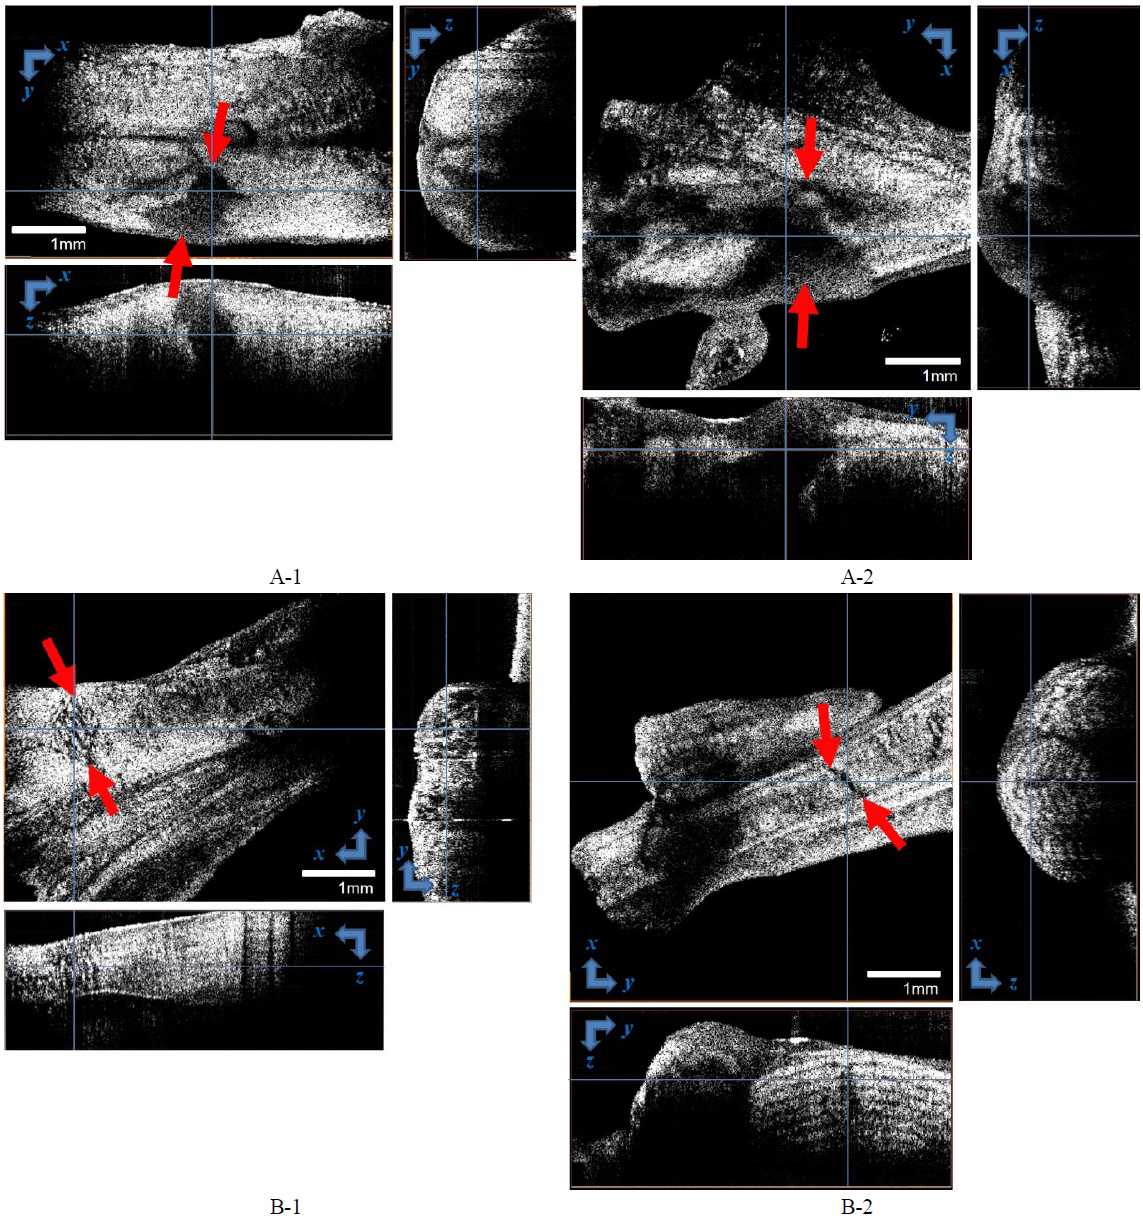
We compared these findings with OCT analysis. Once we had obtained three-dimensional images by scanning the boxes depicted in Fig. 2, the images were volume-rendered.
To conclude, the non-denervated rat’s tendon did not recover completely to attain sufficient tensile force, whereas the denervated rat’s tendon recovered completely, to serve as normal tissue with sufficient strength. Since OCT provided tomographic information, OCT could image the injury at different depths. There may exist a hidden deep injury in tissue with a normal gross finding. Therefore, OCT can help to determine more accurately the healing phase, and to recommend exercise strength and starting time. OCT images correlated well with histopathological interpretation.
AT rupture is a very common injury. It is associated with sports and exercise generally in young people, and is caused by degeneration in the elderly. Although AT rupture does not result in serious complications, it makes young people quit favorite sports, and in the elderly leads to decline of casual activity such as walking or hiking, so that eventually quality of life is degraded.
Diagnosis of AT rupture is relatively easy by means of Thomson sign or physical examination. The impairment degree of AT is assessed by ultrasound or MRI. People have always been concerned about the successful treatment of AT rupture, and recently recovering tendon functionality to a satisfactory level and preventing recurrence after primary treatment have been getting more attention. Several studies were conducted to find the optimal starting time of rehabilitation, physical activity level, quality of life and complication after surgical or nonsurgical repair, re-rupture and infection, etc. It was reported [16] that functional rehabilitation after acute AT rupture does not increase the rate of re-rupture or other complications. Additionally, return to work and sports earlier is a recent trend. Thus the importance of appropriate rehabilitation treatment after AT rupture is growing, and many studies of rehabilitation treatment are being carried out actively.
Success in rehabilitation treatment is to recover enough strength and proprioceptive sense. To do this, it is essential to assess the microstructure of the tendon at the histological level. With this, it is possible to determine the starting time and strength of appropriate exercise. Recent imaging technologies such as MRI, CT, and ultrasound have the limitations, such as high cost and low resolution. Besides, tissue biopsy is the most accurate method for histopathological assessment, but it is so invasive that it cannot be conducted during rehabilitation, because it is likely to cause additional impairment.
OCT can produce a cross-sectional image of an object in real time [17]. This technique shares some similarities with ultrasound B-mode imaging, but uses light rather than sound or radio waves. Since OCT is an optical imaging technique, a spatial resolution of 10 μm or less can be achieved. Thus its resolution is ten to one hundred times better than that of conventional ultrasound. In addition, OCT has the advantage that it does not require direct contact with tissues. Thus we thought that OCT technology would be very useful to assess the histopathological recovery from the treatment of AT rupture.
Our study showed that OCT is very useful for analyzing the histopathological healing phase after AT rupture. As mentioned, the recovery of histopathological strength is critical to rehabilitation after AT rupture. To accomplish this, tools to make a histopathological assessment are needed. To this effect, OCT enabled us to assess the microstructure of the AT.
The limitations of this study are: (1) OCT was applied to a sacrificed animal rather than directly to a live animal, but this was inevitable for the histopathological comparison; and (2) statistical assessment using OCT parameters was not achieved. However, this study is meaningful in that its results can serve as a basic reference for other studies of the healing process of musculoskeletal disorders through OCT.
OCT is a potentially powerful technology for assessing musculoskeletal disease at micron-scale resolution and in real time. More clinical trials and increased use of adjuvant approaches are needed for it to become a routine tool for clinical assessment. Currently we are developing a needle-type OCT probe for musculoskeletal application. In the future,
In this study we evaluated a multimodal platform of OCT to investigate structures of the injured AT, and demonstrated a complementary benefit of multimodal imaging in the most suitable rat model for AT injury. OCT findings combined with histopathological findings showed advantages in visualization of tendon microstructure over other imaging modalities such as MRI or US.
We were able to evaluate the organization of microscopic living tissue, which is beneficial to making a treatment plan, especially for the timing and intensity of rehabilitation. Therefore the multimodal platform using OCT for evaluation of tendon injury may be potentially useful for many applications.