High-repetition-rate and large energy ultra-short laser pulses are very important for applications of nonlinear frequency conversion, ultrafast dynamics exploration, and optical precision procession [1-3]. Rare-earth doped silica-based fibers are very good gain media for building mode-locked lasers generating such ultra-short pulses [4-8]. However, the nonlinear Kerr effect in the long-range transmission fibers induced by the ultra-short pulses with high peak power is very serious. This may result in a very high nonlinear phase-shifting. When the dispersion cannot control or compensate the accumulated nonlinear phase-shifting, the nonlinear effect may induce nonlinear chirps to cause a pulse distortion [9], which makes it difficult to obtain large energy pulses. Previous research shows that a fiber laser with all-normal group-velocity dispersion (GVD) or large normal GVD together with small anomalous GVD can achieve a dissipative soliton (DS) with large energy in the mode-locked pulse shaping [10, 11]. The formation mechanism of DSs is attributed to an integrated result of all kinds of effects in the laser cavity, such as the spectral filter effect of the gain medium, Kerr nonlinear effect, normal dispersion, nonlinear polarization rotation (NPR) or saturable absorber (SA), gain and loss of the laser cavity, etc. It has also been found that a spectral filter (SF) inserted in a passively mode-locked fiber laser with a positive dispersion cavity can be used to balance the pulse chirp for achieving stable DSs. Moreover, the pulse shape (pulse duration, peak power, etc.) and the spectrum (spectral width, etc.) of the DS are closely related to the bandwidth of the SF [11-14]. In fact, the variation of the SF bandwidth would not only result in changes of the pulse shape and spectrum of the DS, but would also induce the pulse to cause the wave breaking, which affects the stabilization of the output pulse and the increment of the pulse energy. Therefore, the influences of the filter effect on pulse splitting in a passively mode-locked fiber laser with positive dispersion cavity are worth in-depth study.
In this paper, the influences of the filter effect on pulse splitting in a passively mode-locked erbium-doped fiber laser (EDFL) with positive dispersion cavity are investigated theoretically. Our results show that as the SF bandwidth decreases, the nonlinear chirp appended to the pulse increases under the combined action of the filter effect of the super-Gaussian SF and the self-phase modulation (SPM) effect. On further decreasing the bandwidth, the wave breaking of the pulse takes place. In addition, by varying the pump power of the laser or the profile of the SF, the influences of the filter effect on pulse splitting would change accordingly.
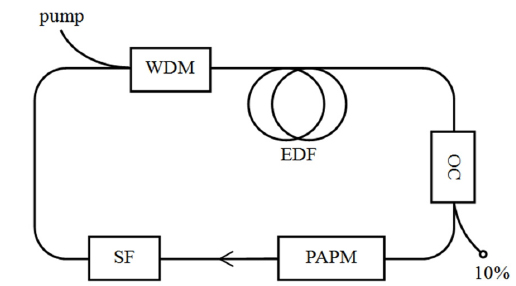
Figure 1 shows the propagation model of a passively mode-locked EDFL with an SF. The pump light is launched into the EDF through a wavelength division multiplexing (WDM) coupler. The positive dispersion ring cavity is comprised of a single-mode fiber (SMF) and the EDF. The polarization additive-pulse mode-locked (PAPM) system is made of a polarization-sensitive isolator and two sets of polarization controllers. The PAPM is used to produce the NPR effect. An SF inserted in the cavity after the PAPM has a variable bandwidth. The 10% port of a 10:90 optical coupler (OC) is used for the laser pulse output.
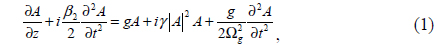
By solving the extended nonlinear Schrödinger equation (NLSE), the operation of a passively mode-locked fiber laser with a positive dispersion cavity can be numerically simulated. The equation is given by [15, 16]

where

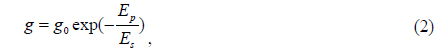
Here

where
The gain medium of the EDF has a gain bandwidth of 25 nm, with profile of super-Gaussian type. The PAPM element is a similar SA [11], which can serve as the spectral and temporal filtering element [11, 12, 19, 20]. The PAPM element has a super-Gaussian transmission function with the bandwidth of 70 nm.
A scalar model to simplify the propagation model with the PAPM function, so the intensity-depended transmission function of the PAPM element is given by [7]

where

where
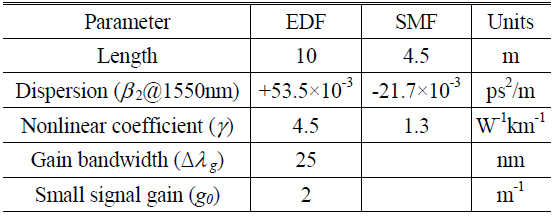
The total length of laser cavity is 14.5 m with the net cavity dispersion of ~0.44 ps2. A pulse with Gaussian shape is used as an initial condition, and the initial chirp parameter C is zero. In accordance with Eq. (1), by using the standard split step Fourier method, the laser operation in a passively mode-locked fiber laser can be simulated with the parameters displayed in Table 1. In the simulation, we use the shooting method to determine whether the laser reaches the steady state. Based on the self-reproduction features of the laser, only when the difference between the initial value and the calculated value is within given precision limitation do we believe that the laser reaches the steady state.
[TABLE 1.] Fiber parameters used in the simulation of the laser cavity

Fiber parameters used in the simulation of the laser cavity
Initially, the influences of the filter bandwidth on pulse output properties are investigated. In the simulation, the gain saturation energy
It can also be seen that the pulse chirp doesn’t satisfy the linear evolution, but the accumulation of the nonlinear chirp is not enough to make the pulse split as the SF bandwidth decreases. The reason is that the filter has less impact on the pulse for the broader SF, and the pulse peak power increase is limited for the decrease of the SF bandwidth. Given that the nonlinear chirp is caused by the combination of the filter effect and the SPM effect, the impact on the nonlinear chirp accumulation of the pulse is limited.
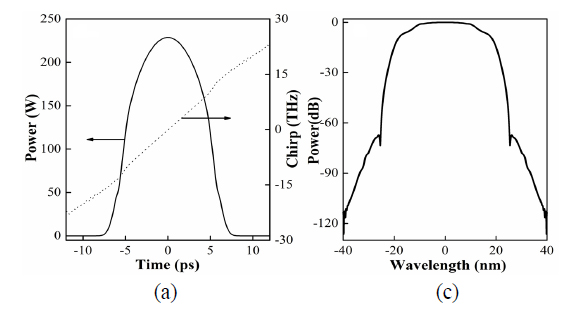
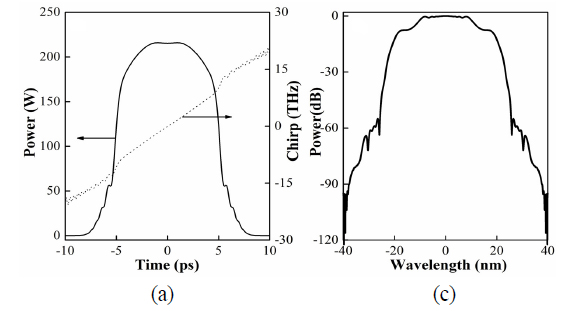
Figure 3 shows the output pulse shape, chirp and spectrum with a decrease to 15 nm of the SF bandwidth. As shown, the output pulse spectral width increases to 21.04 nm rapidly. Meanwhile, the output pulse shape narrows down to 10.4 ps, and the peak power rapidly increases to 157.1 W. At this point, the SF bandwidth is less than the pulse spectral width. When the pulse passes the filter, not only does the pulse shape become narrower, but the spectral wings can be cut off, so both the pulse shape and the spectrum have obvious changes. It also indicates that the nonlinear chirp increases along with the decrease of the SF bandwidth. This is because the filter effect begins to be notable when the SF bandwidth can compare to the pulse spectral width. Meanwhile, the influences of the SPM effect are enhanced greatly for the rapid increase of the pulse peak power, which results in output pulse containing more nonlinear chirp. With the action of the combination of the filter effect and the SPM effect, the pulse chirp deviates seriously from the linear distribution. It is worthwhile to point out that, as the nonlinear chirp increases, the wave breaking is more likely to occur, so it can be seen that the pulse would split if the SF bandwidth further decreases.
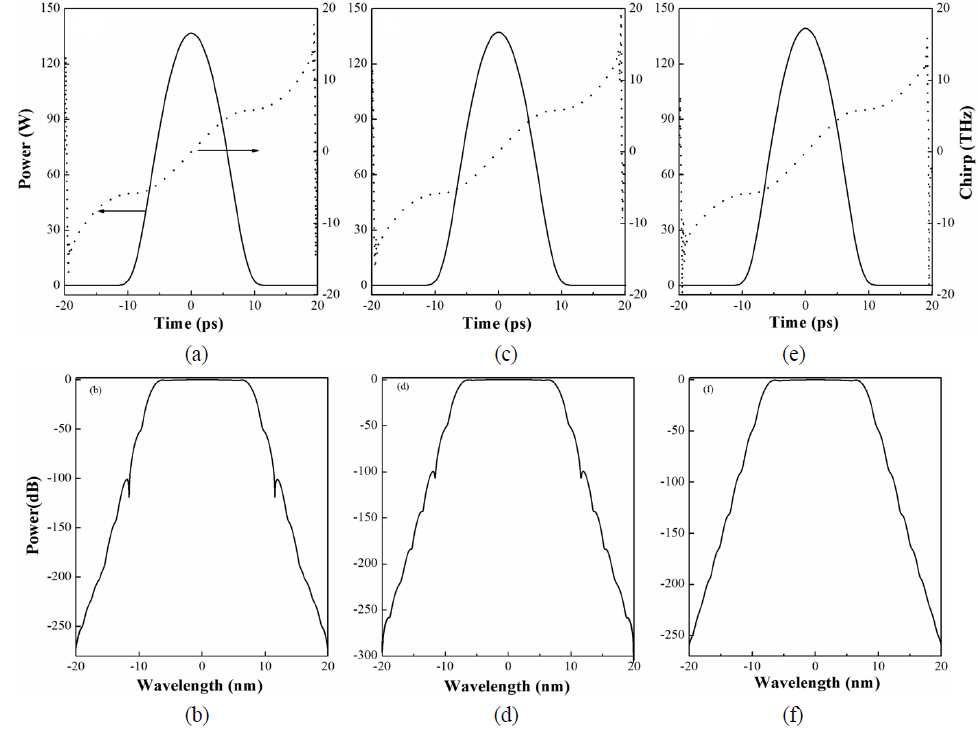
Figure 4(a)-(b) shows the output pulse shape, chirp and spectrum with the SF bandwidth of 9 nm. Here we can see that the output pulse spectrum further broadens and begins to deviate from the trapeziform distribution. Meanwhile, the pulse shape obviously changes and at the edges small fluctuations emerge. By comparing the results shown in Fig. 4(c)-(d) with the SF bandwidth of 7 nm to those in Fig. 4(a)-(b), we clearly see that the small fluctuations have evolved into multi-peak oscillation structures. This indicates that the pulse is beginning to split. The nonlinear chirp increases quickly with the further decrease of the SF bandwidth, so the different parts of the pulse spectral envelopes have the same instantaneous frequency, thus interfering with each other, which leads to the edges with multi-peak oscillation structures.
It is worth pointing out, as an SF is introduced in the laser cavity, it modifies the laser attracting state in some way [11]. When the SF band is wide, the round-trip cavity length is long enough so that after filter application the pulse can return to its attracting state before encountering the SF again. With the decreasing of SF bandwidth, the laser attracting state would not change. Finally we can see that the pulse duration decreases, while the spectral width and the pulse peak power increase, but both the pulse temporal waveforms and the spectra are similar. When the SF band is very narrow, SF has a strong filtering effect. The pulse cannot return to its original attracting state when the pulse encountering SF again, so the laser attracting state would change. Both the pulse temporal waveforms and the spectra have big changes, which could eventually lead to the wave breaking.
The above results show that the pulse splitting in a passively mode-locked fiber laser with positive dispersion cavity is influenced by the SF bandwidth when the laser pump power is constant. In fact, the pulse shape and spectrum are related to the laser pump power, the variation of the pump power can lead to the changes of the pulse splitting characteristics with a certain bandwidth SF.
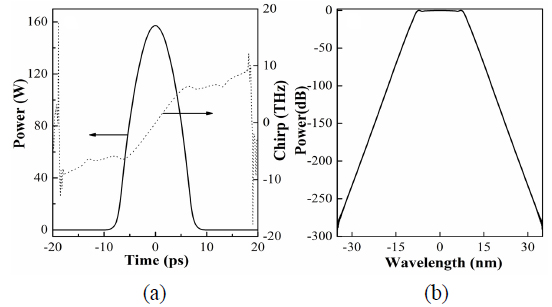
Figure 5 shows the pulse shape, chirp and spectrum when
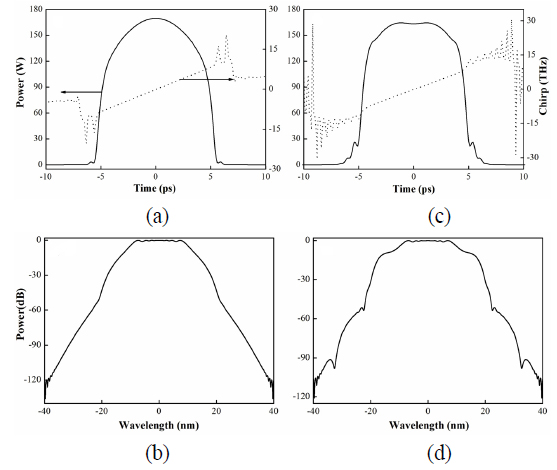
In addition, since the super-Gaussian SF brings in the nonlinear chirp, which can make the pulse split. In the case shown in Fig. 6, a Gaussian SF is used in the laser cavity instead while
We have investigated theoretically the influences of the filter effect on pulse splitting in a passively mode-locked EDFL with a positive dispersion cavity based on the extended NLSE. Our results have shown that as the SF bandwidth decreases, the nonlinear chirp appended to the pulse increases under the combined action of the filter effect of the super-Gaussian SF and the SPM effect. On further decreasing the bandwidth, the wave breaking of the pulses takes place. In addition, by varying the pump power of the laser or the profile of SF, the influences of the filter effect on pulse splitting also change accordingly. As the laser pump power is increased, the phenomenon of wave breaking is clearer. By using a Gaussian SF in the laser cavity instead, the wave breaking effect may be weak with the decrease of the nonlinear chirp.