Support vector machine (SVM) was proposed by Vapnik et al.[1, 2]; it implements structural risk minimization [3]. Beginning with its early success with optical character recognition [1], SVM has been widely applied to a range of areas [4-6]. SVM possesses a strong theoretical foundation and enjoys excellent empirical success in pattern recognition problems and industrial applications [7]. However, SVM also has the drawback of sensitivity to outliers and its performance can be degraded by their presence. Even though slack variables are introduced to suppress outliers [8, 9], outliers continue to influence the determination of the decision hyperplane because they have a relatively high margin loss compared to those of the other data points [10]. Further, when quadratic margin loss is employed, the influence of outliers increases [11]. Previous research has considered this problem [8-10, 12-14].
In [12], an adaptive margin was proposed to reduce the margin losses (hence the influence) of data far from their class centroids. The margin loss was scaled based on the distance between each data point and the center of the class. In [13, 14], the robust loss function was employed to limit the maximal margin loss of the outlier. Further, a robust SVM based on a smooth ramp loss was proposed in [8]. It suppresses the influence of outliers by employing the Huber loss function. Most works have aimed at reducing the effect of outliers by changing the margin loss function; only a small number have aimed at identifying the outliers and removing them in the training set. For example, Xu et al. proposed an outlier detection method using convex optimization in [10]. However, their method is complex and relaxation is employed to approximate the optimization.
In this paper, a new robust SVM based on a genetic algorithm (GA) [15] is proposed. The proposed method locates the outliers among the samples and removes them from the training set. The basic idea of this SVM parallels that of genetic feature selection, wherein GAs locate the irrelevant or redundant features and remove them by mimicking natural evolution. In the proposed method, GA detects and removes outliers that would be considered as support vectors by the previous soft margin SVM
The remainder of this paper is organized as follows. In Section 2, we offer preliminary information on GAs. In Section 3, we describe the proposed method. Section 4 details the experimental results that demonstrate the performance and our conclusions are presented in Section 5.
Genetic Algorithms (GAs) are engineering models obtained from the natural mechanisms of genetics and evolution and are applicable to a wide range of problems. GAs typically maintain and manipulate a population of individuals that represents a set of candidate solutions for a given problem. The viability of each candidate solution is evaluated based on its fitness and the population evolves better solutions via selection, crossover, and mutation. In the selection process, some individuals are copied to produce a tentative offspring population. The number of copies of an individual in the next generation is proportional to the individual’s relative fitness value. Promising individuals are therefore more likely to be present in the next generation. The selected individuals are modified to search for a global optimal solution using crossover and mutation. GAs provide a simple yet robust optimization methodology [16].
3. Genetic Outlier Selection For Support Vector Machines
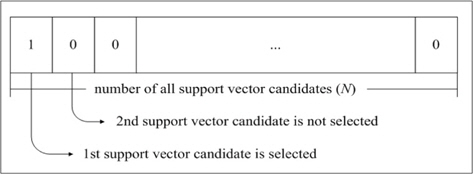
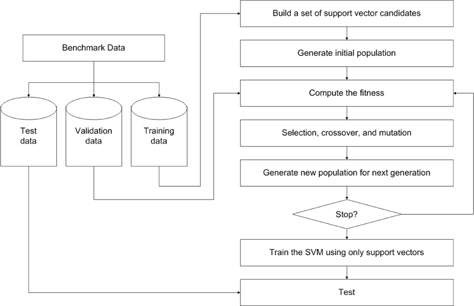
In this section, a new outlier detection method based on a genetic algorithm is proposed. First, dual quadratic optimization is formulated in a soft margin SVM and support vector candidates are selected from the training set based on the Lagrange multiplier. Then, the candidates are divided into either support vectors or outliers using GA. Figure 1 presents the overall procedure for the proposed method.
Suppose that

that maximally separates two classes

and

where

subject to


where

subject to


where Λ = [λ1, λ2, ..., λ
The interesting point is that if outliers are included in the training set, the outliers are likely to have positive margin loss and contribute to the hyperplanes. Further, the outliers tend to have relatively large margin loss and significantly influence the determination of the hyperplane, thereby making the SVM sensitive to the presence of outliers. In this paper, a robust SVM design scheme is proposed based on GA. First, a set of support vector candidates

is prepared by collecting the data points with positive Lagrange multipliers. As stated, not only the support vectors but also some outliers may be included in

where

In this equation,
[Table 1.] Experiment parameters
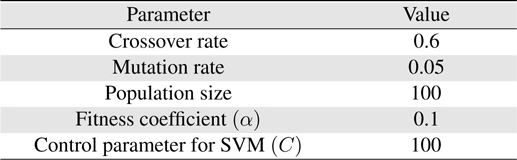
Experiment parameters
In Table 1,
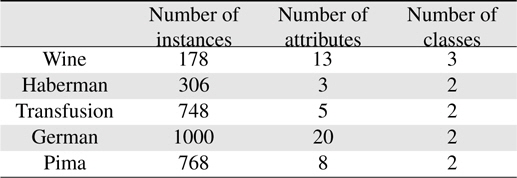
In this section, the validity of the proposed scheme is demonstrated by applying it to five databases of the UCI repository [21]. The UCI repository has been widely used within the pattern recognition community as a benchmark problem for machine learning algorithms. The five databases are the Wine, Haberman, Transfusion, Garman, and Pima sets. All the sets except the Wine set are binary; first and second classes are used in the Wine set. The databases used in the experiments are summarized in Table 2.
[Table 2.] Datasets used in the experiments

Datasets used in the experiments
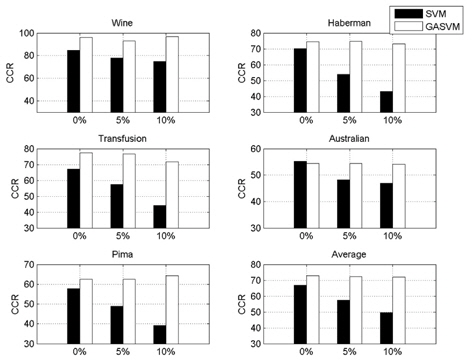
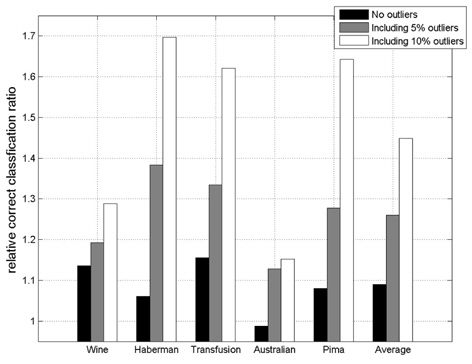
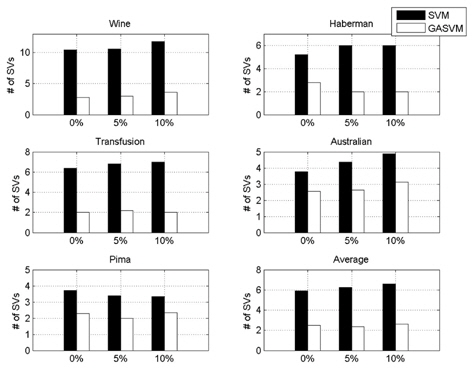
In this experiment, the databases are randomly divided into four equal-sized subsets. Two subsets are used for training and the remaining two subsets are used for validation and testing. The training and validation sets are used to design a robust SVM and the test sets are used to evaluate the performance of the algorithms. To demonstrate the robustness of the proposed method against outliers, approximately 5% and 10% of the training samples were randomly selected from each class and their labels were reversed. Five independent runs were performed for statistical verification; the linear kernel was used for SVM. The performances of the proposed method and the general soft margin SVM were compared in terms of average testing accuracy and the number of support vectors. The results are summarized in Tables 3 and 4. In the tables, the proposed robust SVM is denoted as GASVM. It is observed that the standard SVM exhibits a marginally better performance than that of the proposed method for only the Australian database in the non-outlier case. In the majority of the cases, the proposed method achieves superior classification accuracy using a smaller number of support vectors than that of the standard SVM. That is, the proposed method is less sensitive to outliers and requires a reduced number of support vectors compared to the standard SVM. Further, by comparing the cases with 5% outliers and 10% outliers as indicated in Figure 3 and Figure 4, it can be observed that in the standard SVM, the greater the number of outliers that are included in the training set, the greater the number of support vectors generated and hence, the more the performance is degraded. In the proposed method, however, less sensitivity is exhibited toward the outliers and the increase in support vectors is limited. The reason for the improved performance of the proposed method is that only useful and discriminatory support vectors are selected and the brunt of the outlier influence on the SVM training is removed. To highlight the robustness of the proposed method, the test accuracy of the GASVM was normalized with respect to that of the standard SVM and the relative performances of the two SVMs are presented in Figure 5. In this figure, the length of the bar

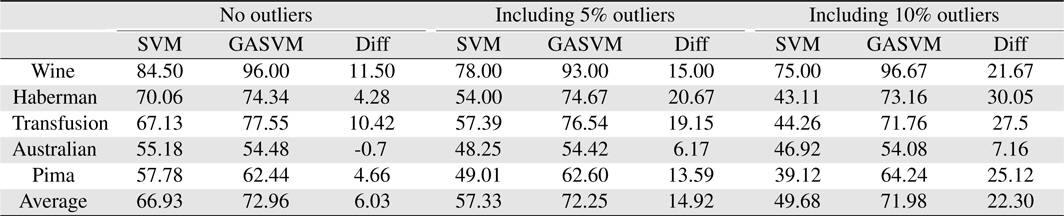
Comparing the results of the proposed method (GASVM) with those of a previous method (SVM) in terms of testing accuracy
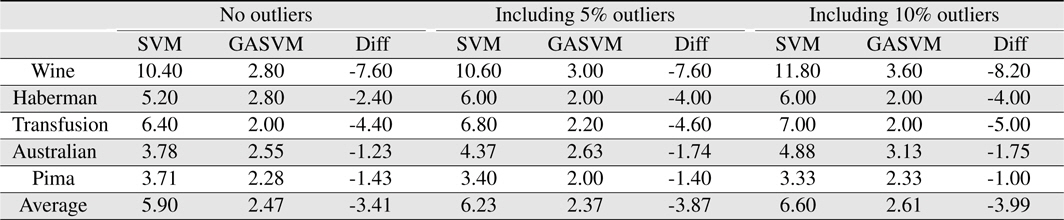
Comparing the results of the proposed method (GASVM) with those of a previous method (SVM) in terms of the number of support vectors
where
In this paper, we presented a new method for detecting outliers to improve the robustness of SVM. The proposed method detected outliers within the support vectors assigned by soft margin SVM using GA, and demonstrated recognition performance and a total number of support vectors superior to those of previous methods. Using the proposed method, the robustness of SVM was improved and the SVM was simplified by outlier deletion. The validity of the suggested method was demonstrated through experiments with five databases from the UCI repository.