Wireless body area networks (WBANs) have received a great deal of attention for facilitation of different applications including healthcare, sport activities, and personal assistance. These applications involve on-to-off body communication scenarios where physiological and activity data from a person are sent to the monitoring server. In such scenarios, the radio signal is affected by environmental factors as well as by human body (e.g., movements, structures, and tissues, etc.). As a result, typical wireless channel models do not fit well with WBAN environments.
For several years, many efforts have been made to identify the propagation characteristics in on-to-off body communication [1-4]. In indoor environments, the log-normal and Rayleigh distributions provide good fit to the on-to-off body channels for standing and for walking, respectively [1]. Smith et al. [2] showed that the on-to-off body channels for sleeping persons follow the Gamma distribution. The variation in the channel characteristic with the blockage of the line-of-sight path by the human body (i.e., shadowing effect) was investigated in [3]. A new statistical channel model for the path blockage was also introduced in [4]. Other investigations of the on-to-off body channel characteristics can be found in [5,6].
The channel characteristics, in fact, depend on various factors such as the environments, subjects (gender and body morphology), types, and positions of the antennas in addition to the body activities [7,8]. However, with the implicit assumption that the effects of the other factors are relatively negligible, the previous investigations focused on how the propagation channel characteristics change according to the body movements. Based on our preliminary experimental results, the on-to-off body channel characteristics vary considerably due to the transmitting antenna positions on the body while the other conditions are fixed. Efforts are ongo-ing to investigate the effects of antenna positions on the onbody channels [8], but to the best of our knowledge, no substantial propagation characterization and analysis of the on-to-off body channel has been conducted with respect to the antenna positions.
Recent experimental results (see [9] and references therein) showed that the power absorption is a dominant factor influencing the WBAN performance. Motivated by these results, we investigate the effect of body absorption losses (ALs) on the on-to-off body channel characteristic in this paper. The received signal strength (RSS) and the ALs are measured with respect to the on-body transmitting antenna positions through experiments and simulations. A statistical analysis is presented to characterize the on-to-off body channels as a function of the on-body transmitting antenna positions.
The rest of this paper is organized as follows. Section II describes the measurement setup and the power loss model. Section III analyzes the effect of the body AL on the on-tooff body channel with experimental and simulation results. Section IV concludes this paper.
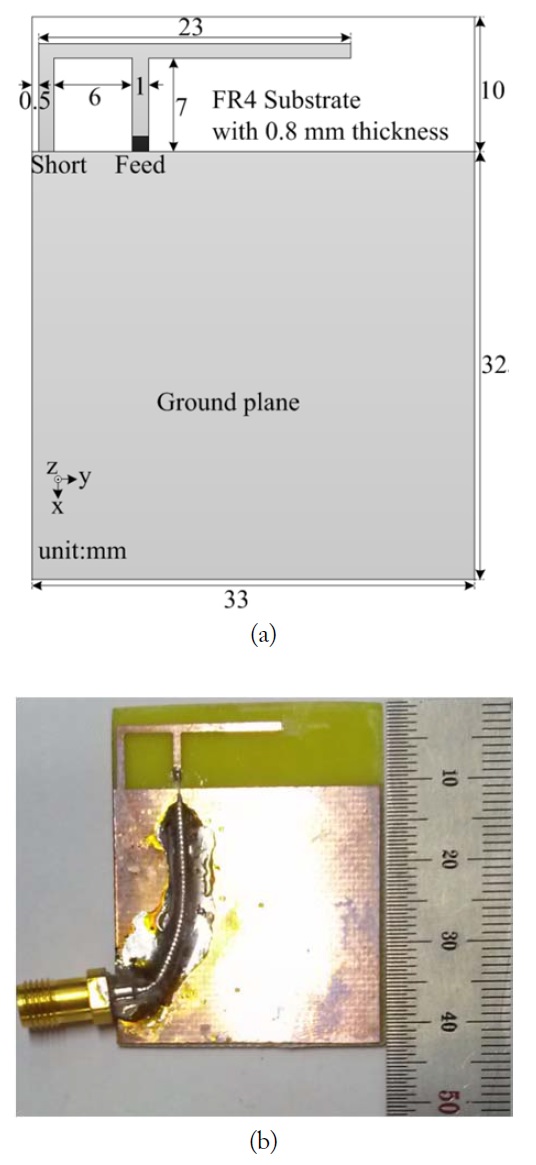
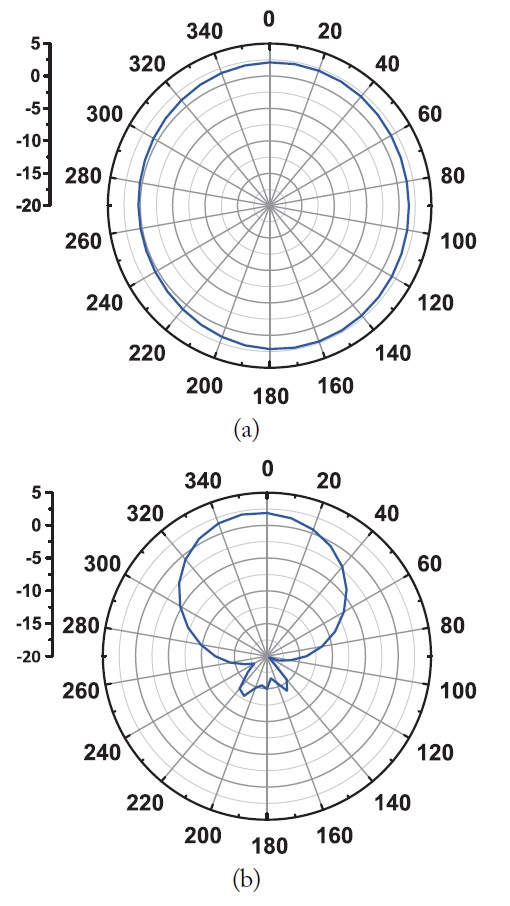
The measurement system consisted of a transmitting/receiving (Tx/Rx) pair of planar inverted-F antennas (PIFAs) and a vector network analyzer (VNA; Rohde & Schwarz ZVB20, Germany). Fig. 1 shows the geometry of the PIFA. The PIFA is designed on a FR4 substrate with a relative permittivity of 4.4, and the total size of the substrate is 33×42 mm2. The antenna has a dimension of 23×8×0.8 mm3. The PIFAs operated in the 2.45 GHz ISM band have an omnidirectional radiation pattern in free space (Fig. 2(a)) and have a directional pattern when mounted on the body (Fig. 2(b)).
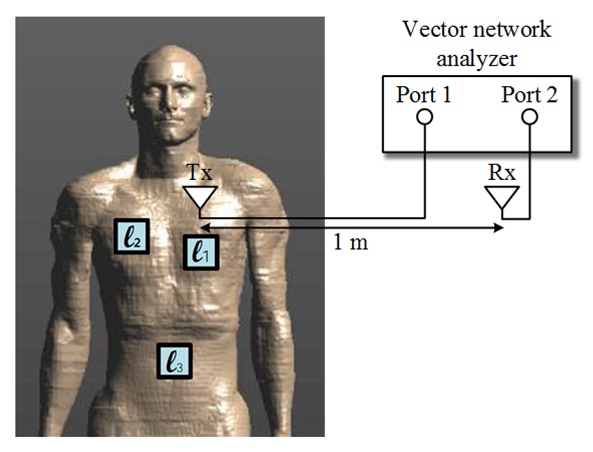
A schematic diagram of the measurement setup is shown in Fig. 3. The Tx antenna was placed at one of three positions (ℓ1, ℓ2, ℓ3) on the body, as shown in Fig. 3. ℓ1 is the position of the heart, ℓ2 is the position of the right upper-chest, and ℓ3 is the position of the navel. The Rx antenna was placed 1 m away from the body, at the same height as the Tx antenna. Hence, the path loss was assumed to be constant regardless of the Tx antenna positions. The VNA generated a continuous wave signal of 0 dBm (1 mW) and sent a continuous wave signal through the Tx antenna at the 2.45 GHz ISM band. The VNA also operated in a single trace and single frequency mode to measure RSS in the timedomain. In a sweep time of 1 second, 1,601 samples were recorded for each Tx antenna position. The experiments were conducted on the body of a 1.76 m/73 kg male subject and a 1.60 m/50 kg female subject, standing motionless in an anechoic chamber. For the real experiments, the Tx antenna was attached to the skin, but a gap with a thickness less than 1 cm could occur due to the body morphology. The effects of multipath, fading, and shadowing from the human actions were neglected in the experiments. For each setting, 10 experiments were carried out. The SEMCAD-X simulations used the Duke model (1.77 m/72 kg) and Ella model (1.63 m/58 kg). The simulation settings were identical to those of the real experiments.
Consider a WBAN system in which a Tx antenna is mounted on ℓ

where

where
III. ANALYSIS OF BODY ABSORPTION LOSS
1. Received Signal Strength and Body Absorption Loss
The time-domain results of RSS measurements for the male and female subjects are shown in Fig. 4. The RSS can differ according to the Tx antenna positions. In the case of the male subject, RSS at ℓ2 is higher than that at ℓ3 by around 7 dB (Note that RSS at ℓ
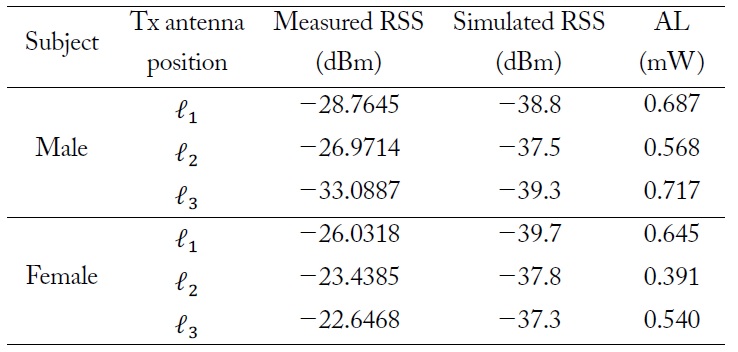
[Table 1.] Experiment and simulation results

Experiment and simulation results
Hence, the experiment and simulation results can differ. However, the order of RSS values in both experiments and simulations is identical. For the male subject, the lowest RSS is measured in both experiments and simulations when the Tx antenna is mounted on ℓ3, where a total of 0.717 mW is absorbed. The RSS is found to be highest at ℓ2, where the body absorption is lowest (0.568 mW). For the female subject, the highest and lowest ALs are observed at ℓ1 and ℓ2, respectively. As a result, the lowest RSS is measured when the Tx antenna is mounted on ℓ1. However, the RSS at ℓ3 is slightly higher than that at ℓ2, although
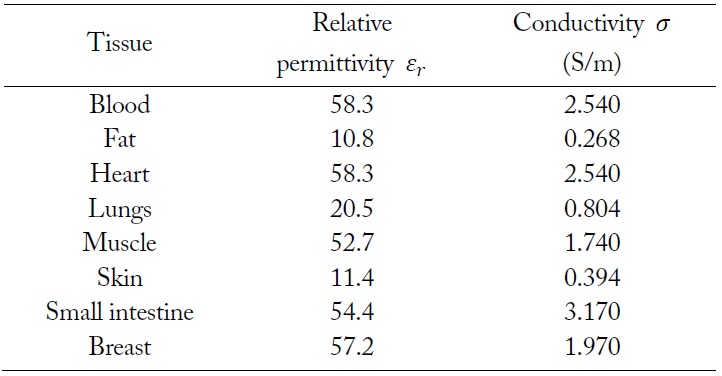
The total AL by the human body depends on temperature, frequency, and the dielectric properties of tissues around the Tx antenna [10,11]. In our investigation, the change in the dielectric properties according to the Tx antenna positions only makes a difference because the effects of temperature and frequency remain constant. Although the temperatures can differ at various body (Tx antenna) positions, note that the AL due to the body temperature is considered constant regardless of the positions since the temperature differences are insignificant. The dielectric properties are defined in terms of relative permittivity
[Table 2.] Simulated dielectric properties for various tissues

Simulated dielectric properties for various tissues
We recall that
Different results are obtained for the female subject than for the male subject:
The complexity and variety of body structures may preclude the derivation of explicit formulas that compute the body AL and measure its quantitative effect on the RSS. However, our investigation showed that the body AL is a dominant parameter influencing the RSS.
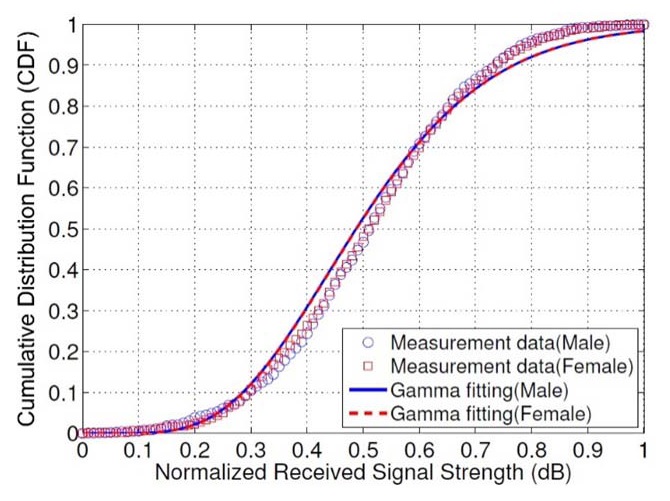
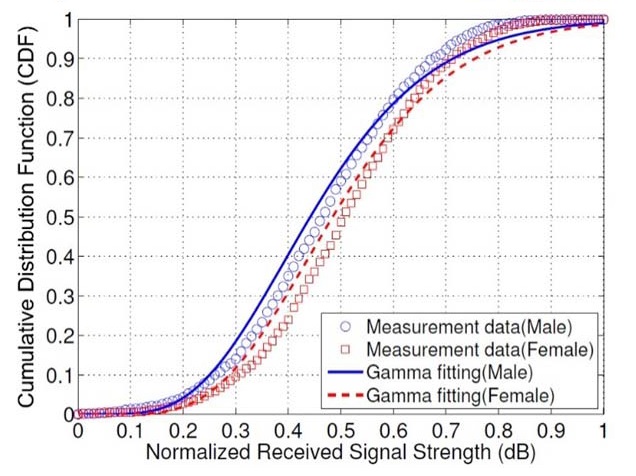
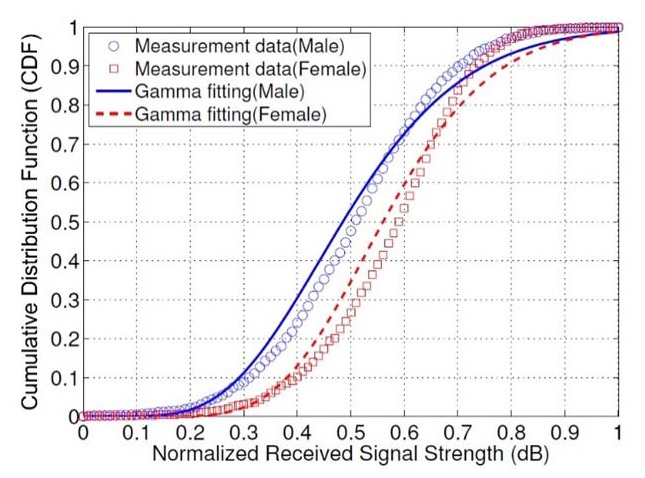
For the statistical analysis, all the RSS measurements from each Tx antenna position were normalized such that normalized RSS ∈ [0,1] dB. The normalized RSS is denoted by
The KS statistic is then defined as [14]

where
[Table 3.] Kolmogorov-Smirnov statistic value and estimated parameters
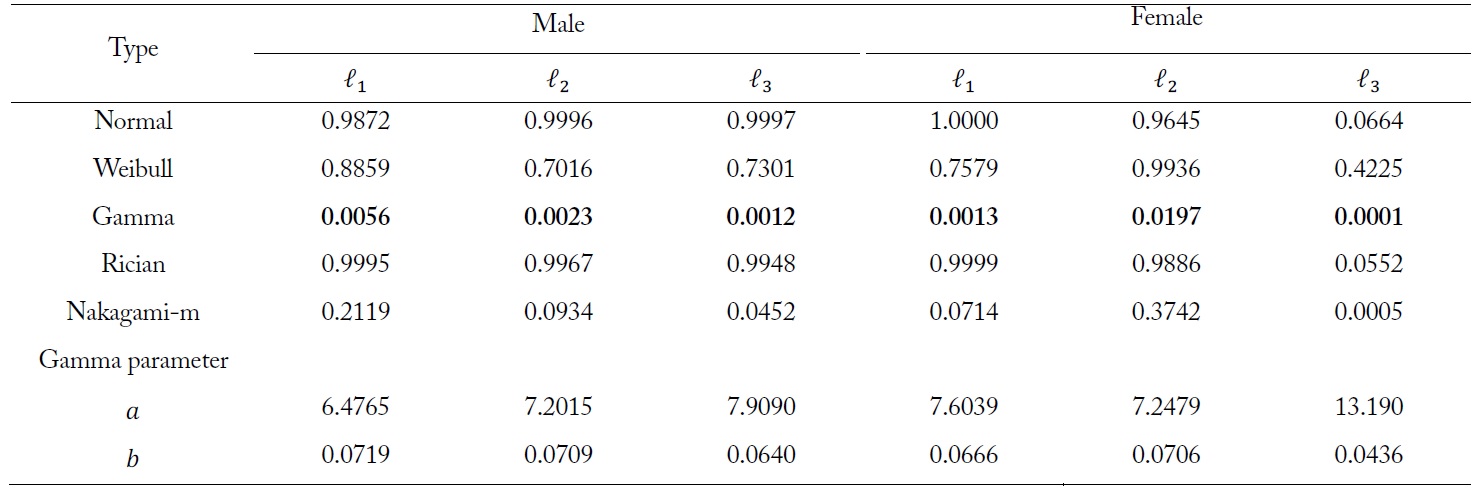
Kolmogorov-Smirnov statistic value and estimated parameters
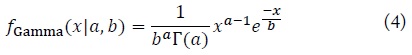
Meanwhile, the Gamma probability density function is given by

where
This paper investigates the on-to-off body channel characteristics at 2.45 GHz with respect to different Tx antenna positions. The experiments and simulations confirmed that different channel characteristics are observed according to the on-body Tx antenna positions and that they are dependent on the AL generated by the human body. Moreover, due to the differences in the body morphology and structure, we observed that the male and female subjects have considerably different channel characteristics. Statistical analyses were performed by comparing the measurement data to the theoretical reference distribution models. For all measurement sets, the Gamma distribution function provided the best fit to the experimental data. Our experimental results can serve as a good reference for future work on the on-tooff body channel characteristics, taking into account the effects of the antenna positions and the body AL. However, these results are presented only as guidelines since human beings have different body sizes, body structures, and body shapes, which need to be further investigated.