Lithium ion batteries are widely used as energy sources and energy storage devices today for their ability to achieve high voltages, high specific energy, and a long working life [1-4].
The advantages in regards to the reaction kinetics of transition metal oxides used in lithium ion batteries are their large surface area and spatial confinement. These oxides also offer additional active area for lithium ion insertion/extraction, thus enhancing the specific capacity and shortening path lengths to facilitate electronic and lithium ion transport, resulting in higher rate capabilities [5].
In the quest for better anode materials, Fe3O4, another transition metal oxide, has been investigated in previous studies because of its high theoretical capacity (~926 mAh g−1), abundance, environmental friendliness, and good electronic conductivity [6,7]. However, Fe3O4 suffers from rapid capacity fading due to a large volume change and severe particle aggregation during lithium ion insertion/extraction, resulting in electrode pulverization and loss of interparticle contact [8-10]. To overcome these problems, a few approaches such as coating with conductive materials [11-14], constructing well-defined nanostructures [15,16], and using flexible polymer binders [17-20] have been explored.
Carbon coating has been used to improve the cyclability of nanostructured electrode materials. The carbon in the coating buffers large volume changes and prevents aggregation of active materials [21-24]. In recent years, carbon nanofibers (CNFs) have become very attractive in the field of energy storage devices as current collectors to replace metallic grids/foils or as additives to improve the mechanical/conducting properties of electrode materials [25,26]. CNFs are very interesting owing to their high electrical conductivity of approximately 105 S cm−1 [27].
In this work, graphite nanofibers (GNF) are utilized as a carbon source and as conductive agents owing to their good inherent physical and chemical characteristics, such as their two-dimensional (2D) tube structure (herringbone stacking arrangement), excellent dispersibility, and uniform conductivity [28,29]. Until now, there have been no reports on Fe3O4-GNF composites for lithium ion battery anodes. Herein, we report the facile and scalable synthesis of Fe3O4-GNF composites for the first time. As compared with the common additive, graphite, Fe3O4-GNF composites exhibit a higher specific capacity and good cyclability. Additionally, the lithium ion diffusion coefficient increases by one order of magnitude higher than that achieved using GNF.
α-Fe2O3 (Aldrich Chem. Co., Ltd. 99.998%) and GNF (Carbon Nano-material Technology Co., Ltd. diameter: 50200 nm, length: ~30 μm) were mixed in various weight ratios (Fe2O3:GNF = 90:10, 85:15, and 80:20 wt%) by high-energy ball milling (Pulverisette 7, Fritsch Germany Co., Ltd.) at 300 rpm for 12 h. After being dried at 100℃ for 10 h, the powders were calcined at 800℃ for 6 h under N2 atmosphere. Finally, Fe3O4-GNF (10%), Fe3O4-GNF (15%), and Fe3O4-GNF (20%) were obtained. For comparison, an Fe2O3 and graphite (Graphite and Technologies CH-6743 Bodio, Switzerland, ~6.5 μm) composite (Fe2O3:graphite = 90:10 wt%; Fe3O4G (10%)) was fabricated using the same process mentioned above.
2.2 Materials characterization
The crystalline phases and structures of the active materials were identified by X-ray diffraction (XRD, Dmax/1200, Rigaku, Japan) analysis using Cu Kα1 radiation (λ = 1.54056 Å) at 40 kV and 40 mA. The morphology of the prepared active materials was observed using a field emission scanning electron microscope (FE-SEM, S-4700, Hitachi, Japan).
2.3 Electrochemical measurements
Electrochemical experiments were carried out using 2032-type coin cells. The working electrode was prepared by mixing the active material powders with poly(acrylic acid) (PAA, Aldrich, average Mv ~450,000) at a weight ratio of 90:10 in N-methylpyrrolidinone (NMP, Sigma-Aldrich Co. Ltd., ≥99%). The obtained slurry was spread onto a Cu foil using a doctor blade, and was dried at 140℃ under vacuum for 7 h. The coin cells were assembled in an argon-filled glove box using lithium metal as the counter/reference electrode, and 1 M LiPF6 in ethylene carbonate (EC) and dimethyl carbonate (DMC) (1:1 v/v) as the electrolyte. Cyclic voltammetry (CV, WBCS-3000, Wonatech, Korea) measurements were performed from 3.0 to 0.01 V at scan rates of 0.05, 0.1, 0.2, and 0.5 mV s−1. Galvanostatic cycling tests were conducted at a current density of 100 mA g−1 in the voltage range of 3.00.01 V at 25℃.
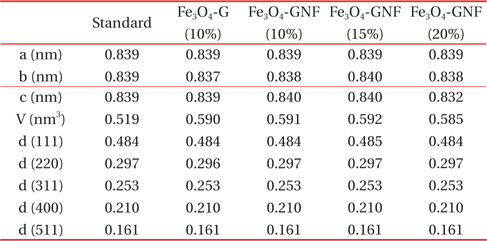
XRD patterns of the active materials are shown in Fig. 1. Figure 1(a) shows the XRD spectra of graphite and GNF. The spectra of both graphite and GNF exhibit a specific peak at 26.2°, which corresponds to the (002) crystallographic plane [11,30]. As shown in Fig. 1(b), Fe2O3 was transformed into Fe3O4 (JCPDS card No. 19-0629) after calcination in N2 atmosphere upon adding graphite or GNF. For the Fe3O4-G sample, a typical diffraction peak corresponding to the (002) plane is still observed at 26.2°, which can be attributed to crystalline graphite [31]. However, specific peaks for the (002) plane are not found in the Fe3O4-GNF samples, which may be due to the low intensity of the GNF peaks. Both the Fe3O4-G and Fe3O4-GNF samples show well-defined crystalline peaks, and the positions of the peaks are in good agreement with those of standard Fe3O4 (JCPDS No. 65-3107). The unit cell parameters and main-plane d-spacings of the Fe3O4-G and Fe3O4-GNF samples are shown in Table 1. According to calculations, all the patterns have a cubic structure of the space group Fd-3m, which is almost the same as that of standard magnetite. The five main-plane d-spacings of the Fe3O4-G and Fe3O4-GNF samples are also consistent with those of standard magnetite. These results demonstrate that the graphite and GNF additives do not change the crystal structure of the Fe3O4 particles.
[Table 1.] Unit cell parameters and main plane d-spacings of Fe3O4-G and Fe3O4-GNF.

Unit cell parameters and main plane d-spacings of Fe3O4-G and Fe3O4-GNF.
FE-SEM images of Fe3O4-G and Fe3O4-GNF are shown in Fig. 2. Both the graphite and the GNF can be clearly observed (yellow arrows). The obtained Fe3O4-G and Fe3O4-GNF samples had an average particle size of 100,300 nm. As shown in Fig 2(a), graphite is decorated by only a few Fe3O4 particles, most of which are not attached to the graphite and are separated from each other by a long distance. This long distance probably increases the lithium ion diffusion distance during insertion/extraction of Li+, resulting in the low diffusion rate of lithium ions [29]. As compared with the Fe3O4-G sample, the Fe3O4 and GNF particles of Fe3O4-GNF shown in Fig. 2(b), and at a higher magnification in Fig. 2(c), are closely bound to each other. The GNF is well interspersed among the Fe3O4 particles, shortening the lithium ion diffusion distance; consequently, the lithium ion diffusion rate is increased.
To understand the influence of the graphite nanofibers and the Fe3O4 phase present in the designed composite electrode on the electrochemical properties, CV was performed. Figure 3 shows the CV curves of the Fe3O4-G (10%) and Fe3O4-GNF (10%) composites recorded for the initial three cycles in the potential range of 3.00.01 V (vs. Li/Li+) at a scan rate of 0.1 mV s−1. In the first cathodic process, strong peaks for Fe3O4-G(10%) and Fe3O4-GNF(10%) are observed at 0.38 and 0.42 V, respectively. This could be attributed to the formation of a solid electrolyte interface (SEI), the reduction of Fe3+ and Fe2+ to Fe0, and the irreversible decomposition of the electrolyte. In the first anodic process, a broad peak is observed, corresponding to the oxidation of Fe0 to Fe2+ and Fe3+. Moreover, the oxidation/reduction voltage difference of Fe3O4-GNF(10%) (1.20 V) is smaller than that of Fe3O4-G(10%) (1.24 V), which indicates that the reversibility of Fe3O4-GNF(10%) is better than that of Fe3O4-G(10%). From the second cycle, the cathodic peak shifted to a higher potential, approximately 0.60.7 V, which is possibly related to the insertion of Li+ ions into the composite at different stages.
In subsequent cycles, the cathodic peaks of both samples shifted to approximately 0.96 V owing to electrode polarization, and the anodic peaks shifted slightly. However, both the currents and the integrated areas of the two peaks decreased substantially with cycling, indicating capacity loss due to the irreversibility of the electrochemical reaction.
CV is widely used to study the oxidation/reduction characteristics in electrochemical reactions and to obtain the apparent chemical diffusion coefficient of lithium ions. Figure 4 shows the CV curves of the Fe3O4-G and Fe3O4-GNF composite anodes during the third cycle at scan rates of 0.05, 0.1, 0.2, and 0.5 mV s−1 between 3.0 and 0.01 V. The irreversible behaviors become more obvious at higher scan rates, especially at 0.5 mV s−1. This phenomenon can be explained by the fact that lithium ions cannot be completely inserted into and extracted out of the surface of the electrode [32]. The apparent diffusion coefficients (DLi) of Fe3O4-G and Fe3O4-GNF composites were evaluated using the results from Fig. 4 and considering the irreversible system using the following equations [19,33,34]:


where Ep is the peak potential and E0 is the formal potential. The values of |Ep-E0| were calculated as half of the difference between the peak potential values at the anode and the cathode. R is the gas constant, T the absolute temperature, F the Faraday constant, A the actual surface area of the electrode, ΔCLi the concentration of lithium ions (ΔCLi = 2.25×10⁻² mol cm−3), α the transfer coefficient, n the number of electrons involved in the rate-determining step (n = 8), k0 the standard rate constant, ip the peak current, and v the scan rate (V s−1).
Based on Eq. 1, the value of DLi can be obtained from the slope of the plot of ip vs. v1/2 with the knowledge of α and the change in the lithium ion concentration (AΔCLi). Figure 5(a) gives the plots of |Ep-E0| vs. ln v for the Fe3O4-G and Fe3O4-GNF electrodes, which can be calculated by the values of CV rate results. The value of α can be estimated from the slope of the straight segments in Fig. 5(a) according to Eq. 2, and the results are summarized in Table 2. Figure 5(b) shows the plots of ip vs. v1/2, the ip values can be identified from Fig. 4. The peak intensity ip increases with v1/2 and shows good linearity within all scan rate ranges. The values of DLi of all samples calculated through Eq. 1 are given in Table 2. From the results, the apparent diffusion coefficients of Fe3O4-G (10%), Fe3O4-GNF (10%), Fe3O4-GNF (15%), and Fe3O4-GNF (20%) are 3.17×10⁻¹⁰, 2.29×10⁻⁹, 1.74×10⁻⁹, and 2.46×10⁻⁹ cm−2 s−1, respectively. Although the diffusion coefficient of the Fe3O4-GNF(15%) sample is slightly lower than that of the Fe3O4-GNF(10%) sample, the diffusion coefficients of all the three Fe3O4-GNF samples are of the same order of magnitude. It can be therefore considered that all the Fe3O4-GNF samples displayed approximately similar diffusion coefficients. As compared with Fe3O4-G, the lithium ion diffusion coefficient of Fe3O4-GNF was enhanced by approximately one order of magnitude. This may have been due the fact that the Fe3O4 particles in Fe3O4-G were separated from each other by a long distance, which increased the diffusion distance. Therefore, the Fe3O4-G sample has a low lithium ion diffusion coefficient.
[Table 2.] Electrochemical kinetic parameters obtained by CV rates.

Electrochemical kinetic parameters obtained by CV rates.
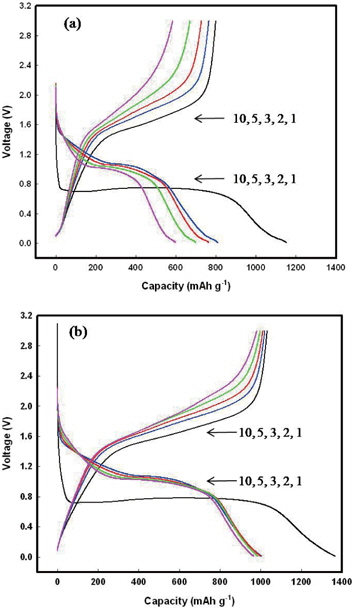
The electrode charge/discharge capacities were measured by galvanostatic charge/discharge cycling at a constant current density of 100 mA g−1 (0.1 C) over the potential range of 3.0-0.01 V. Figure 6 shows the 1st, 2nd, 3rd, 5th, and 10th charge/discharge potentials of Fe3O4-G (10%) and Fe3O4-GNF (10%). Both samples exhibit an extended potential plateau at approximately 0.8 V in the first discharge curve, which is similar to the value found in literature for Fe3O4-based anodes [35]. This extended plateau corresponds to the reduction of Fe3+ and Fe2+ to Fe0 [36]. In the charge process, Fe0 was oxidized to Fe2+ and Fe3+ again. The discharge and charge process can be corresponding to insertion/extraction of Li+ ion at the anode. The discharge and charge capacities are 1152 and 799 mAh g−1, respectively, for Fe3O4-G (10%), and 1,365 and 1,031 mAh g−1, respectively, for Fe3O4-GNF (10%). The irreversible capacity observed in the cycle resulted from the formation of SEI and the decomposition of the electrolyte. For the Fe3O4-G (10%) sample, the discharge capacity decreased rapidly from the second cycle, and only 600 mAh g−1 of capacity was maintained, thereby exhibiting poor cycling performance. In comparison with Fe3O4-G (10%), the discharge capacity of Fe3O4-GNF (10%) was well maintained during the subsequent cycles, suggesting that Fe3O4-GNF (10%) has good capacity retention. In addition, the discharge and charge potential stability of the samples shifted to higher potentials in the subsequent cycles, consistent with the CV results.
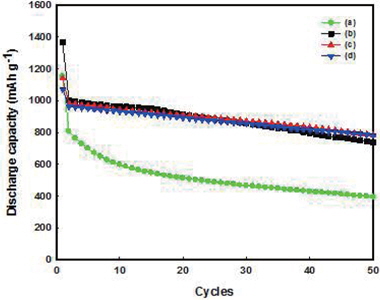
The capacity and cycling stability of Fe3O4-G and Fe3O4-GNF were tested at a current density of 100 mA g−1. As shown in Fig. 7 for Fe3O4-G (10%), the initial capacity was 1,152 mAh g−1 and it decreased to 809 mAh g−1 at the second cycle. After 50 cycles, only 30% of the initial capacity was retained (393 mAh g−1). In comparison, Fe3O4-GNF (10%) exhibited a high discharge capacity of 1,365 mAh g−1 at the first cycle and 1,003 mAh g−1 at the second cycle. From the second cycle, the discharge capacity decreased slowly. A capacity of 750 mAh g−1 was retained even after 50 cycles. Although neither of the electrodes had any conductive additives, the Fe3O4-GNF (10%) samples still showed good cycling performance. Moreover, with increasing amounts of GNF, the cyclability of the anode became more stable. The Fe3O4-GNF (15%) and Fe3O4-GNF (20%) composite electrodes maintained discharge capacities of 792 and 800 mAh g−1, respectively, and the Fe3O4-GNF (20%) composite electrode exhibited the best cyclability among all the samples. It is thus demonstrated that the addition of GNF can improve the electrode conductivity. In addition, the electrodes only consisted of active materials and a binder, with no added conductive agent such as carbon black; such construction can help improve the energy density of the lithium ion battery.
In summary, Fe3O4-GNF composites were used as anode materials to improve lithium ion storage, with the GNF being used instead of a conventionally used conductive additive. In spite of the absence of a conductive agent, the Fe3O4-GNF (10%) composite anode still showed good electrochemical performance because of the high conductivity of the GNF. Moreover, this composite can possibly improve the energy density of lithium ion batteries. The Fe3O4-GNF (10%) composite electrode exhibited a high lithium ion diffusion coefficient and good cycling stability. The Fe3O4-GNF (10%) composite electrode, specifically, delivered an enhanced specific capacity of approximately 750 mAh g−1 at a current density of 100 mA g−1 after 50 cycles, and had a high lithium ion diffusion coefficient, of 2.29×10⁻⁹ cm2 s−1. Moreover, the Fe3O4-GNF (15%) and Fe3O4-GNF (20%) composites electrodes exhibited a higher specific capacity of 783 mAh g−1 at the same current density after 50 cycles. Although, the cyclability needs to be further improved, we think GNF is a suitable and promising active material that can be applied to lithium ion batteries.