Polymer nanocomposites exhibit enhanced properties when compared to conventional polymer matrices. These properties have been extensively studied, and the results thereof can be found in the existing literature [1]. Inorganic nanoparticles - metals (alloys, pure metals) or ceramics (oxides, nitrides, carbides) - are mainly used in such nanocomposites, and due to the universality of the oxidation reactions, an oxide layer constitutes the surfaces of all nanoparticles. The thickness of such a layer is more or less important, with the notable exception of gold and carbon compounds, since this oxide layer presents a hydrophilic surface of oxygen atoms that results from the non-ligand electronic doublet of oxygen and the polar nature of water. Polymeric matrices are mainly hydrophobic, so the dispersion of inorganic nanoparticles in polymers is problematic. In addition, the hydrophily of the fillers introduces a certain water uptake in the nanocomposite during fabrication. Since the water is located at the interface between the silica and the matrix, from which the properties of the nanocomposites are derived [2], we observe a modification of the physical properties of the material. Specifically, the dielectric constant and the loss of the composites increases, as does the conductivity [3,4]. Moreover, Plueddemann has shown that even if the composites are prepared under perfectly dry conditions, water will still reach the interface by diffusing through the hydrophobic polymer [5]. The solution to this problem is usually to graft carbon chain cations at the interface between the filler and the matrix. In addition to impeding water uptake [6], this surface treatment also improves the compatibility between the hydrophilic nanofiller and the hydrophobic matrices, such as the polymers. However, a certain part of the hydrophilic nature of the silica will remain since the grafting process is never entirely effective.
Moreover, heterogeneous materials, such as nanocomposites, exhibit a specific relaxation peak in the imaginary part of their permittivity, corresponding to the charge storage at the interface between media that have different dielectric properties. This is called the Maxwell-Wagner-Sillars effect [7], and it is characterised by a retardation time τ that corresponds to the dynamic variation of the charge transportation.
In this study, we investigate the kinetic characteristics of the drying that occurs when oxide additives are added to a polymer matrix. The interface properties of silica/high-density Polyethylene (HDPE) nanocomposites is investigated via dielectric spectroscopy, particularly by examining the interfacial peak during drying. Nanometric silica was chosen since it is extensively used as a filler due to its ease of production, its low cost, and its availability in a wide range of sizes. HDPE was chosen as a matrix material because it also has widespread use and is well known to exhibit hydrophobicity.
Nanocomposite HDPE/SiO2 samples with 0, 2, 4, and 5% of nanosilica content by weight were compounded using a twin screw extruder. The spherical, unfunctionalized SiO2 nanoparticles (Nissan Chemical Snowtex ST-O) have an average diameter of 15 nm and are 99.9% pure. The polyethylene powder (Petromont HDPE 7000) and the nanoparticles were premixed before being introduced into the extruder. The extrusions were then carried out at a rotating speed of 100 rpm at a temperature of 220℃ with a residence time of 10 min. Infrared measurements were conducted using Fourrier Transform InfraRed spectroscopy on various samples, and the results did not show for any noticeable oxidation to have occurred during processing. The pellets obtained after extrusion were then hot pressed at 160℃ under 5 MPa into plates of around 1 mm in thickness.
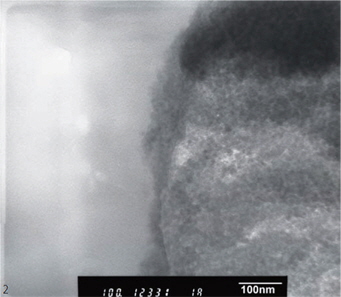
The samples for microscopy were prepared at ambient temperature using Ultramicrotomy with a diamond knife. The 20 nm slices obtained were then observed via scanning and transmission electron microscopes.
The dielectric relaxation spectroscopy was carried out in a parallel plate geometry using circular brass electrodes measuring 40 mm in diameter. The Novocontrol Concept 40 α-analyzer interfaced with the sample by using a broadband dielectric converter (BDC, Novocontrol), which allowed us to obtain the complex dielectric function:

where f is the frequency, ε' is the real or conservative part, and ε" is the imaginary or loss part.
A 3 VRMS voltage was applied across the samples, and the isothermal dielectric measurements were performed in the 10−1 to 3.106 Hz frequency range under a nitrogen atmosphere. The measurements were isothermally conducted at 80℃ for a period of almost 21 h, for which each scan lasted approximately 5 min and 14 s. The temperature stability was maintained at △T = 0.1 K. Isothermal scanning was also conducted from 20 to 80℃, in 10 K steps, before and after drying. First, measurements were conducted for the as-received samples after these had been conserved for 3 years in ambient conditions. To test for reversibility, the same methodology was also applied to the same samples after 20 days in an atmosphere with 70% moisture content. The sample masses were measured before and after drying, and these did not show any significant evolution.
The dielectric spectra were analyzed by fitting the interfacial peaks using the Levenberg-Marquardt iterations with the following Havriliak-Negami function [8]:

where ω is the angular frequency (ω = 2πf), ε∞ is the un-relaxed dielectric permittivity or the high-frequency permittivity, Δε is the dielectric relaxation strength, τ is the retardation time, αHN and βHN are the Havriliak-Negami parameters that respectively describe the symmetric and asymmetric broadening of the relaxation time distribution function. The following power law function was used for the frequency-dependent contribution of the fluctuation in the charge carrier [9]:

where A represents the intensity of the charge fluctuation phenomenon and n defines the frequency dependence (0 < n < 1). After several fitting procedures, the accuracy for each parameter was estimated at 5% on the retardation time.
A thermogravimetric analysis was performed on the asreceived and moistened samples by using a Thermal Analysis Instruments Q50 apparatus. The stability of the temperature was measured at ΔT = 0.1℃ and the weighing precision was of about 0.01%. The isothermal analysis were conducted at 80℃ over a duration of 21 h under a nitrogen atmosphere.
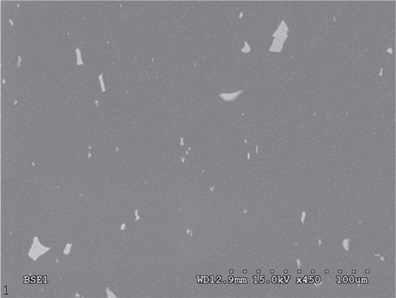
Figures 1 and 2 respectively present the SEM and TEM images of the sample containing 2 wt% nanosilica. Figure 1 shows that the structure is agglomerated, and Figure 2, which focuses on the silica agglomerate, shows that the nanosilica is still packed. A numbers of nanoparticles were found to have stuck together with no penetration of polyethylene molecules between them, and this structure is an observed trademark of our nanocomposites samples.
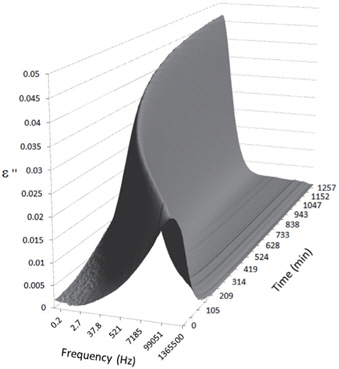
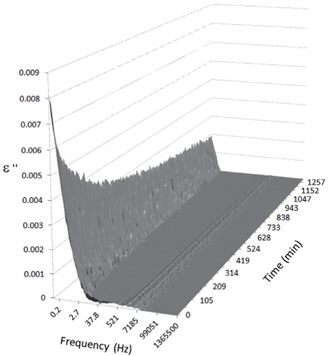
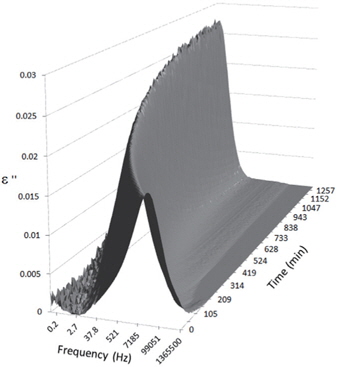
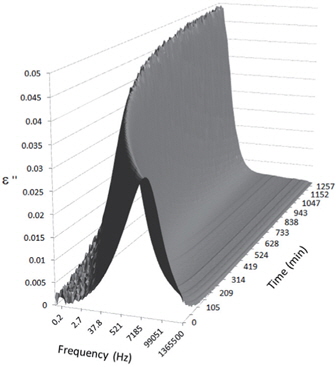
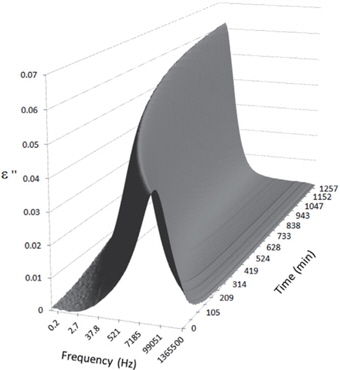
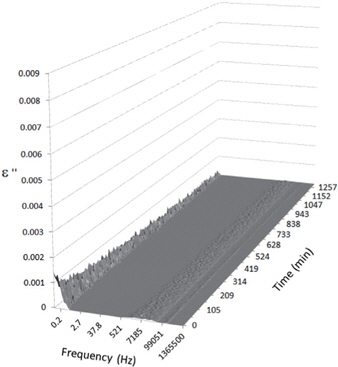
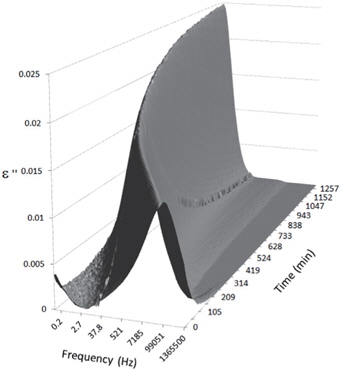
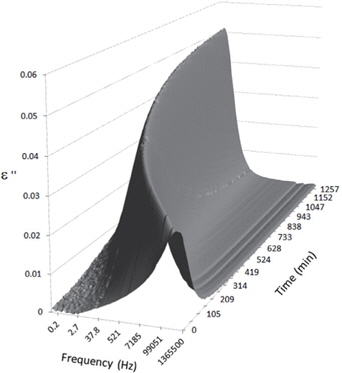
Figures 3, 4, 5, and 6 present the dielectric loss spectra as a function of drying time for a pure HDPE sample and for samples containing 2, 4, and 5 wt% of nanosilica, respectively. The spectra of the HDPE sample exhibit only an increase in the imaginary permittivity at low frequencies due to the conductivity phenomenon. The intensity of this phenomenon decreases as the drying time increases. This is certainly due to the departure of water from the sample through the interface between the sample and the surrounding atmosphere. The pure HDPE sample also exhibits a very weak peak centered at a frequency of around 10 kHz, and this does not move with drying time. This peak originates from systematic noise coming from the apparatus, and its intensity is close to that of the stated precision, so it is considered to be negligible. The spectra of the nanocomposite samples show a loss peak shifting to lower frequencies and a sharpening as the drying time progresses. This peak is related to the Maxwell-Wagner-Sillars effect [7], and it is a result of the charge transfer retardation at the interface between phases with different dielectric properties. The surface of the peak seems to increase as the silica content increases, implying that there is an increase in the amount of interface between the silica and polyethylene matrix.
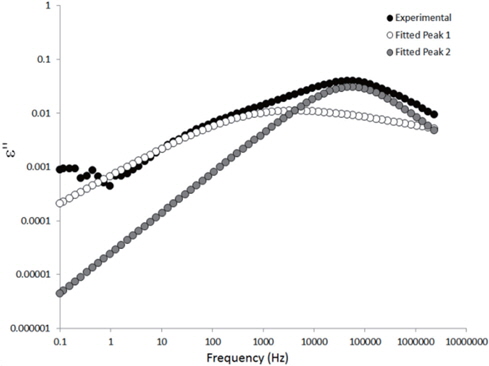
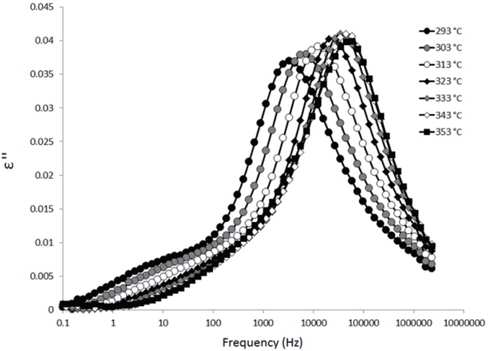
The loss spectra of the moistened samples of pure HDPE and nanocomposites containing 2, 4 and 5 wt% of nanosilica are presented in Figures 7, 8, 9 and 10, respectively. The typical behaviour of the spectra is the same as that for the as-received samples. Therefore, the pure HDPE sample exhibits a much lower intensity in the conductivity phenomenon. This shows that water uptake is not reversible for pure HDPE, and that the initial quantity of water should be introduced during the fabrication process. The electrode polarisation peak is also within the same range of intensity and frequency, demonstrating that this phenomenon does not significantly depend on the water content of the sample. For the nanocomposites, the interfacial loss peak at the beginning of the drying cycle is one frequency decade higher for the moistened samples than for the as-received samples. Moreover, when the spectra are observed before drying, it is clear that the interfacial peak is in fact constituted of two superimposed peaks. The spectra taken before drying for the as-received HDPE sample containing 5 wt% of nanosilica are presented in Figure 11 as an example, and the decomposition of the first spectra at 80℃ is presented in Figure 12. Typically, there are two loss peaks for all samples, one greater in intensity at a high frequency and one lower at low frequencies.
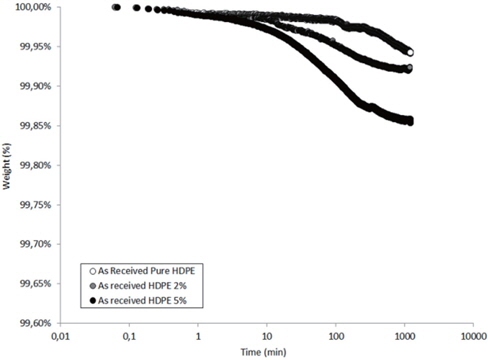
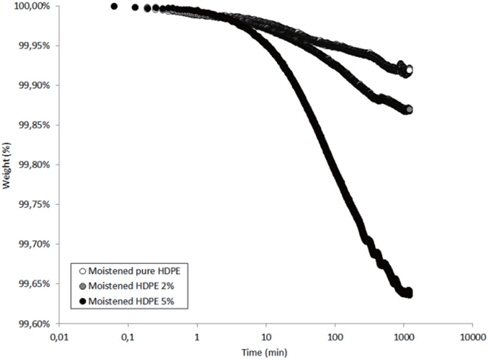
Figures 13 and 14 present the TGA results of the as-received and the moistened samples during drying at 80℃. The losses in the drying mass increase as the hydrophilic nanosilica content increases, and thus, should correspond to the removal of water.
The mass loss kinetics put in evidence the three classical drying regimes:
- At short times, a very low mass loss is a result of the departure of water at the sample surface (about 0.01 wt% in the studied hydrophobic HDPE samples). - A logarithmic decrease of the mass, corresponding to the continuous departure of water from inside the sample. - A stabilization of the sample mass corresponding to the water content equilibrium in the sample at the drying temperature. This presence of this last regime can only be guessed by observing the slowing of the mass during drying time.
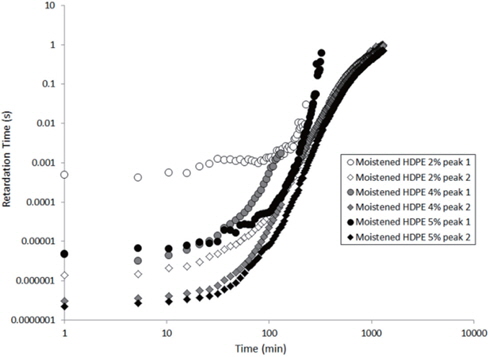
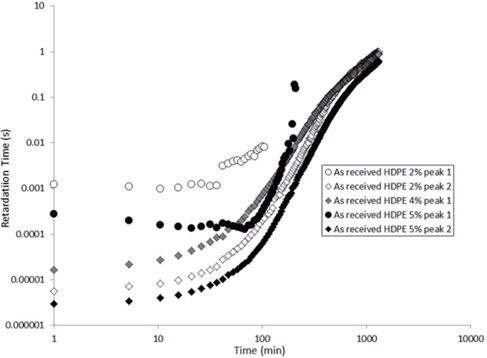
The values extracted for the retardation times (from Eq. 2) are plotted as a function of the drying time in Figures 15 and 16 for the as-received and the moistened samples, respectively. “Peak 1” refers to the low-frequency peak and “Peak 2” to the high-frequency peak. Unfortunately, we have not been able to separate the two peaks of the as-received sample containing 4 wt% of nanosilica because the two peaks are too close in frequency. The first peak shows a short plateau in the retardation time followed by a fast increase until the peaks can no longer be deconvoluted by the fitting procedure given the frequency limits of the experiment. The second peak also exhibits a shorter plateau in the retardation time followed by a fast increase and, as may be guessed, an initiation of the stabilisation. These regimes correspond to the mass loss kinetics observed in TGA, so they can be linked to the departure of water from the internal volume inside the sample.
According to Steeman et al. [10,11] the retardation time is inversely proportional to the water content of the HDPE nano-composites at interfacial conductive layer. In fact, studying the variation in the retardation time along with the drying time is equivalent to studying the decrease in the water content of the interface as drying progresses since the retardation times increase as the drying time increases, as seen in Figures 15 and 16.
The hypothesis here is that the second peak is associated with the agglomerate interface and the first peak to the interface within the agglomerate, that is, the nanosilica/water/nanosilica interface. This hypothesis is supported by the higher relaxation time of the first peak, that is a result of the greater polar interaction of water in the agglomerate, because one water molecule has to interact with two nanosilica surfaces.
In order to explain the evolution of the retardation time for the second peak, the water content at the interface of the agglomerate must be considered. Water in the nanocomposite samples is concentrated at the agglomerate interface due to the nanosilica hydrophily, but this is also because the zone close to the interface has a greater free volume than the matrix, as demonstrated by Vollenberg and Heikens [12] or Nelson and Utracki [13]. This free volume, resulting from the interaction between silica and water, is saturated by water molecules. Following the free volume content, the water concentration increases as the distance to the interface decreases [13]. Thus, the water in this free volume must be removed in order to allow for the water at the interface to diffuse. This removal is permitted by the increase in the free volume in the matrix that results from the increase in temperature. However, the free volume content decreases, and the distance from the interface represents a bottleneck for the water diffusion mechanism. This explains the plateau in the retardation time at the beginning of the experiment, as observed in Figures 15 and 16. Afterwards, an equilibrium diffusion regime is observed as the water is continuously removed from the agglomerate interface. Finally, the stagnation in the retardation time is explained by the rarefaction of the water molecules at the water interface.
For the first peak, the plateau is longer because the internal water must proceed to interface of the agglomerate before being scattered to the polyethylene matrix. As this interface is saturated by water, the plateau then corresponds to the time required for the water content at this interface to begin to decrease.
Finally, when the curves of the as-received and moistened samples in Figures 15 and 16 are compared, we see that the retardation times are one decade lower for the moistened samples than for the as-received samples. This is due to the higher water content at the nanosilica agglomerate interface. Thus, the introduction of nanosilica in hydrophobic polyethylene renders the resulting nanocomposites to be hydrophilic due to the hydrophily of nanosilica and to an increase in the free volume related to the nanoparticle interface.
The nanosilica/polyethylene samples were prepared by compounding, and the obtained structure showed a number of micro-size agglomerates for all samples. The water departure was observed via TGA, and variations in interfacial peaks were followed via broadband dielectric spectroscopy on the as-received and moistened samples during drying. The resulting spectra exhibited two superimposed interfacial peaks, with the lower frequency peak being associated with the nanosilica/water/nanosilica interface in the agglomerates and the higher one with the agglomerate interface. Since the extracted retardation time was inversely proportional to interfacial water content [10,11], its evolution could be explained to be a result of the hydrophily of nanosilica and the free volume introduced by the nanoparticles [13]. Moreover, the addition of nanoparticles demonstrated an increase in the resulting material hydrophily.