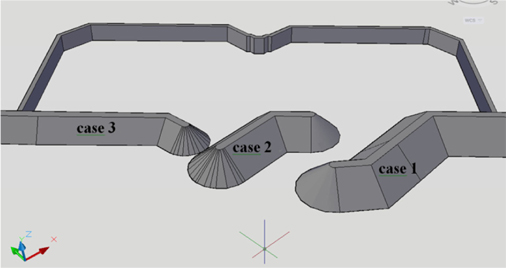
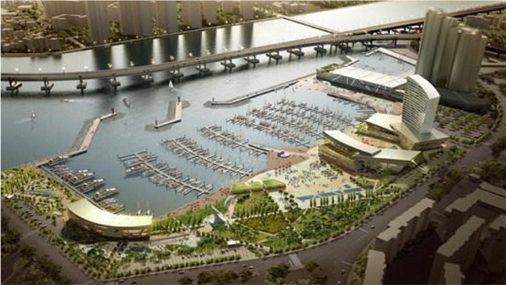
Coastal walls are structures that are parallel to and near the shoreline to protect beaches and building and facilities for achieve coastal security. The coastal wall shape and type of aggregate, are divided into different types, which include rubble mound breakwaters. The rubble mound type can be separated to two categories: static stability (traditional) and dynamic stability. One of the most important parameters in a breakwater is wave overtopping. Breaking waves play a significant role in virtually all coastal engineering problems. A large number of factors influence the design of the crest freeboard. These factors are related to the breakwater geometry, structural material and hydrology statistics. The geometrical parameters in coastal engineering design play important roles; the parameters include the free board, crest and width shape, slope of the tetrapod layer, and water depth. Over the past few decades, a variety of breakwaters have been developed. Since these varieties were implemented, the results have indicated that the structures are far from optimal. The freeboard parameter is also the main parameter for the design of a breakwater. The rubble mound breakwater has been considered in South Korea’s, Busan yacht Harbor. The East, Middle and West rubble mound breakwaters in this area of the beach are the most suitable design for this investigation into the effects irregular waves (Busan Port Authority, 2011). In Busan Yacht Harbor, in the case of the East, Middle and West breakwater structures, the design analysis has been complicated by physical processes that depend on the hydro dynamical situations (waves, wave height, wave period, etc.) and the type of breakwater. To the best of the authors’ knowledge, there is still lack of information on the effects of vertical wall and tetrapod weights within the rubble mound structures in response to complex 2 dimensional incoming waves to the harbor. Among the existing literature, (Park et al., 2014; Zanuttigh and Van der Meer, 2006) examined the effects of vertical wall in a rubble mound structure and in the presence of various types of tetrapod weights but they did not consider the different water levels at the entrance of the rubble mounds under irregular direction incoming waves. Marina, which is South Korea’s main port, connects the country to the Pacific Ocean and Asia, and contributes 40% of the country’s overseas cargo, and 40% of Korea’s national fishery manufacture (Busan Port Authority, 2011). To protect the Busan coastal area, rubble mound breakwaters have been studied extensively as a countermeasure, and then constructed to reduce the negative impacts of irregular waves attacking the Busan shoreline. Another unique point about the yacht harbor is the presence of different water levels just at the entrance of the harbor. This increases the complexity of the flow field at the entrance of the rubble mound structures. Figures 1 and 2 present images of this bridge as well as the location of the rubble mound structures in Marina, South Korea.
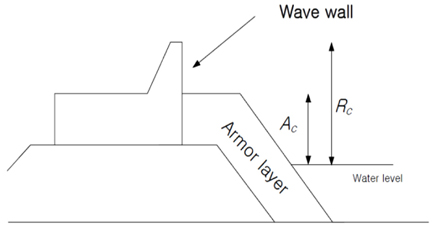
On the other hand, little research had been carried out on the role of the freeboard parameter in design. A few examples include (Owen, 1980; Goda, 1985), and more recent analysis of Rubble Mound Breakwaters includes (Aminti and Franco, 1988; Van der Meer and De Waal, 1992; Van der Meer et al., 2005; Bradbury and Allsop, 1988; Muttray et al., 2006; Holthuijsen, 2007). Concerning rubble mound breakwaters in comparatively deep water, Jensen and Juhl(1987) examined consequences from an irregular wave model tests and some different projects were approved at DHI, and his work was later reanalyzed by Jensen and Juhl(1987). While this work is beneficial, it is limited by the condition of geometry and the specific conditions of the tested rubble mound breakwaters. Pullen et al.(2007) recommended the installation of vertical walls on the rubble mound breakwater structure to reduce the overtopping discharge. They suggested that the wall height to be in the same elevation of the armor crest level because wave action forces on the vertical wall will go up severely by action waves and not hidden behind the armor crest if directly were attacked, Pullen et al.(2007). In this study, physical model tests were finished with the aim of well understanding the empathetic hydrodynamic procedures that allowed the above-mentioned area of the Rubble Mound to remain safe when subject to irregular wave’s action. In particular, four kinds of freeboards and tetrapod’s sizes in the case of East, Middle and West Rubble Mounds have been investigated. This research focuses on the East, Middle and West Breakwater Rubble Mounds in Busan Yacht Harbor (see Figure 1) with a specific scale of 1:40. The freeboard was studied in coastal experimental tests, and the experimental results were obtained.
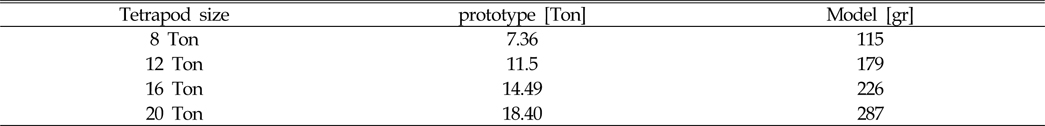
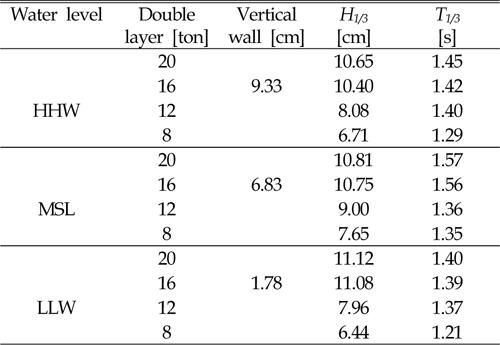
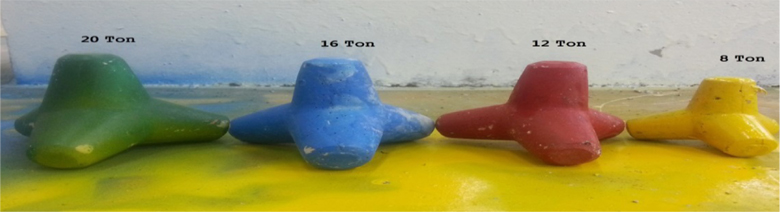
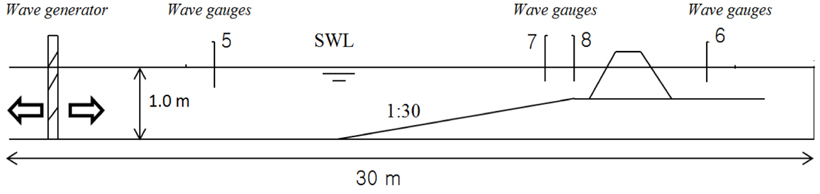
The 2D physical experiments were completed in the wave flume of the Coastal & Ocean and Harbor Engineering Laboratory. Length, width and height of the test flume was 30m, 0.60m and 1 m, respectively. All tests included three kinds of water levels (Table 1) in the water levels (low level of water, mean sea level and high water level), based on a JONSWAP(Joint North Sea Wave Project) spectrum. The wave generator paddle in a 0° angle wave attack provided mechanically irregular waves on the flume, which is controlled by a personal program. The program on the computer can be used to generate regular, irregular and a variety of other wave conditions. After finding the irregular waves precisely, the computer program was used to make waves with a generator (wave period, wave height) according to a model in the scale of the prototype. Figure 3 shows a photograph of the four tetrapods used in the present study (8, 12, 16 and 20 ton). Table 2 compares the weights of the tetrapods between the actual and physical model. The present experiment made used 4 wave gauges (Mansard and Funke, 1980), the first wave gauge was in front of the generator (5 channel), the second wave gauge was 2 meters in front of the crest rubble mound (7 channel), the third gauge was 1 meter from the crest rubble mound and in front of the structure (8 channel), and the last gauge (channel 6) was behind the structure 1 meter away from the crest of the rubble mound (Figure 4). Figure 5 presents a cross section of the East, Middle and West breakwater rubble mound. The distance from the crest height of the tetrapod to the superstructure was constant under all test conditions.
[Table 1] Three kinds of water levels for the experiment and the corresponding design level (D.L)

Three kinds of water levels for the experiment and the corresponding design level (D.L)
[Table 2] Comparison of weight of the tetrapods in the actual and physical model

Comparison of weight of the tetrapods in the actual and physical model
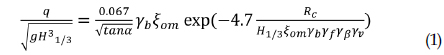
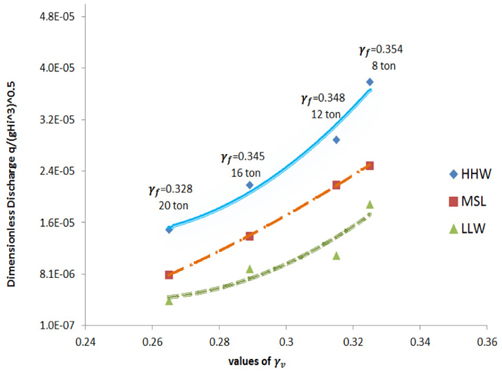
The present data was analyzed with the Van der Meer(2002) formula to complete the certainty of the results for wave overtopping in this paper, that characterize the wave overtopping discharge for irregular waves. A connection of the experimental consequences with Van der Meer’s formula, Eq. (1) displayed that the present wave overtopping discharge estimator administers good reaction. For each tetrapod in the existence of no vertical wall the roughness factor (
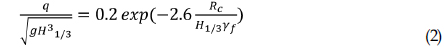
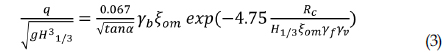
The complete formula (Van der Meer, 2002; Pullen et al., 2007) is

if
Furthermore, if gamma

where
Estimating that the roughness factor did not change for each tetrapod weight, this inquiry checked out the influence of different vertical walls (Figure 6) and relationship between them on the overtopping discharge and Eq. (3).
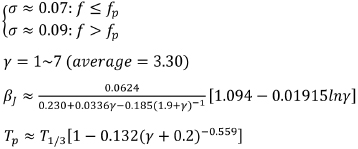
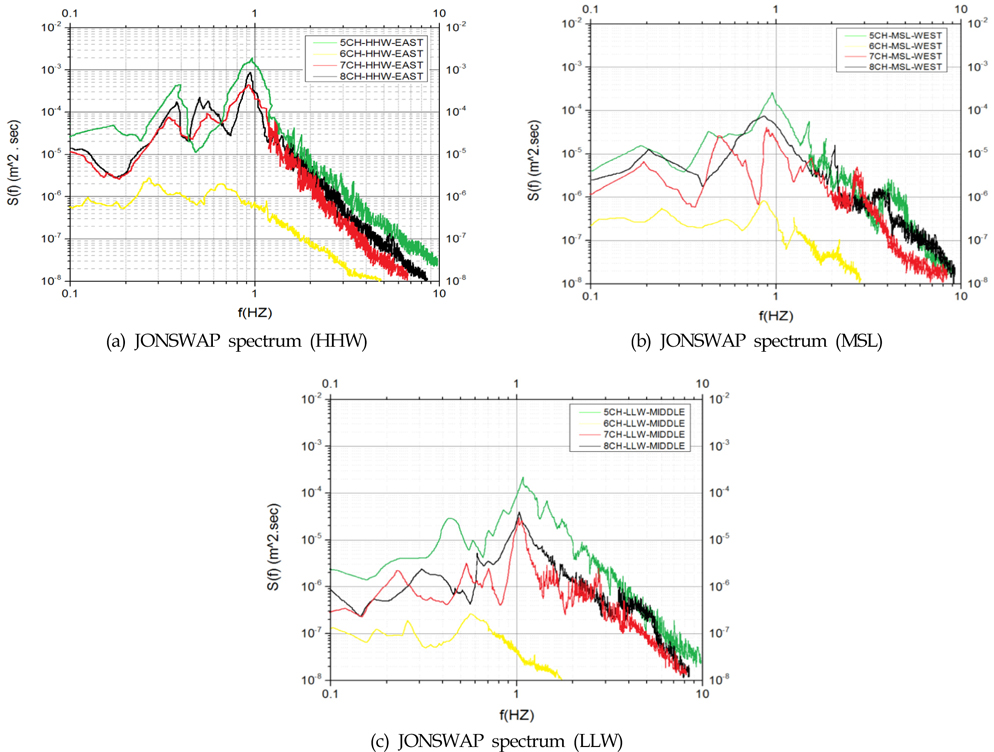
An empirical relationship that defines the distribution of energy with frequency within the wave action was the JONSWAP spectrum (Hasselmann et al., 1973).
(Goda, 1988), JONSWAP spectrum modified Eq. (4) to be substantiated in terms of the peak wave period (

Where

Here, H1/3 is the significant wave height, H1/3 is the significant wave period (Table 3),
[Table 3] Data of rubble mound breakwater

Data of rubble mound breakwater
>
JONSWAP Energy Spectrum Distribution
In the three water levels (H.H.W, M.S.L, and L.L.W), the climb in frequency went up the JONWAP energy spectrum. Significant wave height
>
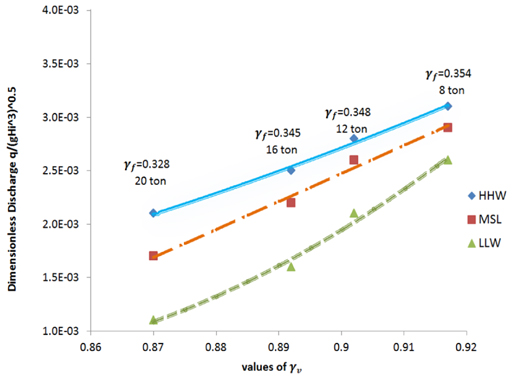
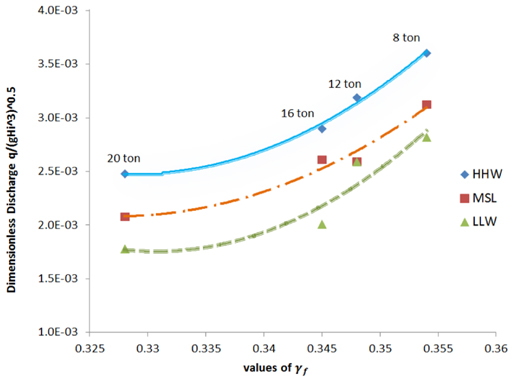
Influence factor for a vertical wall (γv) and roughness (γf)
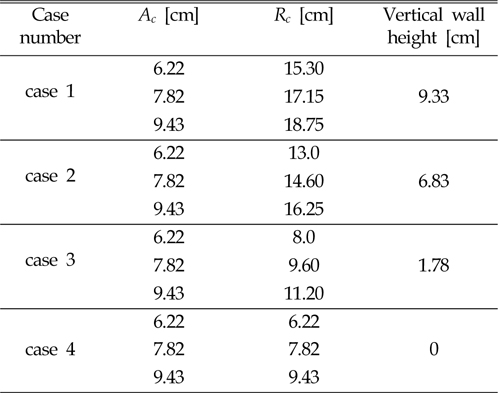
Three different initial water levels executed in the flume and upstream of the rubble mound and i.e. low level of water (L.L.W), mean sea level (M.S.L), and high water level (H.W.L). Table 3 presented that there was no vertical wall (case 4) above the crest freeboard and

Example input file for an analysis of the influence factor for a vertical wall (γv) with first three calculations
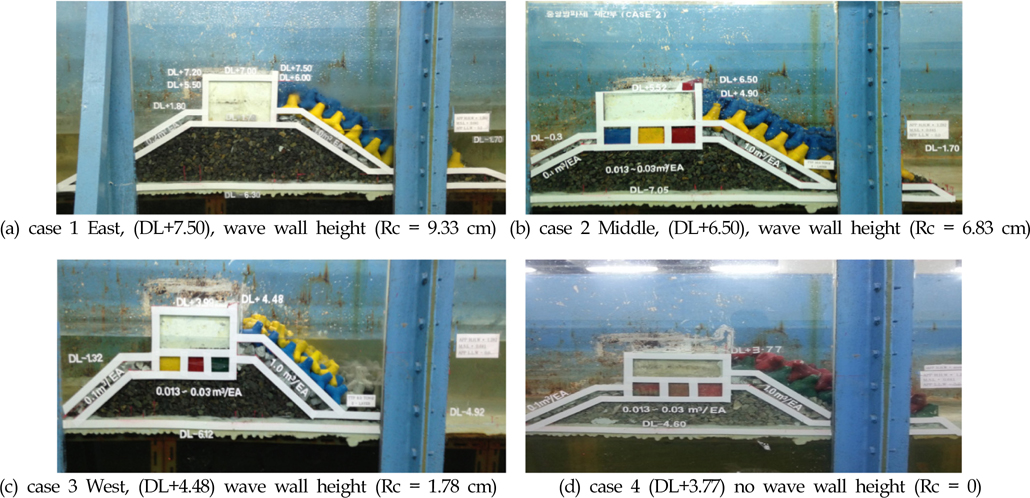
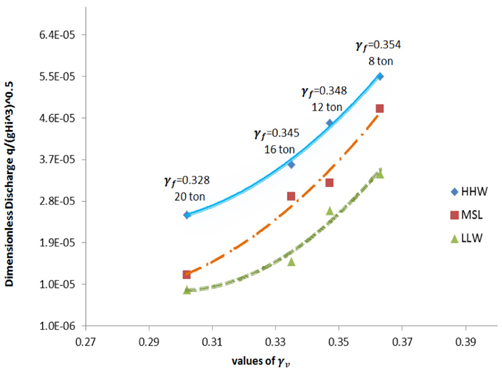
A consolidation of 4 different heights of vertical wall (0, 1.78, 6.83 and 9.33 cm) and different sizes of tetrapod (8, 12, 16 and 20 ton) were checked out. Archive the test composition operated in this research results-based of (Park et al., 2014). In presence of a tall and middle freeboard (case 1 and 2), the value of wave overtopping discharge is mutually influenced by the vertical wall factor. Moreover, the tetrapod size is went down to by rising vertical wall factor, and relationship between them presented in the short wall height by refer to Figure 8 to 11.
The distributed of wave overtopping versus the reaction of the vertical wall factor (
In case 3, [vertical wall = (the level of the vertical wall crest) (the level of the armor crest)] which is balanced to 0.71 m in the prototype, or 1.78 cm with a scale of 1/40 in the ongoing substantial model. Developing the water levels from LLW to HHW did not have a serious response on the wave overtopping volume with a short vertical wall (less than 1.78) (Figure 10). the significance of the vertical wall factor explored between 0.870~0.917 and approximately nearby to (
The consequences of the physical model for the effects of link between roughness and vertical wall factors on wave overtopping tests, which were performed as part of the design in Busan Yacht Harbor, Busan, South Korea, were used to test the expression on different vertical wall height along with variation of the tetrapods weights. The results of this study suggest that a decrease in the freeboard and size of tetrapod established a new hydraulic condition for the overtopping mechanism and consequently, sudden growth was observed in the amount of overtopping discharge. First, the tetrapod size played an important role due to the short vertical wall; this means that the effect of the influence of the roughness factor (