Polymeric material has many advantageous qualities, such as low density, relatively good mechanical properties, and insulating properties (heat and electricity). The insulating properties of polymers can be helpful for applications such as antistatic, electrostatic dissipation, and electromagnetic interference shielding. Conductive fillers (e.g., carbon black, metallic powder, carbon fiber) are commonly used to make polymeric insulating devices and electronic components for electrostatic charge control. However, as much as 10-20 wt% of these fillers need to be added to polymers to achieve the required electrical conductivity. Because of this additive content, the polymer products may exhibit particle sloughing and degradation of mechanical properties.
Since the discovery of carbon nanotube (CNT) in 1991 [1], there have been numerous scientific and technological studies aimed at preparing CNT/polymer nanocomposites. Because of its high aspect ratio, good electrical conductivity, high thermal conductivity, and exceptionally high tensile strength [2], it is possible to improve mechanical, thermal and electrical properties of the polymeric matrix with low CNT content [3-9]. Although single-walled CNT (SWCNT) possesses better properties than multi-walled CNT (MWCNT), most of the polymer/CNT composites used for real applications have been MWCNT/polymer because of the high cost, bad dispersibility and low productivity of SWCNT. The addition of a small amount of MWCNT to a polymer matrix provides the potential to fabricate a conductive polymer composite without reducing its inherent properties (e.g., good impact strength, good fluidity for processing, and low density).
Even though the MWCNT in the polymer composite has a low percolation threshold for the electrical conductivity, even lower CNT concentration for the desired conductivity is necessary because of its higher relative cost. Electrical percolation occurs at about 0.05 wt% of CNT in ideal dispersion, as explained by Kirkpatrick’s power law equation [10]. According to previous studies of MWCNT/polymer composites, the percolation thresholds for electrical conductivity were 1-5 wt% MWCNT [11,12] by simple mixing. To reduce the MWCNT content needed in composites, a variety of methods (e.g., processing, modifications, and immiscible blending) have been attempted [4,13-15]. To achieve the required properties, however, several technical issues should be resolved. One is how to induce and keep the dispersion and distribution of CNT in the polymer matrix homogenous [16], because CNTs have a highly entangled network structure and tend to agglomerate into bundles [17]. Recently, the effects of dispersion quality and MWCNT-length on the rheological and electrical properties of MWCNT/polymer composite have been studied extensively using various melt-compounding conditions [18]. At a fixed composition, some orientations of CNT reduce the number of connections between nanotubes, showing that the nanotube network is disturbed by shear and elongation [18-23]. Electron microscope images confirmed that formation of a conducting pathway through the strand sample could be significantly reduced by certain orientations of tubes in the shear direction.
Polycarbonate (PC) is an important commercial engineering plastic used in electronic goods such as mobile phones and display frames. PC manufacturers are very interested in PC/CNT nanocomposites to expand the use of PC, to include electrostatic dissipation and electromagnetic-interference-shielding applications. Since the injection molding method is the only choice for such applications due to the demands of mass production, clear understanding of the relationship between injection molding conditions and the electrical conductivity of the PC/CNT nanocomposite is an important research topic.
In this study, MWCNT/PC nanocomposites with varied MWCNT content were prepared by using a twin-screw extruder (co-rotating, intermeshing). To investigate the effects of MWCNT orientation on the electrical conductivity of MWCNT/PC nanocomposites, two sample preparation methods were used. Compression molding provides minimal shear and orientations, while extrusion through simple capillary tubes involves adjustments to the ‘melt flow index’ (term used in the polymer industries) to vary the shear deformation. Surface resistivity of the MWCNT/PC composite has been characterized as a function of the shear rate, which can be controlled by various loads on the melt flow indexer. Reflecting these processing issues for MWCNT-based nanocomposite, the correlation between the quality of MWCNT dispersion and the electrical properties of MWCNT/PC nanocomposites was systematically studied from the perspective of shear deformation.
2.1. Materials and composite preparation
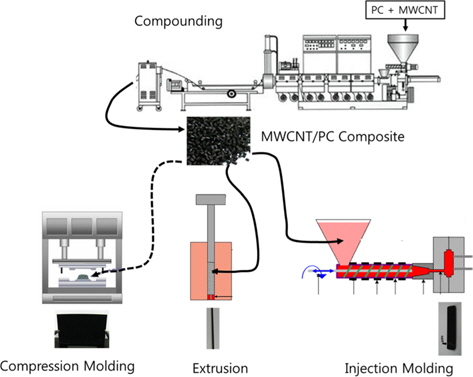
The MWCNTs (Ctube-100, diameter: 10-50 nm, length: 1-25 μm, purity: 95%; CNT Co., Ltd., Korea) used in this study were produced by thermal chemical vapor deposition and used directly without any treatment. Some amount of MWCNT was mixed with PC (L-1250L, Mw: 25 000; Teijin Chemicals Ltd., Taiwan) using a twin-screw extruder (TEX44αII, L/D = 45.5; Japan Steel Works Ltd., Japan), with three mixing zones, to increase the degree of dispersion and distribution of MWCNT. All composites were manufactured under the same processing conditions. The barrel temperature was 280°C and screw speed was 300 r/min. Three types of samples were prepared using a sequence of compression molding, extrusion, and injection molding to investigate electrical properties at different shear rates. The composite pellets obtained were compression molded into 80 × 40 × 1 mm specimens using a hot press for 2 min at 270°C at 138 MPa. The MWCNT/PC nanocomposites were dried in an air-circulating oven at 110°C for 24 h. Dried samples were then injection-molded into rectangular plates (152 × 152 × 3.2 mm) in a Gold-Star injection molding machine. The injection flow rate, injection melt temperature, and mold temperature were 123 cm3/s, 280°C, and 80°C, respectively. A schematic diagram for the whole process, including the preparation of the MWCNT/PC composite, compression molding, extrusion, and injection molding is provided in Fig. 1.
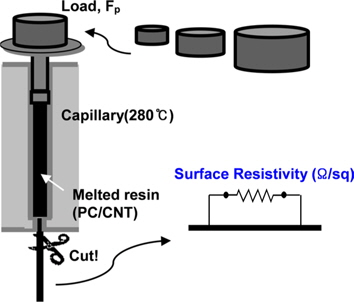
The melt extrusion experiments were carried out to investigate the effects of MWCNT orientation on the electrical conductivity of CNT/PC nanocomposites (Fig. 2). Melt rheological properties of MWCNT/PC nanocomposites were obtained using a melt flow indexer (C-505902, Toyoseiki Co., Ltd., Japan). The MWCNT/PC nanocomposite was drawn into the capillaries and then heated at 280°C for 3 min to achieve a molten state. The melt was extruded through the die (diameter: 2.0 mm, length: 8 mm) with load change from 1.2 to 6.7 kgf. In this system, shear stress and rate can be determined by


where

where ρ
The extruded strand samples were obtained to evaluate surface resistivity in relation to different MWCNT content and shear rates. Compression molded samples (minimal shear rate) were fabricated as an experimental control.
2.3. Surface resistivity measurements
The surface resistivity was measured for extruded-strand, compression-molded, and injection-molded samples using a resistivity meter (SRM-110, Wolfgang Warmbier Ltd., Germany). Because surface resistivity is very sensitive to temperature and humidity, all measurements were conducted at 23°C and 50% RH, according to ASTM D257. Samples were cleaned with ethanol prior to measurement.
The measured surface resistivity (
The dispersion and distribution of CNT in the PC matrix were measured by transmission electron microscopy (TEM, JEM-2000EX, JEOL Ltd., Japan) without staining. To investigate the orientation of CNTs resulting from applied shear stress, samples were prepared by cutting extruded strands in parallel with, and perpendicular to, the extruding direction. Measurements were done using scanning electron microscopy (SEM, S-4800, Hitachi Ltd., Japan) images.
3.1. Dispersion of MWCNT in the PC matrix
The MWCNTs form a highly entangled structure due to van der Waals force between them. This makes homogeneous dispersion the key technology for achieving electrical percolation at low MWCNT content. In order to disperse MWCNT in the polymeric matrix, high mixing energy was required. The extrusion conditions for making MWCNT/PC nanocomposites are given in Table 1. For continuous extrusion, the specific mechanical energy (SME) is generally used to indicate the amount of energy introduced into a unit mass of the material, rather than the simple screw speed. This is because the SME is the combination of the screw speed, the power for driving screw, and the throughput. For continuous extrusion [21] the SME is defined by

[Table. 1.] Extrusion conditions for preparation of MWCNT/PC nanocomposites in this study
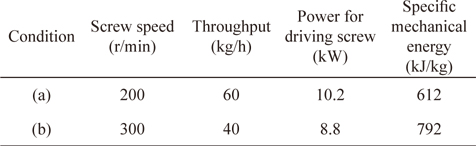
Extrusion conditions for preparation of MWCNT/PC nanocomposites in this study
where τ denotes the torque necessary for driving the screw, N is the screw speed and is the throughput. It is generally known that high SME increases dispersion as higher shear stresses are generated.
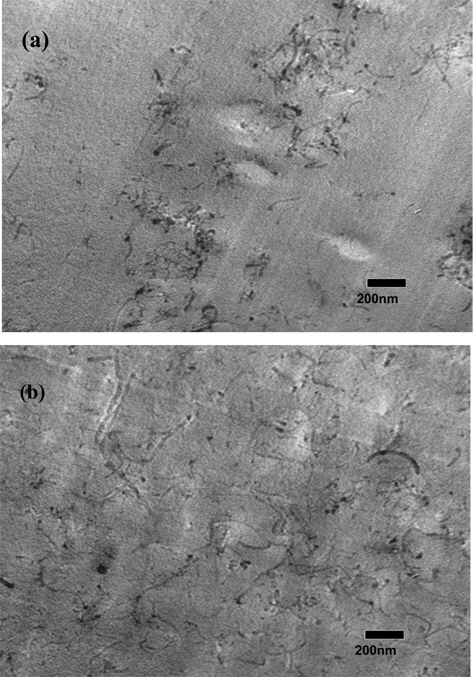
The dispersion quality of the MWCNT in the nanocomposite was examined using TEM (Fig. 3). The TEM image for low-SME melt mixing presented in Fig. 3a clearly shows inhomogeneous distribution of the MWCNTs. In contrast, Fig. 3b shows that the dispersion of MWCNT in the PC matrix was almost homogeneous by high-SME melt mixing. McClory et al. [24] reported that the dispersion was best at 100 r/min, whereas lower dispersion qualities at 20 and 70 r/min led to comparable electrical percolation thresholds for 1-3 wt% of added MWCNT in polystyrene. In this study, it was observed via TEM morphology analysis, that 200 rpm is not enough to provide good dispersion. Moreover, Alig et al. [21] reported that there was a strong relationship between SME and dispersion quality, where the SME for the best dispersion of PC-based composite with 3 poswt% MWCNT, should be more than 1500 kJ/kg. When we compared direct-mixing samples from low mixing energy (612 kJ/kg) and high mixing energy (792 kJ/kg), the higher SME better improved the dispersion quality of MWCNT in PC. There were indications of tube shortening during melt mixing, as conductivity decreased under severe mixing conditions [25,26]. Shortening of CNTs is expected to occur mainly due to structural breakdown or damage of the CNT walls when the shear force exceeds the CNT strength. In our study, there was no evidence of shortening of CNTs, even under high-SME conditions.
3.2. Electrical properties of MWCNT/PC nanocomposites
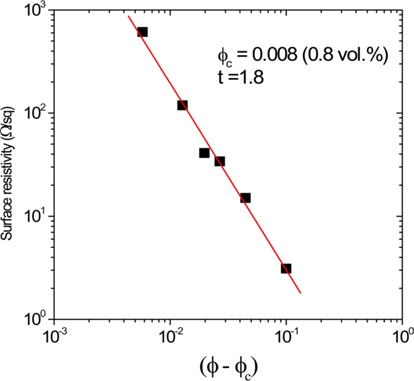
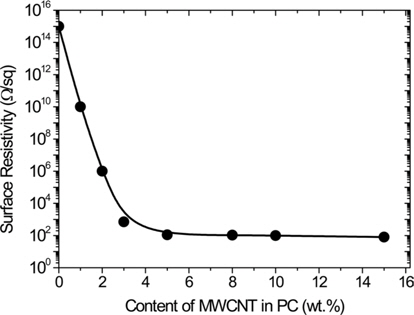
The weight fraction for making electrically conductive composite was less than 2 wt% nanotube content in our experiments with compression molding samples, as shown in Fig. 4. The MWCNT/PC nanocomposite attained the target electrical conductive range above 2 wt% nanotube content.
According to the classical percolation theory, the electrical resistivity of a percolated cluster forming a fiber network, obeys a power law given by

where ϕ is the volume fraction of the filler, ϕ
For successful application of the CNT/polymer nanocomposites in industry, it is very important that they be able to maintain their electrical properties during processing conditions such as sheet extrusion and injection molding. In general, polymeric parts and components are fabricated by injection molding with high shear force. Formations of fiber-type materials, such as glass fiber, carbon fiber, and steel fiber, are influenced by shear-induced orientation during the processing. Many studies have shown that fibers were aligned in the shear direction, especially in the case of part surfaces, because of high shear rates [32,33]. It can be assumed that MWCNTs are also affected by shear force induced in injection molding. The very high aspect ratio of MWCNTs may enable them to be aligned with one axis of the MWCNT/PC nanocomposite. If adverse orientation of MWCNTs occurs, the number of connections between nanotubes is reduced significantly, resulting in reduction of the electrical conductivity of the MWCNT/ polymer nanocomposites.
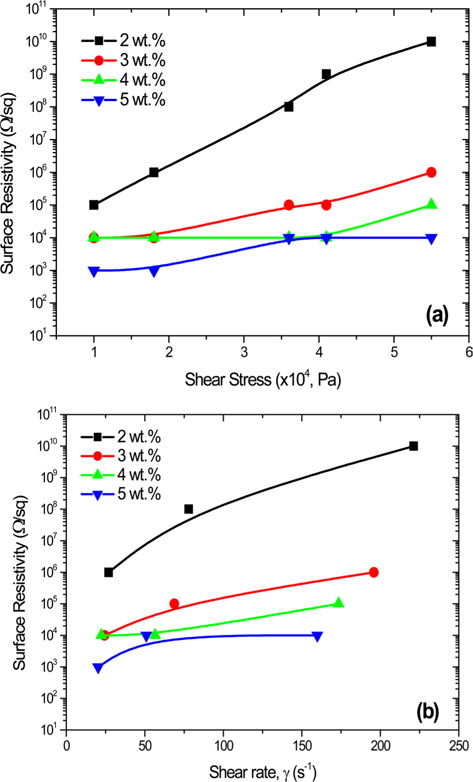
Therefore, we investigated the orientation of MWCNTs in the PC matrix at various shear rates, by measuring the surface resistivity of extruded strand samples using the melt flow indexer. Fig. 6 shows the surface resistivity of the MWCNT/PC nanocomposites as functions of shear stress and shear rate, in relation to various nanotube content. Shear stress and shear rate (controlled by applying different weights that press the molten MWCNT/PC nanocomposite with different forces) may be estimated using Eqs. (1) and (2), respectively. To determine the shear rates in Fig. 6b, MIs with different weights were carefully measured.
At a fixed MWCNT content, the larger shear rate induced, the more surface-resistivity increased. With decreasing MWCNT content, this trend was gradually emphasized within the range of our experimental shear rate. The orientation of the nanotubes within the PC matrix, occur in an orderly sequence, but they hardly come into contact when the percolating threshold is approximated. This may be why higher CNT content is required for percolation. At higher nanotube content, the influence of shear rate on the electrical properties of MWCNT/PC nanocomposites becomes less important. The surface resistivity of a 5 wt% MWCNT sample proved to be relatively similar (around 103 Ω/sq) to the resistivity resulting from the compression molding method. These results suggest that the number of connections between MWCNTs is sufficiently large, that small changes in dispersion do not show significant effect.
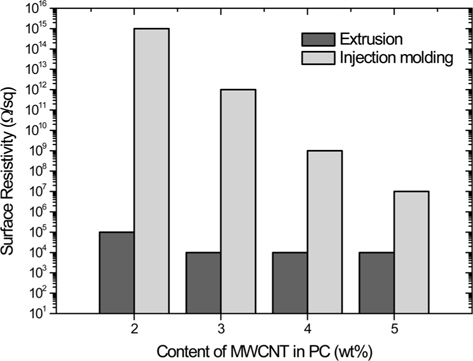
Compared with compression molding samples, the surface resistivity of MWCNT/PC nanocomposites were higher, even at low shear rates (20-30 s-1). This means that MWCNTs in the PC matrix could be largely influenced by the shear rate induced during industrial processing (e.g., extrusion molding, injection molding). We also conducted lab-scale injection molding to investigate the influence of shear rate (>103 s-1) on surface resistivity of MWCNT/PC nanocomposites. As shown in Fig. 7, the surface resistivity of the injection-molded sample was much higher than that of the extruded sample because of adverse orientation caused by the much higher shear rate. For melt extrusion of MWCNT/PC nanocomposites, the surface resistivity was almost same (within 10 decades) over a range of MWCNT content, but after injection molding, surface resistivity increased significantly. This result suggests that a thermodynamically stable, cohesive, nanotube-network structure cannot be achieved within the time scale of the injection molding process.
We assumed that the decreased electrical conductivity of MWCNT/PC nanocomposites occurred due to adverse orientation of MWCNTs in the PC matrix, caused by induced shear force. The fibers suspended in highly elastic fluids tend to align in the flow direction under strong shear. The higher the shear rate, the more the electrical conductivity of the MWCNT/PC nanocomposite was reduced.
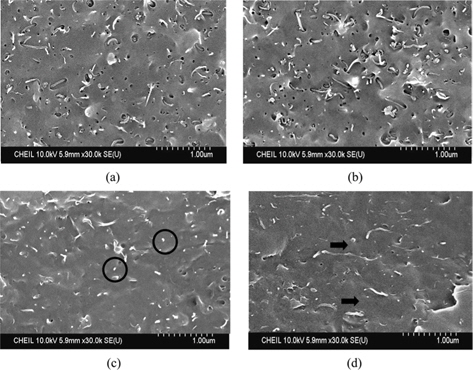
The orientation of MWCNTs in the PC matrix was examined using SEM. Fig. 8 shows SEM images of PC nanocomposites with 3 wt% nanotube content after compression molding, and a sample after extrusion at the shear rate of 200 s-1. Samples were prepared by using the melt flow indexer to cut extruded strands perpendicular to and in parallel with, the extruding direction.
For samples subjected to minimal shear rate due to preparation by compression molding, the orientation of the MWCNTs in the PC matrix was similar for both compression and compression- normal directions as shown in Fig. 8a and b. In the case of compression molding, the tubes were randomly oriented, but overlapping to provide a well-established conductive network. However, at high shear rates, the morphologies of MWCNTs were very different for samples perpendicular to, or parallel with, the direction of the flow axis.
In Fig. 8c, there are many circular segments (indicated by circles) but fewer tube-shaped segments. In the parallel direction, long tube-shaped segments (indicated by arrows) clearly indicate the extruding direction (Fig. 8d). In this case, the adverse alignment of nanotubes reduces the number of the connections between nanotubes, so that the electrical resistivity of the MWCNT/PC nanocomposite increased. Because MWCNT has an entangled structure within the PC matrix, the adverse orientation was less than for other fiber-type materials (e.g., carbon and glass). However, the adverse orientation of MWCNTs could be induced by shear force, as indicated by the results of our study.
Electrical conductivity can be reduced by shear-induced adverse orientation of nanotubes in processing of MWCNT/PC nanocomposites. Therefore, these technical problems must be resolved if MWCNT/PC nanocomposites are to be successfully applied. Here, the correlation between CNT dispersion and the electrical properties of CNT/PC nanocomposites was systematically studied from a rheology perspective.
The focus of this study was an investigation of the relationship between the electrical properties of a MWCNT/PC nanocomposite and the shear force induced by processing. The percolation threshold for electrical conductivity after compression molding (0.8% by volume), was determined using a power law relation. MWCNTs should be oriented in the direction of flow by the shear force. The adverse alignment of nanotubes reduces the percolation structure of the MWCNT with increasing shear stress and/or shear rate. The weight fraction of nanotubes required for percolation increases with growing adverse alignment of the nanotubes. To ensure consistency in the electrical properties of MWCNT/polymer nanocomposites for application in electronic devices and components, homogeneous dispersion (random orientation) should be possible at any shear rate. If this is achieved, MWCNT polymers may assume wider use as alternatives to other conductive materials with CNT.