Multisine signals are widely used in the development and analysis of advanced communication systems because the transmission channel can be accurately identified with the magnitude and phase information of each tone. There have been efforts to replace the modulated signal used in the field with more generic signals because of the cost of equipment and the comparability of the test results. Of the options, multisine signals are the most widely used because of their mathematical clarity, ease of design, and versatility in identifying behavioral models of nonlinear systems [1,2].
Many design methods have been introduced thus far, mostly based on the discrete Fourier transform (DFT) and the iterative sorting of samples [3,4]. The brief algorithm of the most common iterative method is as follows [4]:
Although this iterative sorting method (hereafter the iterative method) accounts for the time-domain distribution of the signal, it is mainly concerned with the probability distribution of the amplitude; thus, the method does not guarantee the best overall resemblance to the original target signal. In this regard, the authors suggested designing a multisine for the best time-domain resemblance [5]. However, as the number of tones of the multisine decreases, the error in the time domain accumulates onto the existing tones of the multisine, resulting in a significant discrepancy in the frequency domain. In this paper, we therefore suggest a hybrid process to determine the best set of multisine coefficients of sparse multisine tones, in which the magnitude is determined in the frequency domain and the phase is optimized in the time domain. The method of determining the optimal phase of each multisine was mathematically proven rather than by using the numerical method. In Section II, the extraction of the multisine magnitude is discussed. In Section III, the mathematical optimization for the phase is discussed, based on the Wiener-Hopf theory. In Sections IV and V, an experimental comparison between multisines synthesized using the suggested method and the conventional sorting method is discussed, and finally, the conclusion is presented in Section VI.
II. MAGNITUDE DETERMINATION OF MULTISINE SIGNALS
A complex multisine signal
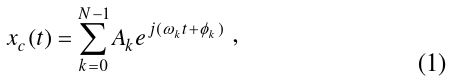
where
The fundamental idea in determining the magnitude of each tone is to set the magnitude based on the spectral shape of the original signal, for which the Fourier transform is suggested. However, the magnitudes of the Fourier coefficients may show severe fluctuations because of the random nature of the original signal. Thus, it is clear that in order to use this multisine for accurate measurement, post-processing to mitigate the fluctuation within the signal bandwidth is necessary. Other than directly applying the DFT coefficient, the alternative method of using a constant magnitude and leveling off the coefficient to make its power equal to that of the target signal has been suggested [4,6]. However, this method fails to emulate target signals such as 802.11b or Bluetooth, of which the spectral density is not constant within its channel bandwidth.
In this paper, the signal bandwidth is divided into spectral bins, in which the magnitude of the multisine has a constant value so that its integrated power meets the average power of the target signal within the bin. With this method, the accumulated spectral error can be spread over the bins of the sparsely defined multisine frequency, and thus the synthesized multisine can follow the spectral shape of the original modulated signal.
The magnitude of the

where
Thus, the

III. PHASE DETERMINATION OF MULTISINE SIGNALS
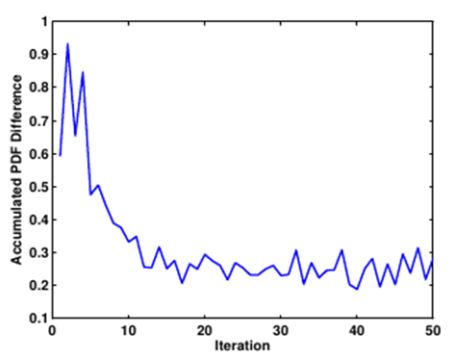
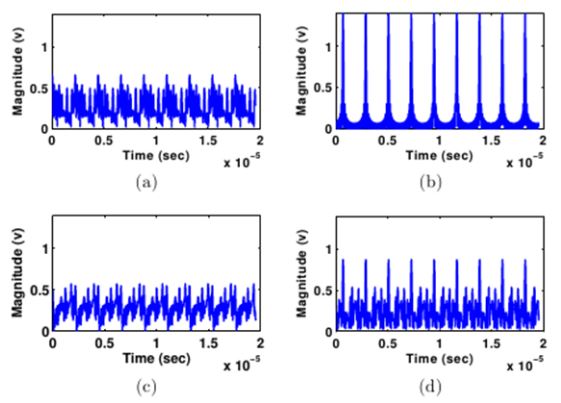
In terms of the phase of multisines, very few general methods are widely used because the distribution of the phase significantly affects the characteristics of the multisine. Therefore, the phase should be designed in consideration of its application. In the linearity measurement of nonlinear devices, signal properties such as sample-to-sample correlation, probability distribution, and the spectral response all affect the measurement result. Fig. 1 shows the variation of
Therefore, the mathematical optimization of
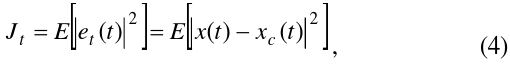
Because the synthesized multisine should resemble the target signal that is statistically random in most cases, the cost function

where
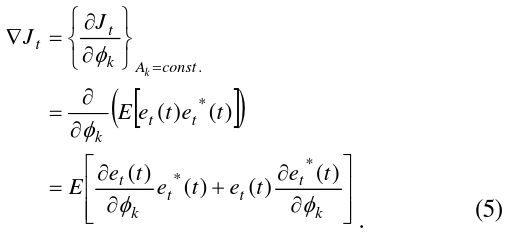
Thus, the goal of the optimization is to minimize the cost function with

In this equation,

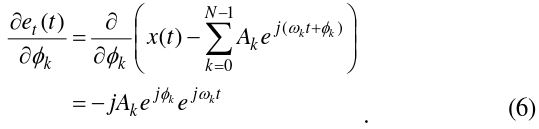
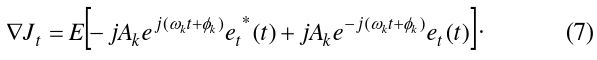
Therefore, Eq. (5) is rewritten using the magnitude and phase of the tone.

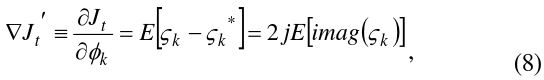
The gradient of the cost function is redefined so that Eq. (7) has a real value:

where
In order to obtain the minimal

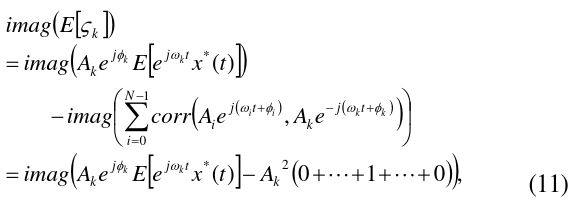
Eq. (9) is expanded by the statistical properties:
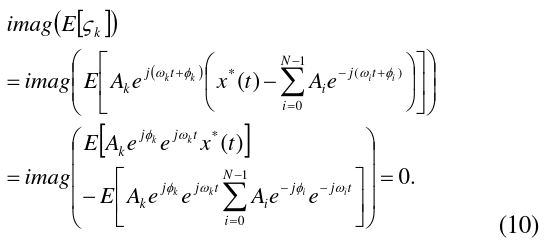
Eq. (10) has the sum of the cross-correlation between the

where
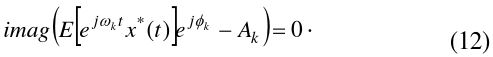
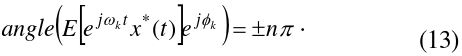
Thus, the condition for the minimum error is found by Eq. (11), and its solution is equivalent to that of the following equation:

Because

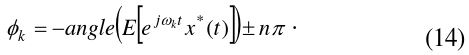
Therefore, the optimal

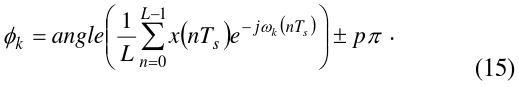
As a result, it is found that when

where
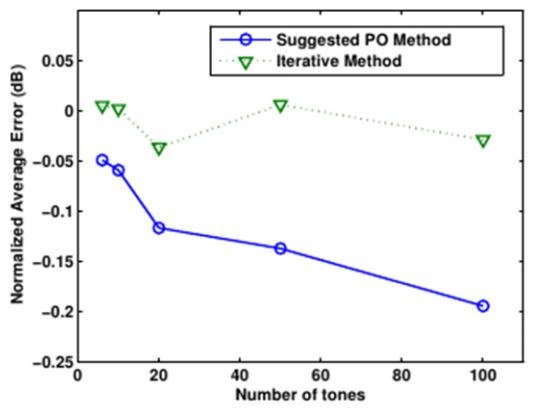
In addition, in order to measure the preciseness of the designed multisine, a normalized average error is defined as a figure of merit, as follows:

where
IV. SIMULATION AND EXPERIMENTAL VALIDATION
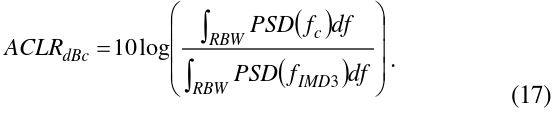
In this section, multisine signals from different methods are synthesized to emulate the Long-Term Evolution (LTE) downlink signal of 10-MHz bandwidth and are compared using the linearity test on a commercial amplifier at 1.9 GHz. The target LTE signal has a peak-to-average power ratio (PAPR) of 10.5 dB, a sample length of 520,000, and a sampling frequency of 128.8 Msps. The linearity of the amplifier was evaluated by the adjacent-channel leakage ratio (ACLR) at an offset of 8.6 MHz from the center frequency, where the third-order intermodulation (IMD3) dominates. The first multisine was synthesized using the conventional iterative method with various numbers of tones. The suggested method with the phase-optimized (PO) multisine was synthesized by the aforementioned nonlinear phase optimization, with the same
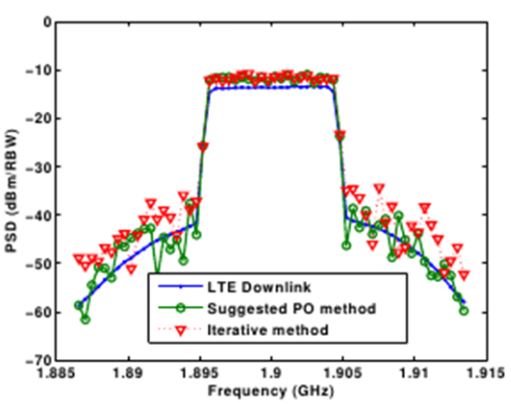
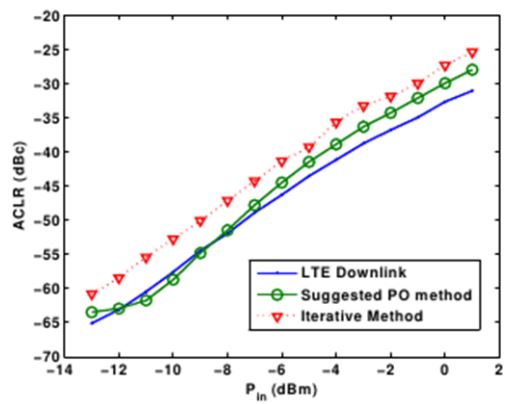
Finally, the designed multisines are used for the linearity testing of a commercial PA and are compared by the accuracy of the ACLR estimation. Fig. 5 shows the spectral responses of the original signal and the multisines of
From the figure, a remarkable accuracy in the ACLR is observed with the PO multisine over a wide range of input power, whereas the iterative multisine showed relatively inaccurate ACLR results.
As seen in the measurement results, due to the optimized time-domain correlation, it is shown that the suggested PO multisine can estimate ACLR results more accurately than the conventional iterative method.
In this paper, we have suggested a multisine design method that is based on time- and frequency-domain signal processing in which the phase is calculated from the time-domain optimization and the magnitude is determined by the frequencydomain spectral responses. Based on the time-domain optimization, the condition for the optimal phase of each tone is determined so that the multisine can accurately estimate the ACLR. In addition, the magnitude of the multisine is found to follow the spectral characteristic of the original signal. To verify the performance of the suggested method, the method used to synthesize the 10 MHz LTE downlink signal was compared with the conventional iterative method by using the ACLR test results using a commercial amplifier at 1.9 GHz. The measurement results showed that the multisine from the suggested method achieved a lower normalized error by 0.163 dB when