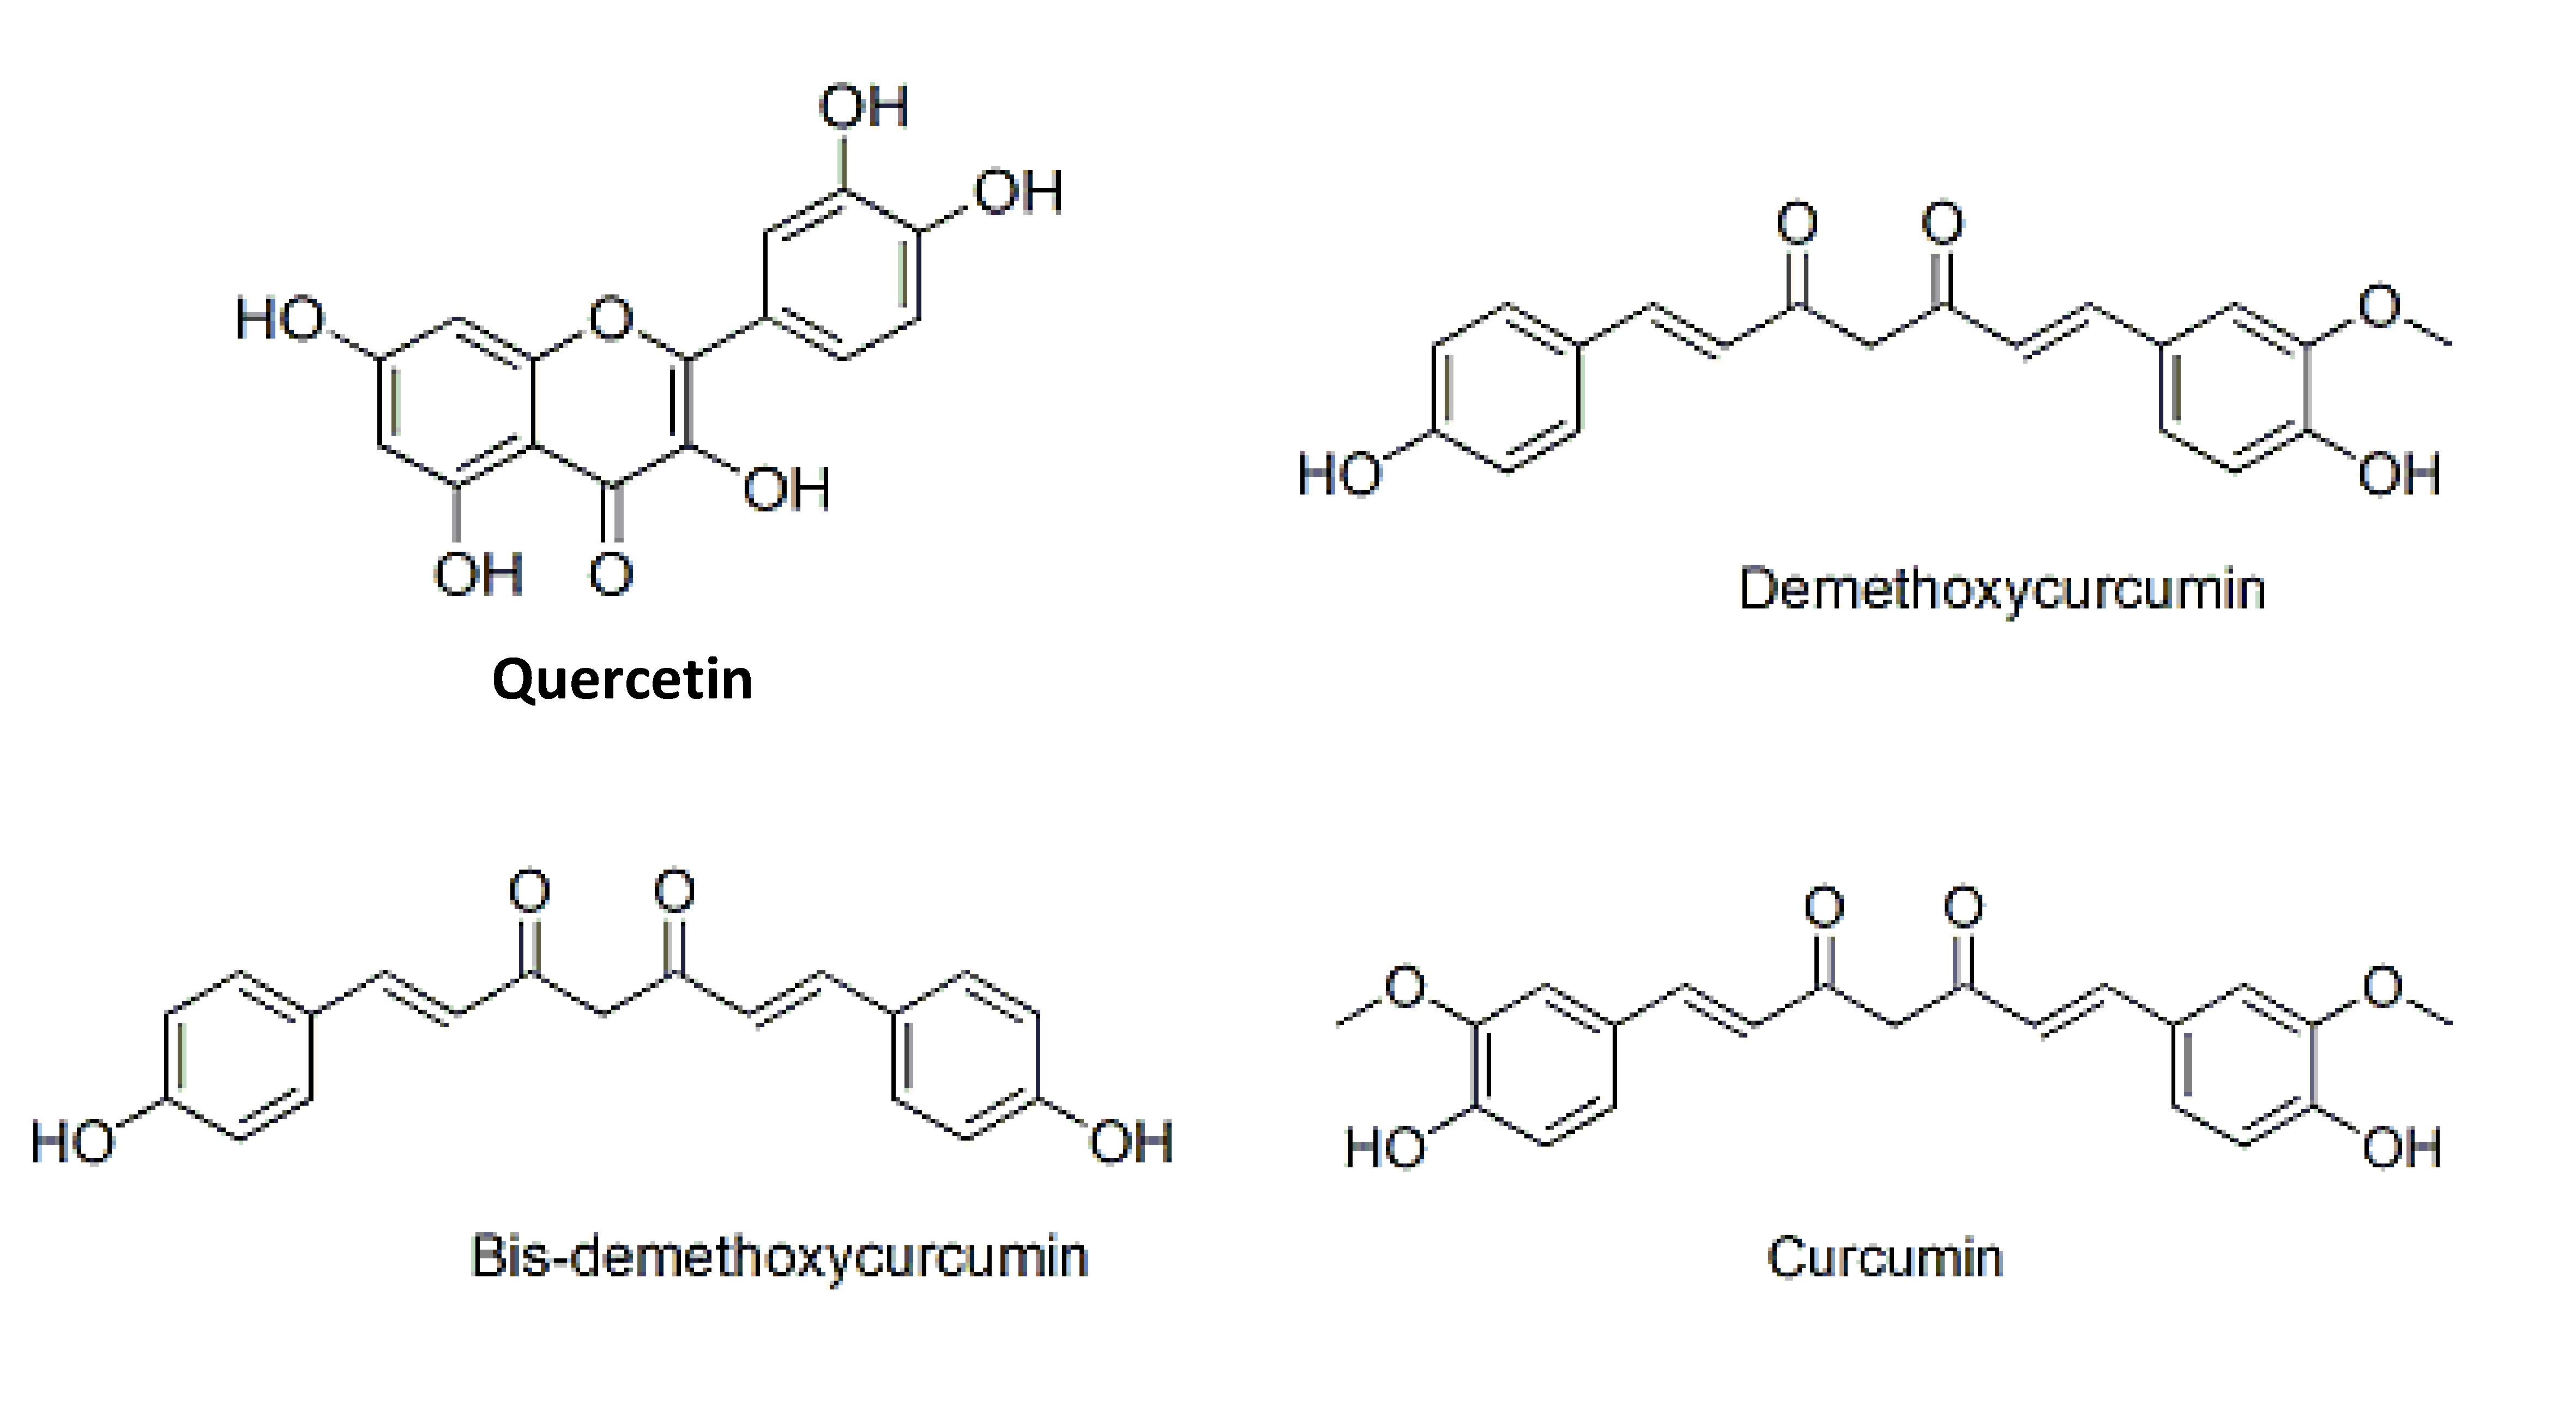
Quercetin is a category in the class of flavonoids, and a sub class of flavonol. Flavonoids are plant polyphenolics found as pigments in fruits, vegetables, seeds, nuts, flowers, barks and leaves. It is also found in medicinal botanicals, such as Ginkgo biloba, Hypericum perforatum (St. John’s Wort), and Sambucum canadensis (El-der) [1]. The International Union of Pure and Applied Chemistry’s (IUPAC’s) name for quercetin is 3, 3’, 4’, 5, 7-pentahydroxyflavone (or its synonym 3, 3’, 4’, 5, 7-pentahydroxy-2-phenylchromen-4-one). Fig.1 shows the chemical structure of quercetin. The hydroxyl (-OH) groups attached at positions 3, 5, 7, 3’, and 4’ and the catechol B-ring produce the antioxidant properties of quercetin [2, 3]. The antioxidant and the free radical scavenging properties of quercetin have been reported to contribute to anti carcinogenic and anti inflammatory effects, and haves been extensively studied by researchers around the world [2].
Extensive amounts of
Curcumin, commercially available in a mixture of curcumins (curcuminoids), contains ─ 77% pure curcumin, ─ 17% demethoxycurcumin and ─ 3% bisdemethoxycurcumin [10] (Fig 1). Curcuminoids are derived from Curcuma longa Linn, one of the most popular medicinal herbs, and are a polyphenolic. These compounds are yellow pigments and have been, commonly used as a dietary spices, natural coloring agents in foods, household medicines and insect repellents in South and Southeast Asia for thousands of years [11]. Curcumin and its synthetic derivatives (curcuminoids) show an array of pharmacological properties, such as antibacterial [12-14], antioxidant [13, 15-16], anti inflammatory [17, 18], anti tumor [19, 20] and anti proliferation [18, 21] properties. Curcumin/curcuminoids also possess potency as medicines for the treatment of diseases, including Alzheimer’s disease [22, 23], cancer [24, 25, 26], diabetes, gastric ulcers [27], malaria [28, 29] and for the treatment of wounds [30-32].
A variety of methods for quantitatively detecting curcumin and quercetin contents have been reported. Among these, spectrophotometric methods are the most commonly used [33-36]. Thin layer chromatography (TLC) or column chromatography was usually used for separation of curcuminoids [37-39]. High performance liquid chromatography (HPLC) [40-45] and, high performance thin layer chromatography (HPTLC) [39, 46, 47] are the commonly used methods for quantitatively detecting the quercetin and curcuminoids contents. Some advanced methods have been developed for the analysis of curcuminoids contents, namely, ultra performance liquid chromatography quadrupole time of flight mass spectrometry (UPLC-qTOF-MS) [48], ultra performance liquid chromatography tandem mass spectrometry (UPLC-MS) [49], high performance liquid chromatography tandem mass spectrometry (HPLC-MS/MS) [50] and electrochemical-HPLC [51].
For the above techniques, spectrophotometric methods are not available to quantify the individual curcuminoids due to the curcumin derivative’s being also absorbed at the same wavelength. Furthermore, LC-MS and/or qTOF are complicated and need expensive instrumentation. Even though HPTLC and TLC are widely used to study the fingerprints of plants, these methods are not suitable for analyzing compounds in combinations of herbs products like Chinese medicinal materials (because such products normally contain more than one herb). For simultaneous determination of quercetin and curcuminoids, HPLC method is the recommended technique because it uses separation, identification and quantification of the analytes from plant extracts, foods, pharmaceutical products, and body fluids.
In the present study, a simple isocratic reversed phase HPLC method was developed according to international conference harmonisation (ICH) guidelines [52] for the simultaneous quantitative detection of quercetin and curcuminoids. The method was also validated by using market available traditional Chinese medicine materials such as granules, pills and tablets.
Curcumin (mixture of curcumin, demethoxycurcumin, and bisdemethoxycurcumin) was obtained from Acros Organics, USA. Quercetin anhydrous was obtained from Sigma, USA. The HPLC grade acetonitrile and methanol were purchased from J.T. Baker, USA. Analytical grade acetic acid was obtained from QRëC, Malaysia. Nylon membrane filters 0.45 μm were purchased from Whatman, England.
HPLC analysis was performed using a Shimadzu-LC system (Shimadzu, Japan) equipped with an CBM-20A controller, LC-20AT pump, DGU-20A5 prominence degasser, SIL-20A auto sampler, SPD-20AV detector and CTO-10ASvp column oven.
Chromatographic separations were achieved using a Thermo Hypersil Gold column (250 mm × 4.6 mm I.D.: 5 μm). A security guard column (Zorbax Eclipse Plus) packed with a replaceable C-18 cartridge (12.5 mm × 4.6 mm ID.: 5 mm) was used to protect the analytical column. A reverse phase HPLC assay was carried out using an isocratic elution with a flow rate of 1.3 mL/minutes, a column temperature of 35°C, a mobile phase of acetonitrile and 2% v/v acetic acid (pH 2.60) (40% : 60% v/v) and a detection wavelength of 370 nm. The injection volume was 20 μL of each solutions. The total run time was 18.5 minutes for each injection. Data were acquired and processed with LC-Solution Software. Solvents and distilled water were prior filtered through a 0.45-μm nylon membrane by using a set of glass bottles with the aid of a vacuum pump (Fisherbrand FB 70155, Fisher Scientific, UK).
Twenty mg of a mixture of curcumin (containing mainly curcumin, demethoxycurcumin and bisdemethoxycurcumin) and 20 mg of quercetin were accurately weighed using a microbalance (Sartorius, MC5, Germany) and dissolved in 20 mL of HPLC grade methanol in a 20 mL volumetric flask. The mixtures were diluted to 320 μg/mL with HPLC grade methanol; and were then serially doubling diluted to 1.22 ng/mL. These solutions were used as calibration standards for the quantitative determinations of the limit of detection (LOD), the limit of quantification (LOQ) and yhe limit of linearity (LOL), and for the linear range analysis. Three quality control (QC) samples at concentrations of 3.75 μg/mL, 100 μg/mL and 160 μg/mL, respectively, were prepared from the stock solution. All solutions were stored in tightened screw cap bottles to avoid evaporation and were protected from light, and were kept in a refrigerator (4°C) for not more than two weeks.
Standard solutions with concentrations in the range from of 1.22 ng/mL to 320 μg/mL were injected in duplicate into the HPLC unit. The LOD and LOQ of quercetin (QUE), bisdemethoxycurcumin (BDMC), demethoxycurcumin (DMC) and curcumin (CUR) were determined in a at the lower concentration range based on the signal to-noise ratio. According to The United Sates Pharmacopeia (USP), the LOD and the LOQ are in terms of 2 or 3 times, and 10 times the noise level respectively. The LOL was determined by plotting a calibration curve (mean value of the peak areas against the concentrations) beginnings with the LOQ concentration and proceeding to the data point that deviated from the regression line. The coefficient of determination (R2 ≥ 0.999) was used as a guideline to evaluate the model fit of a regression equation.
Linear ranges for quercetin, bisdemethoxycurcumin, demethoxycurcumin and curcumin included concentrations of 1.25, 5, 20, 40, 80, 140 and 200 μg/mL. Separate calibration curves were constructed for quercetin, bisdemethoxycurcumin demethoxycurcumin and curcumin by plotting the peak areas against the concentrations, and the methods were evaluated by determining the coefficient of determination (R2). Unknown assay samples were quantified by referencing them to these calibration curves.
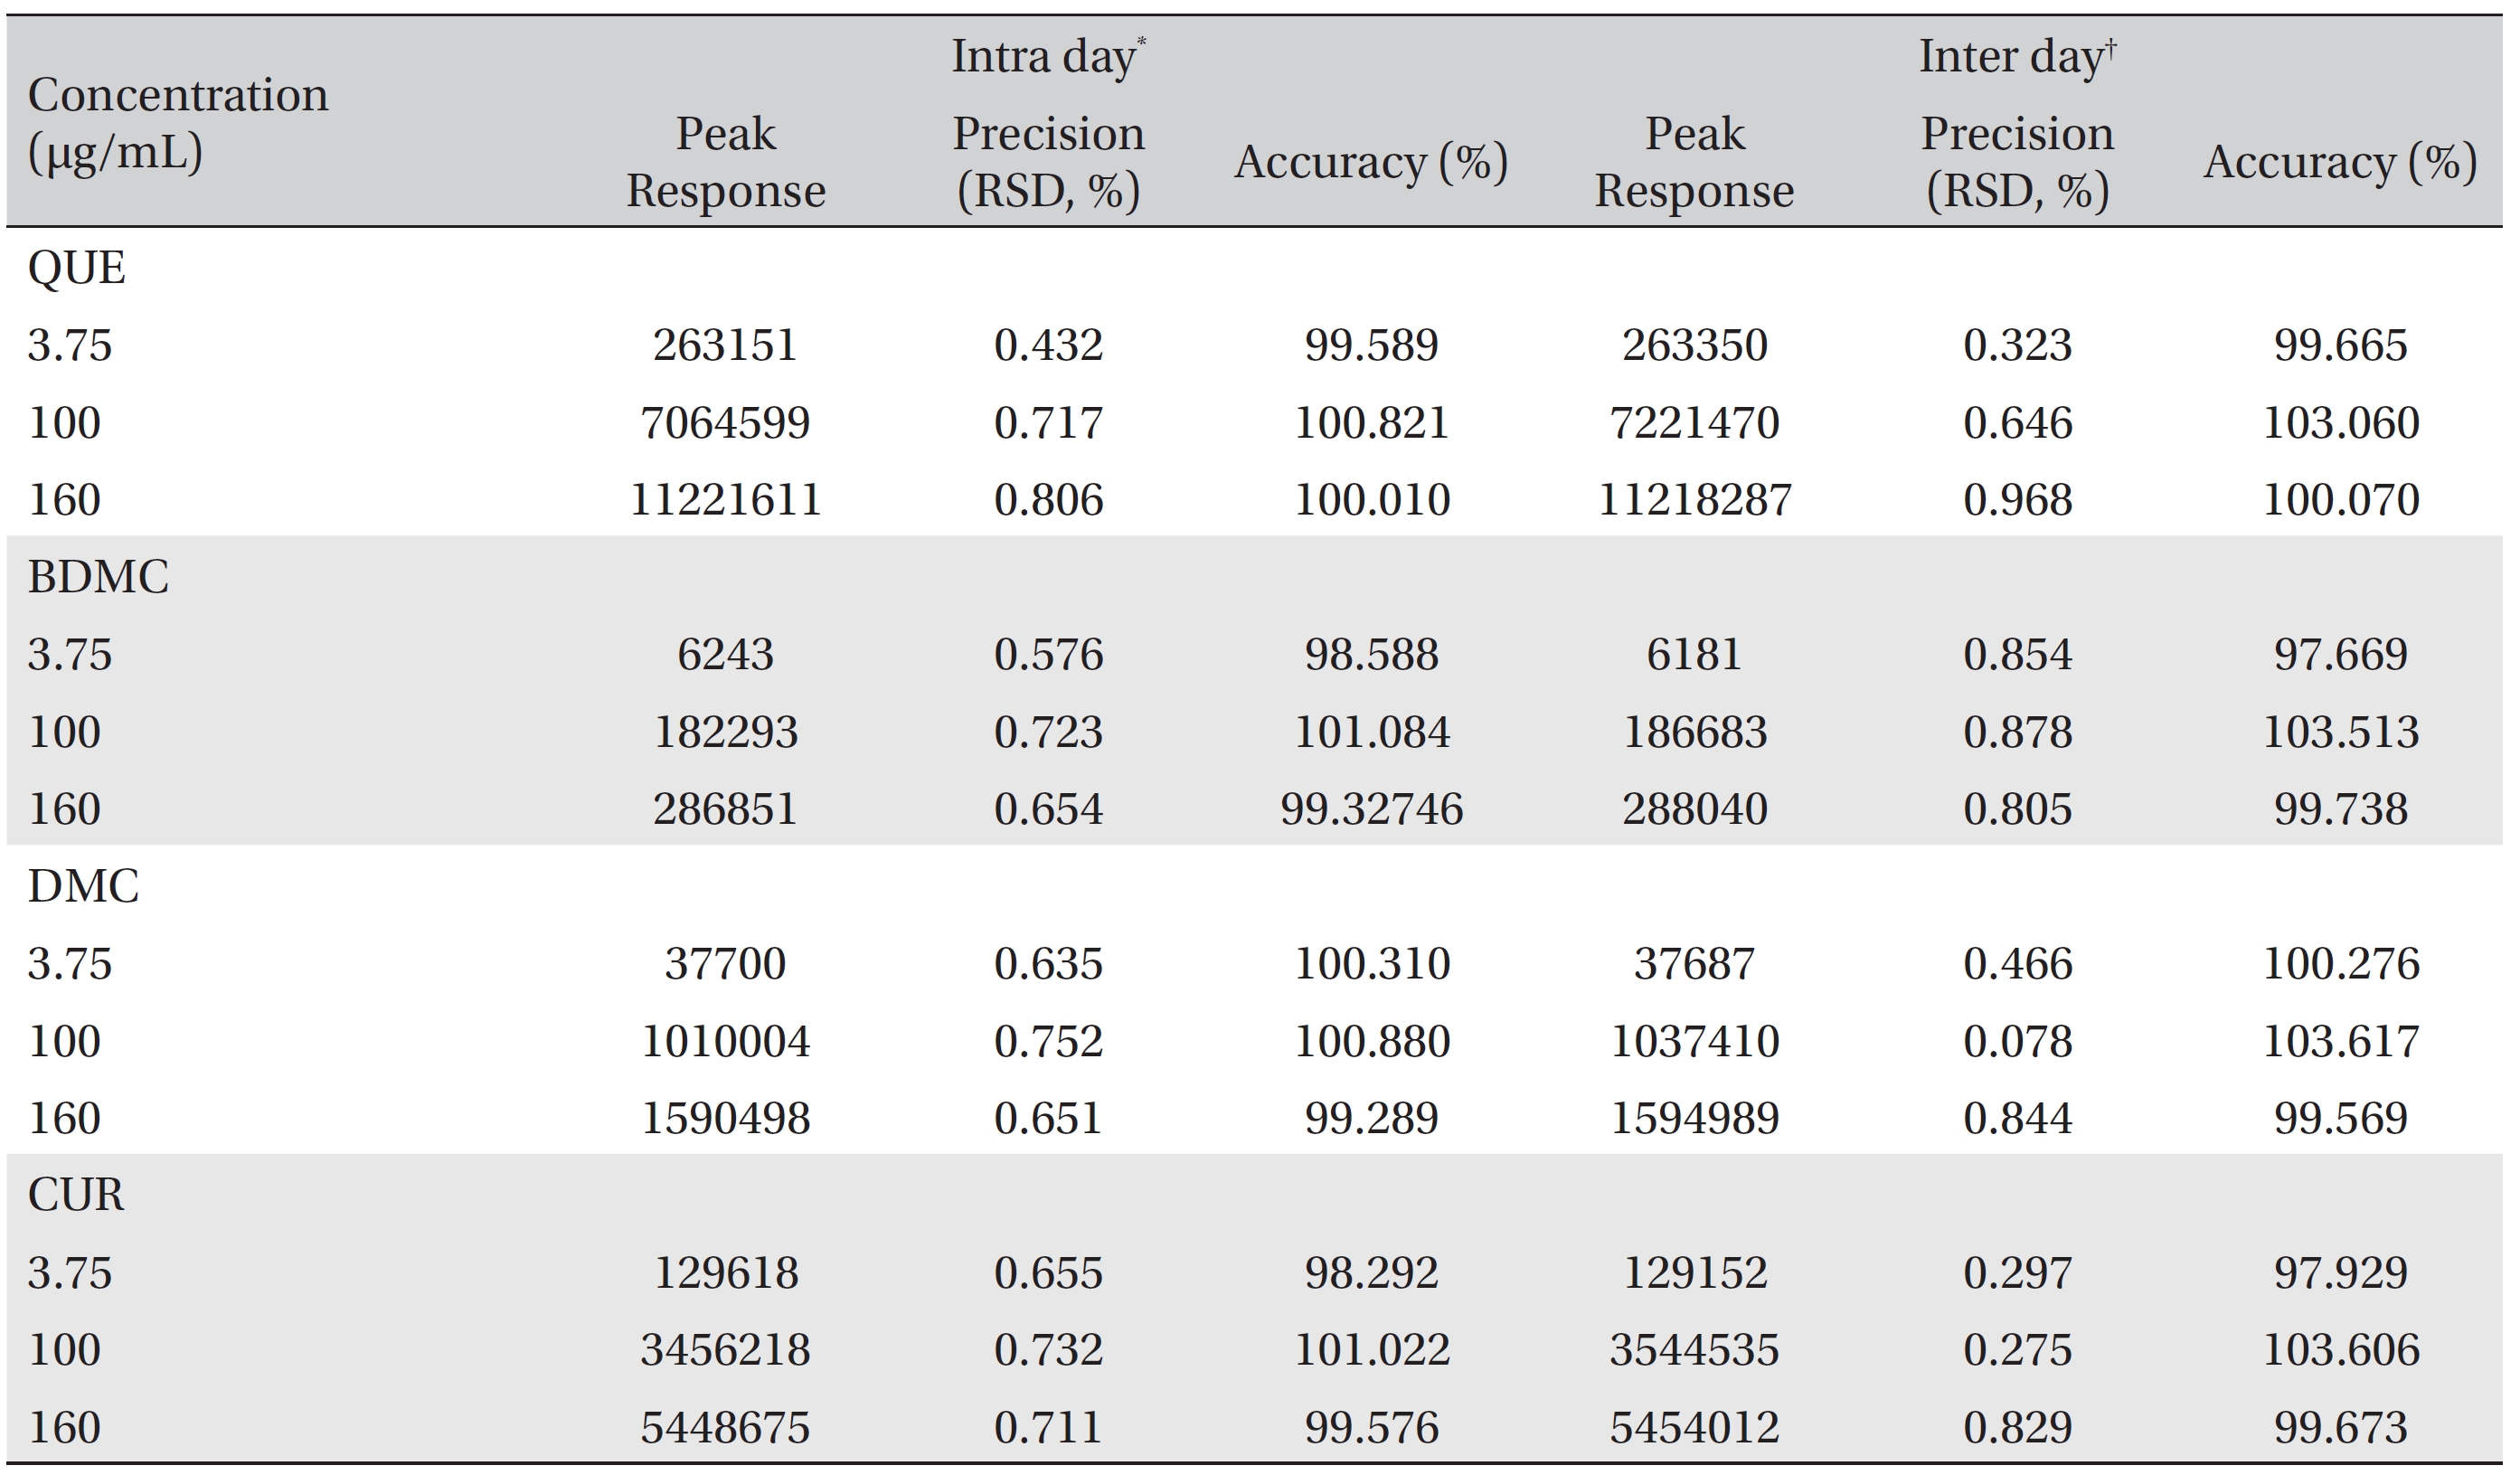
QC samples (3.75, 100 and 160 μg/mL) were used to validate intra day and inter day accuracies and precisions. Intra day precisions and accuracies were determined by using a replicate analysis (n = 6) of the QC samples on the same day under the same analytical conditions. Inter day precisions and accuracies were tested by using a replicate analysis (n = 3) of the same QC samples on six consecutive days. The precision is calculated from the mean of the accuracy and the relative standard deviation (RSD). Accuracy is a measure of how close the experimental value to the true value, and is expressed as a percent. The experimental value was calculated from the calibration curve by using the linear regression equation, y = mx + c. The constant m is the slope of the curve. The constant c is the y intercept and can be determined by extrapolating the straight line to the y axis.
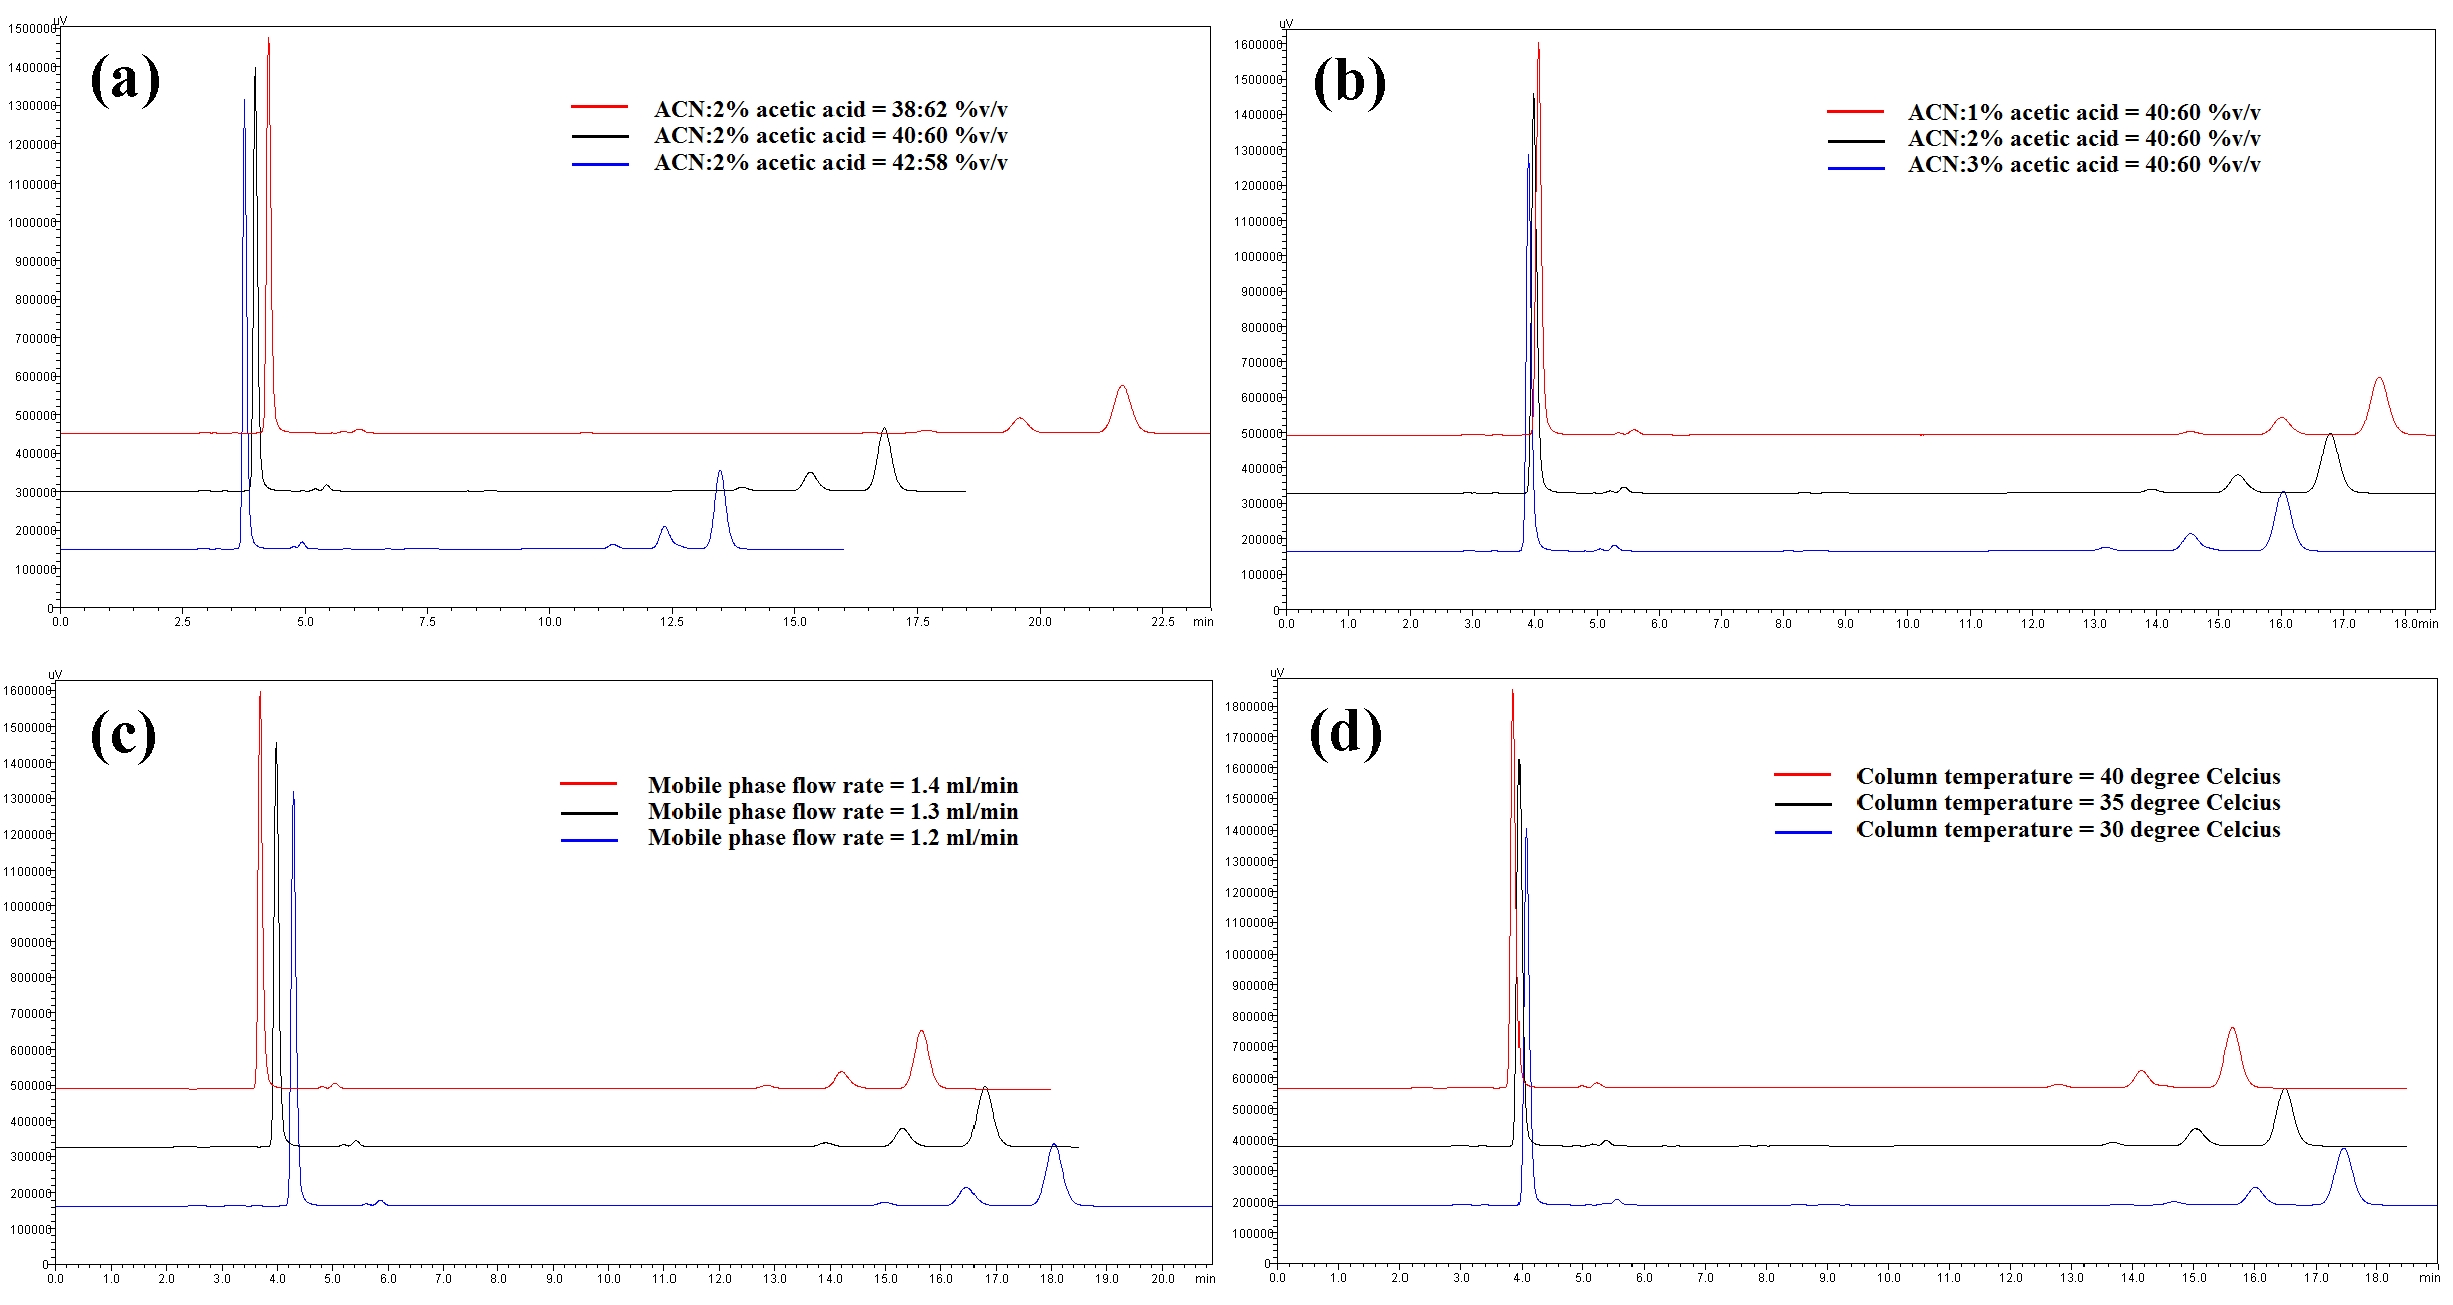
Four variation parameters of robustness were studied: change in organic composition by ± 2.0% (Table 4a) , change in acetic acid concentration by ± 1.0% v/v (effect of buffer pH) (Table 4b), change in the flow rate of ± 0.1 mL/min (Table 4c) and change in the column temperature of ± 5.0°C (Table 4d). The retention time, peak area, resolution, tailing factor, theoretical plate number and capacity factor values obtained from the variation parameters were compared to those obtained for the normal method conditions. The differences were analyzed by using SPSS version 20, and a one way analysis of variance (ANOVA), followed by Tukey’s test. P-values < 0.05 were considered significant.
The system suitability parameters were assessed by using six replicate analysis of the QC sample at 160 μg/mL. The acceptance criteria were in accordance with the guidelines of the Centre for Drug Evaluation and Research [53].
The method developed in this study was used to quantitatively determination the quercetin and the curcuminoid contents of extracts, pills and tablets made from Chinese medicinal plants.
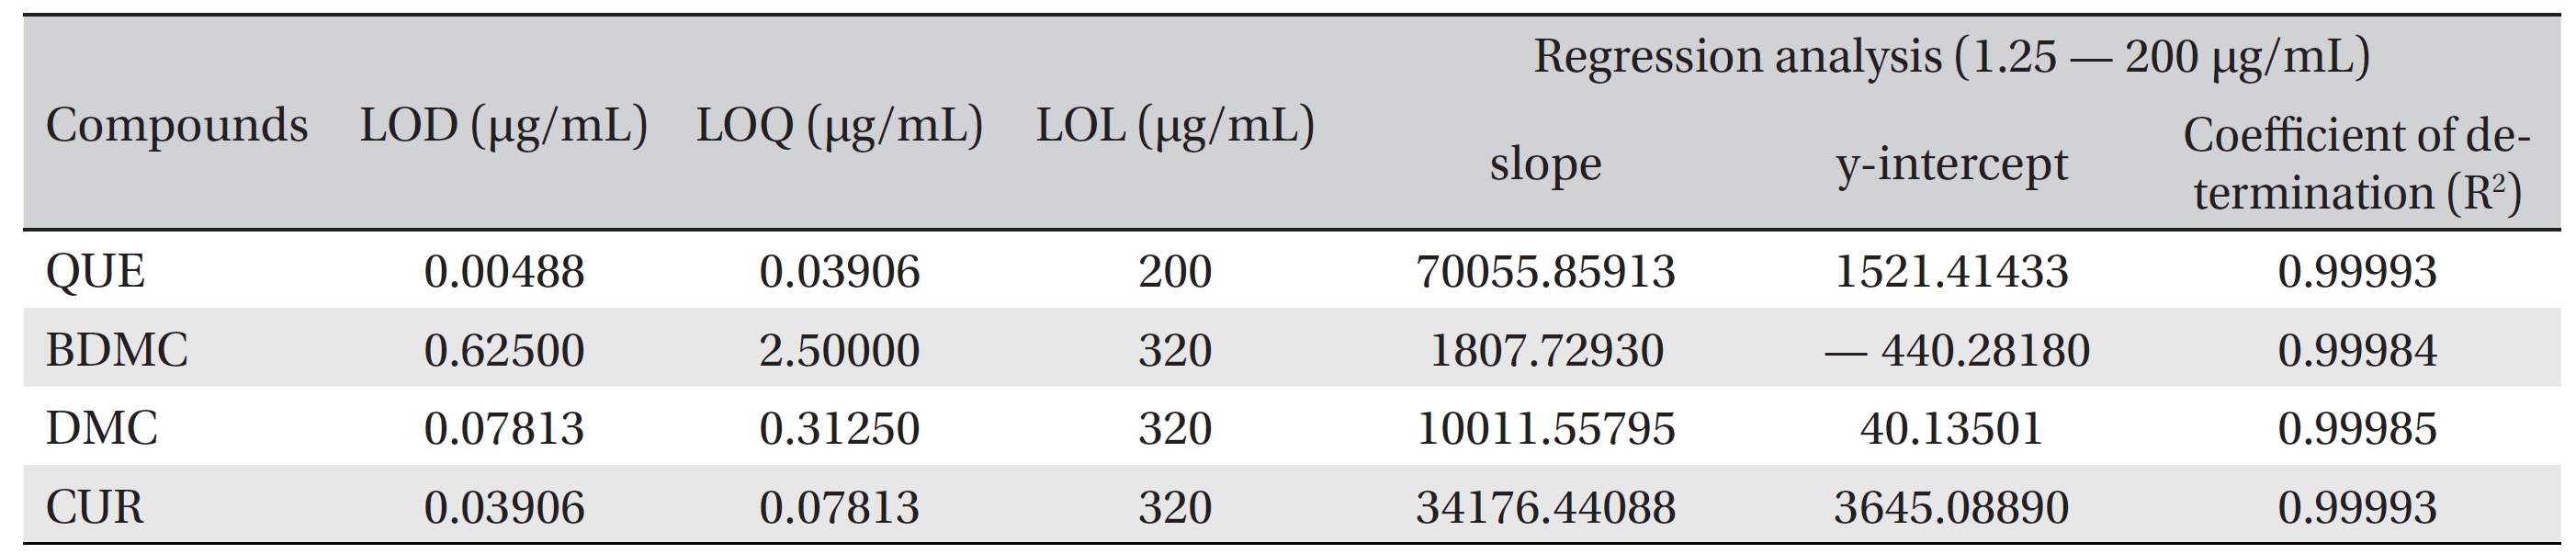
The LOD and the LOQ were determined based on the signal to noise (S/N) ratio, with the S/N > 3 and the S/N > 10 for the LOD and the LOQ, respectively. The LODs of quercetin, bisdemethoxycurcumin, demethoxycurcumin and curcumin were 0.00488, 0.62500, 0.07813 and 0.03906 μg/mL, respectively. The LOQs of quercetin, bisdemethoxycurcumin, demethoxycurcumin and curcumin were 0.03906, 2.5000, 0.31250 and 0.07813 μg/mL, respectively (Table 1) The linearity for detecting quercetin, bisdemethoxycurcumin, demethoxycurcumin and curcumin was tested against a mixture of calibration standards with concentration ranging from 1.22 ng/mL to 320 μg/mL. The LOL of each compound was determined from a separate calibration curve. Quercetin was linear up to 200 μg/mL, while bisdemethoxycurcumin, demethoxycurcumin and curcumin were linear up to 320 μg/mL.
[Table. 1] LOD, LOQ, LOL and linear regression analysis parameters for QUE, BDMC, DMC and CUR

LOD, LOQ, LOL and linear regression analysis parameters for QUE, BDMC, DMC and CUR
Linear calibration curves in the range from 1.25 to 200 μg/ mL were constructed for each compound by plotting the peak area against the concentration. The retention times and the peak areas are tabulated in (Table 2) The values of R2, the y-intercept and the slope for each compound’s calibration plot are shown in (Table 1) A regression analysis of the data showed a linear relationship for quercetin, bisdemethoxycurcumin, demethoxycurcumin and curcumin, with excellent R2 values of 0.99993, 0.99984, 0.99985 and 0.99993 μg/mL, respectively.
[Table. 2] Retention times and responses data for calibration standards of QUE, BDMC, DMC, and CUR
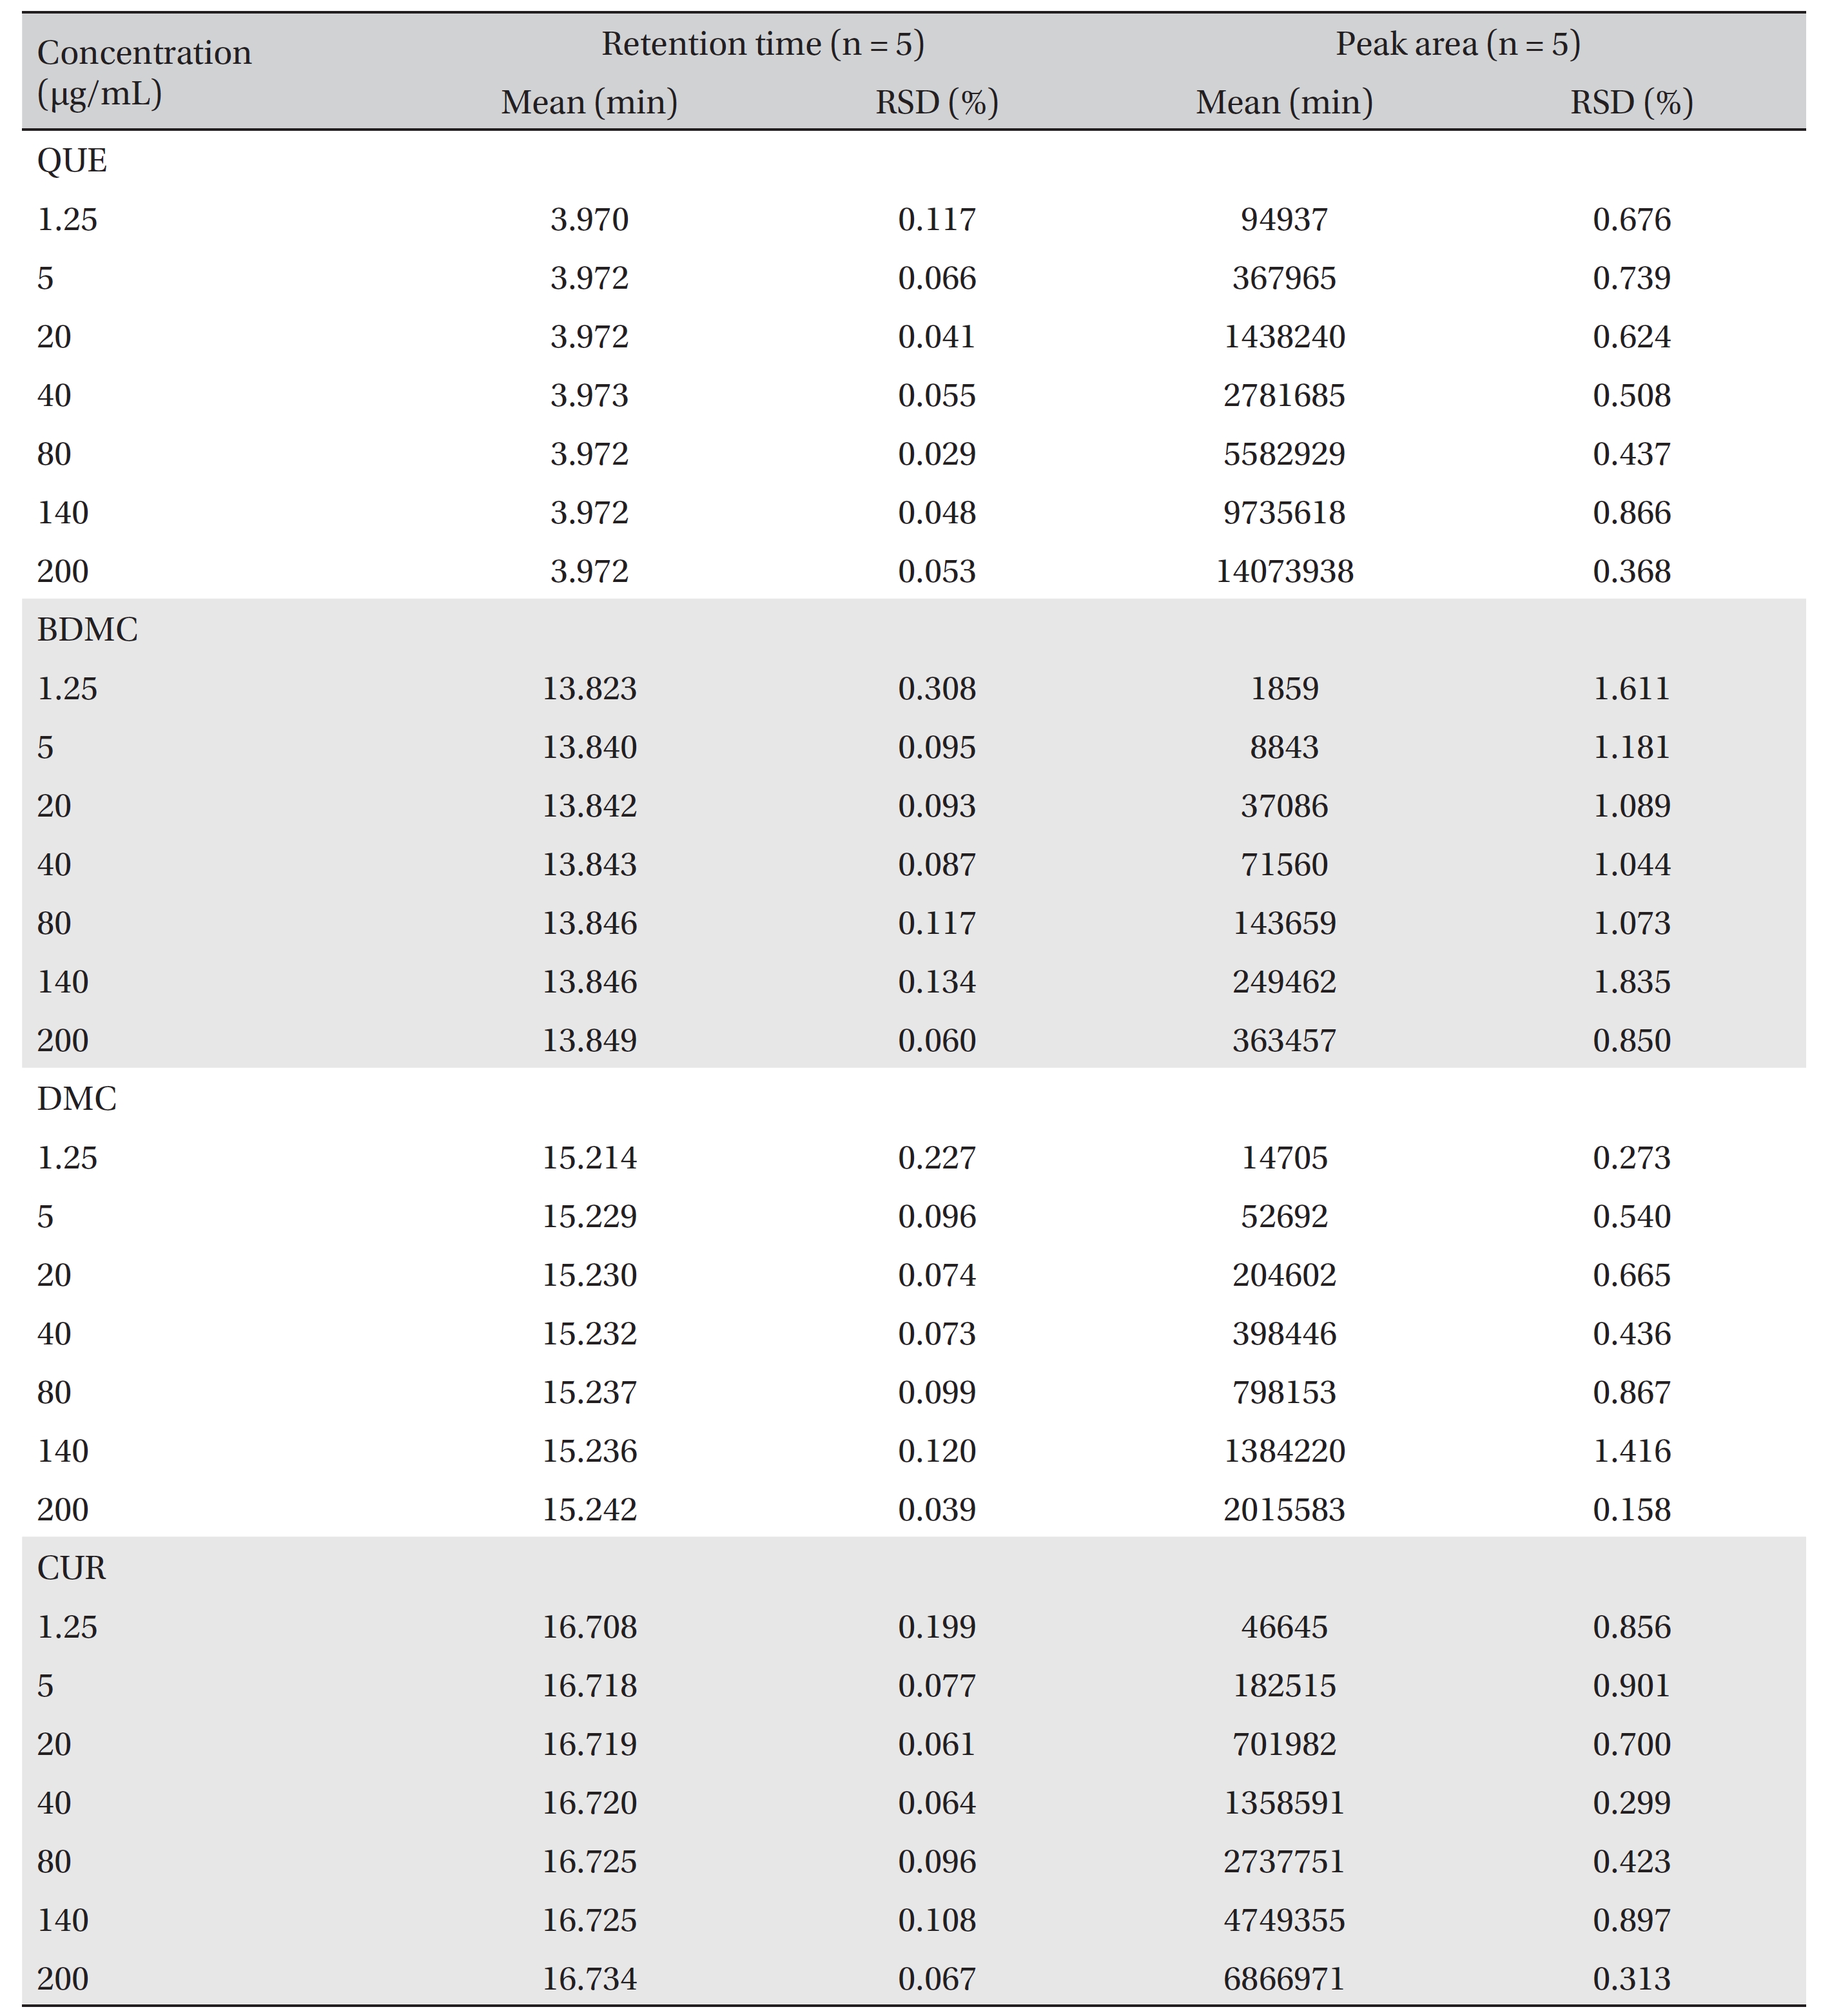
Retention times and responses data for calibration standards of QUE, BDMC, DMC, and CUR
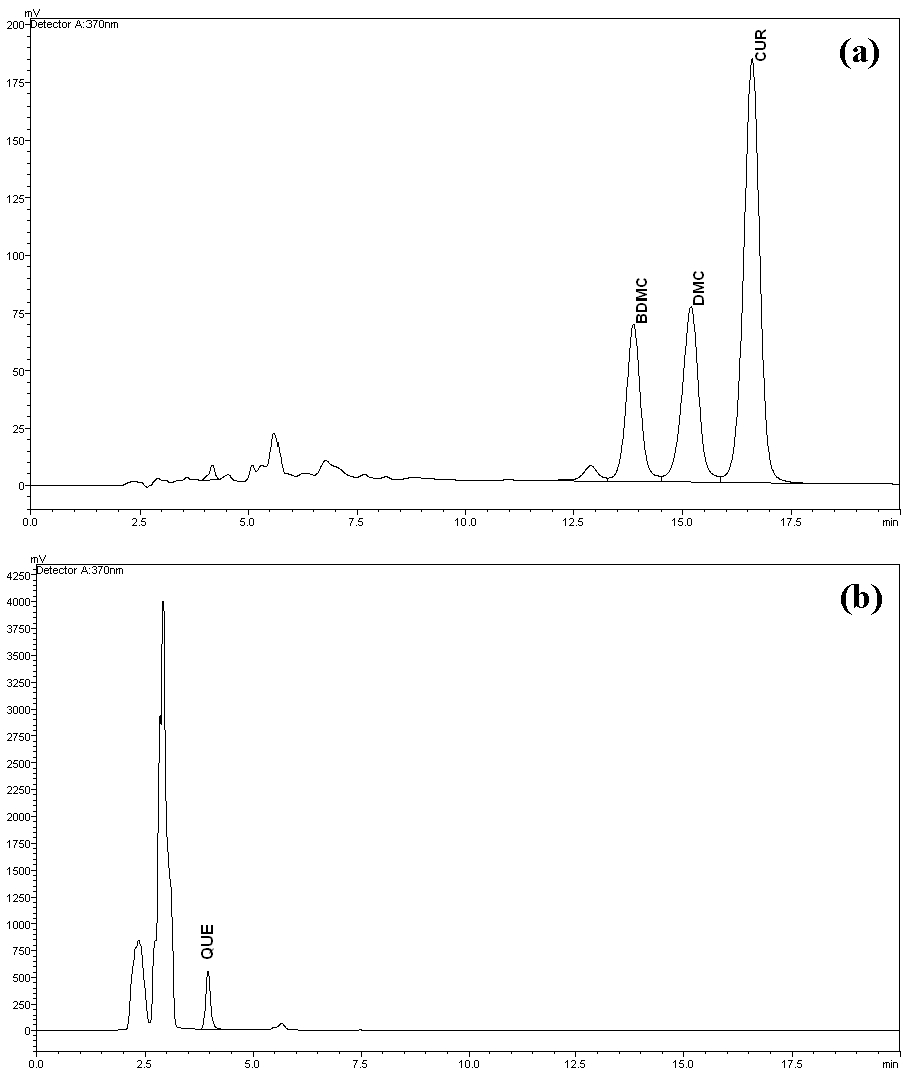
The peaks of quercetin, bisdemethoxycurcumin, demethoxycurcumin and curcumin were well separated at different retention times with resolutions of 32.195, 2.887 and 2.830 for quercetin-bisdemethoxycurcumin, bisdemethoxycurcumin-demethoxycurcumin and demethoxycurcumin-curcumin, respectively. No interferences or excipient peaks co eluted with the analytes were observed, indicating the method is selective and specific in relation to the medium and excipients used in this study (Fig 2), (Table 2).
Precision and accuracy data for the intraday and the inter-day variations for the three QC samples are summarized in (Table 3). The RSD values for the intraday and the inter day precisions were < 1%. For the accuracy test, the intraday and the inter day accuracies ranges from 98.292% to 103.617%, confirming the accuracy of the method.

Precisions and accuracies for intraday and interday repetitions for the quantitative detection of QUE, BDMC, DMC and CUR
[Table. 4a] (a). Robustness ? change in organic composition
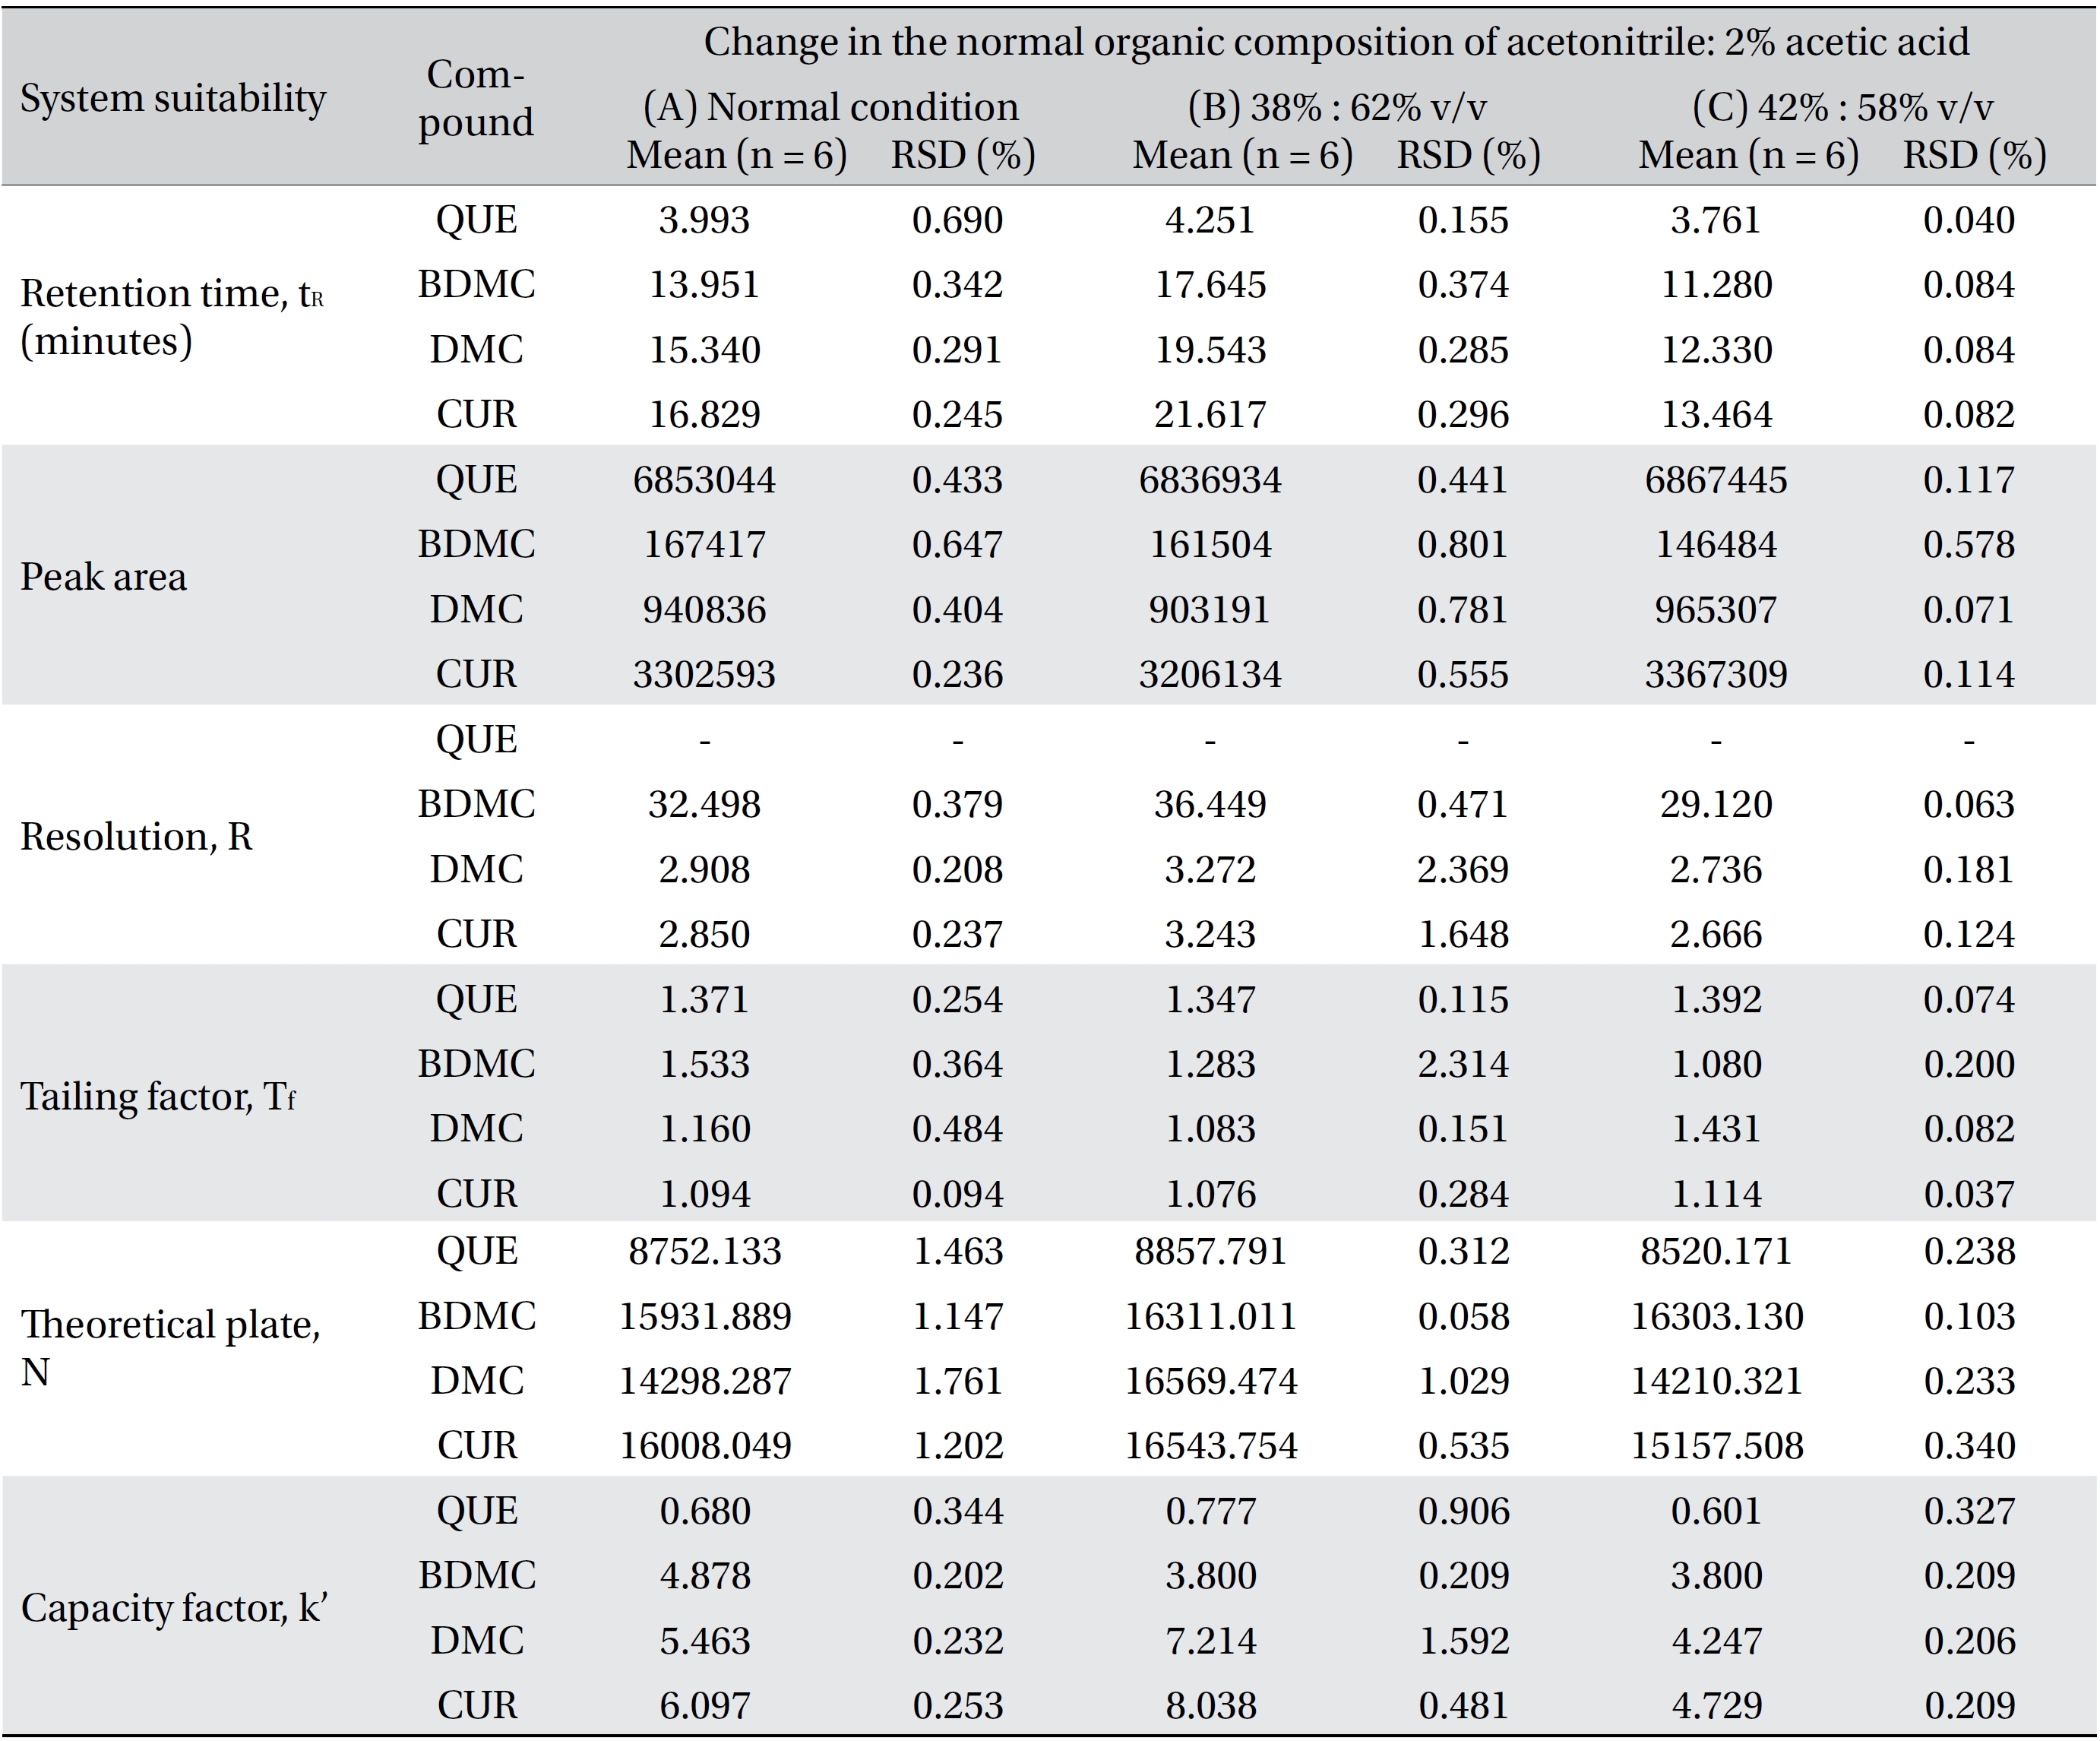
(a). Robustness ? change in organic composition
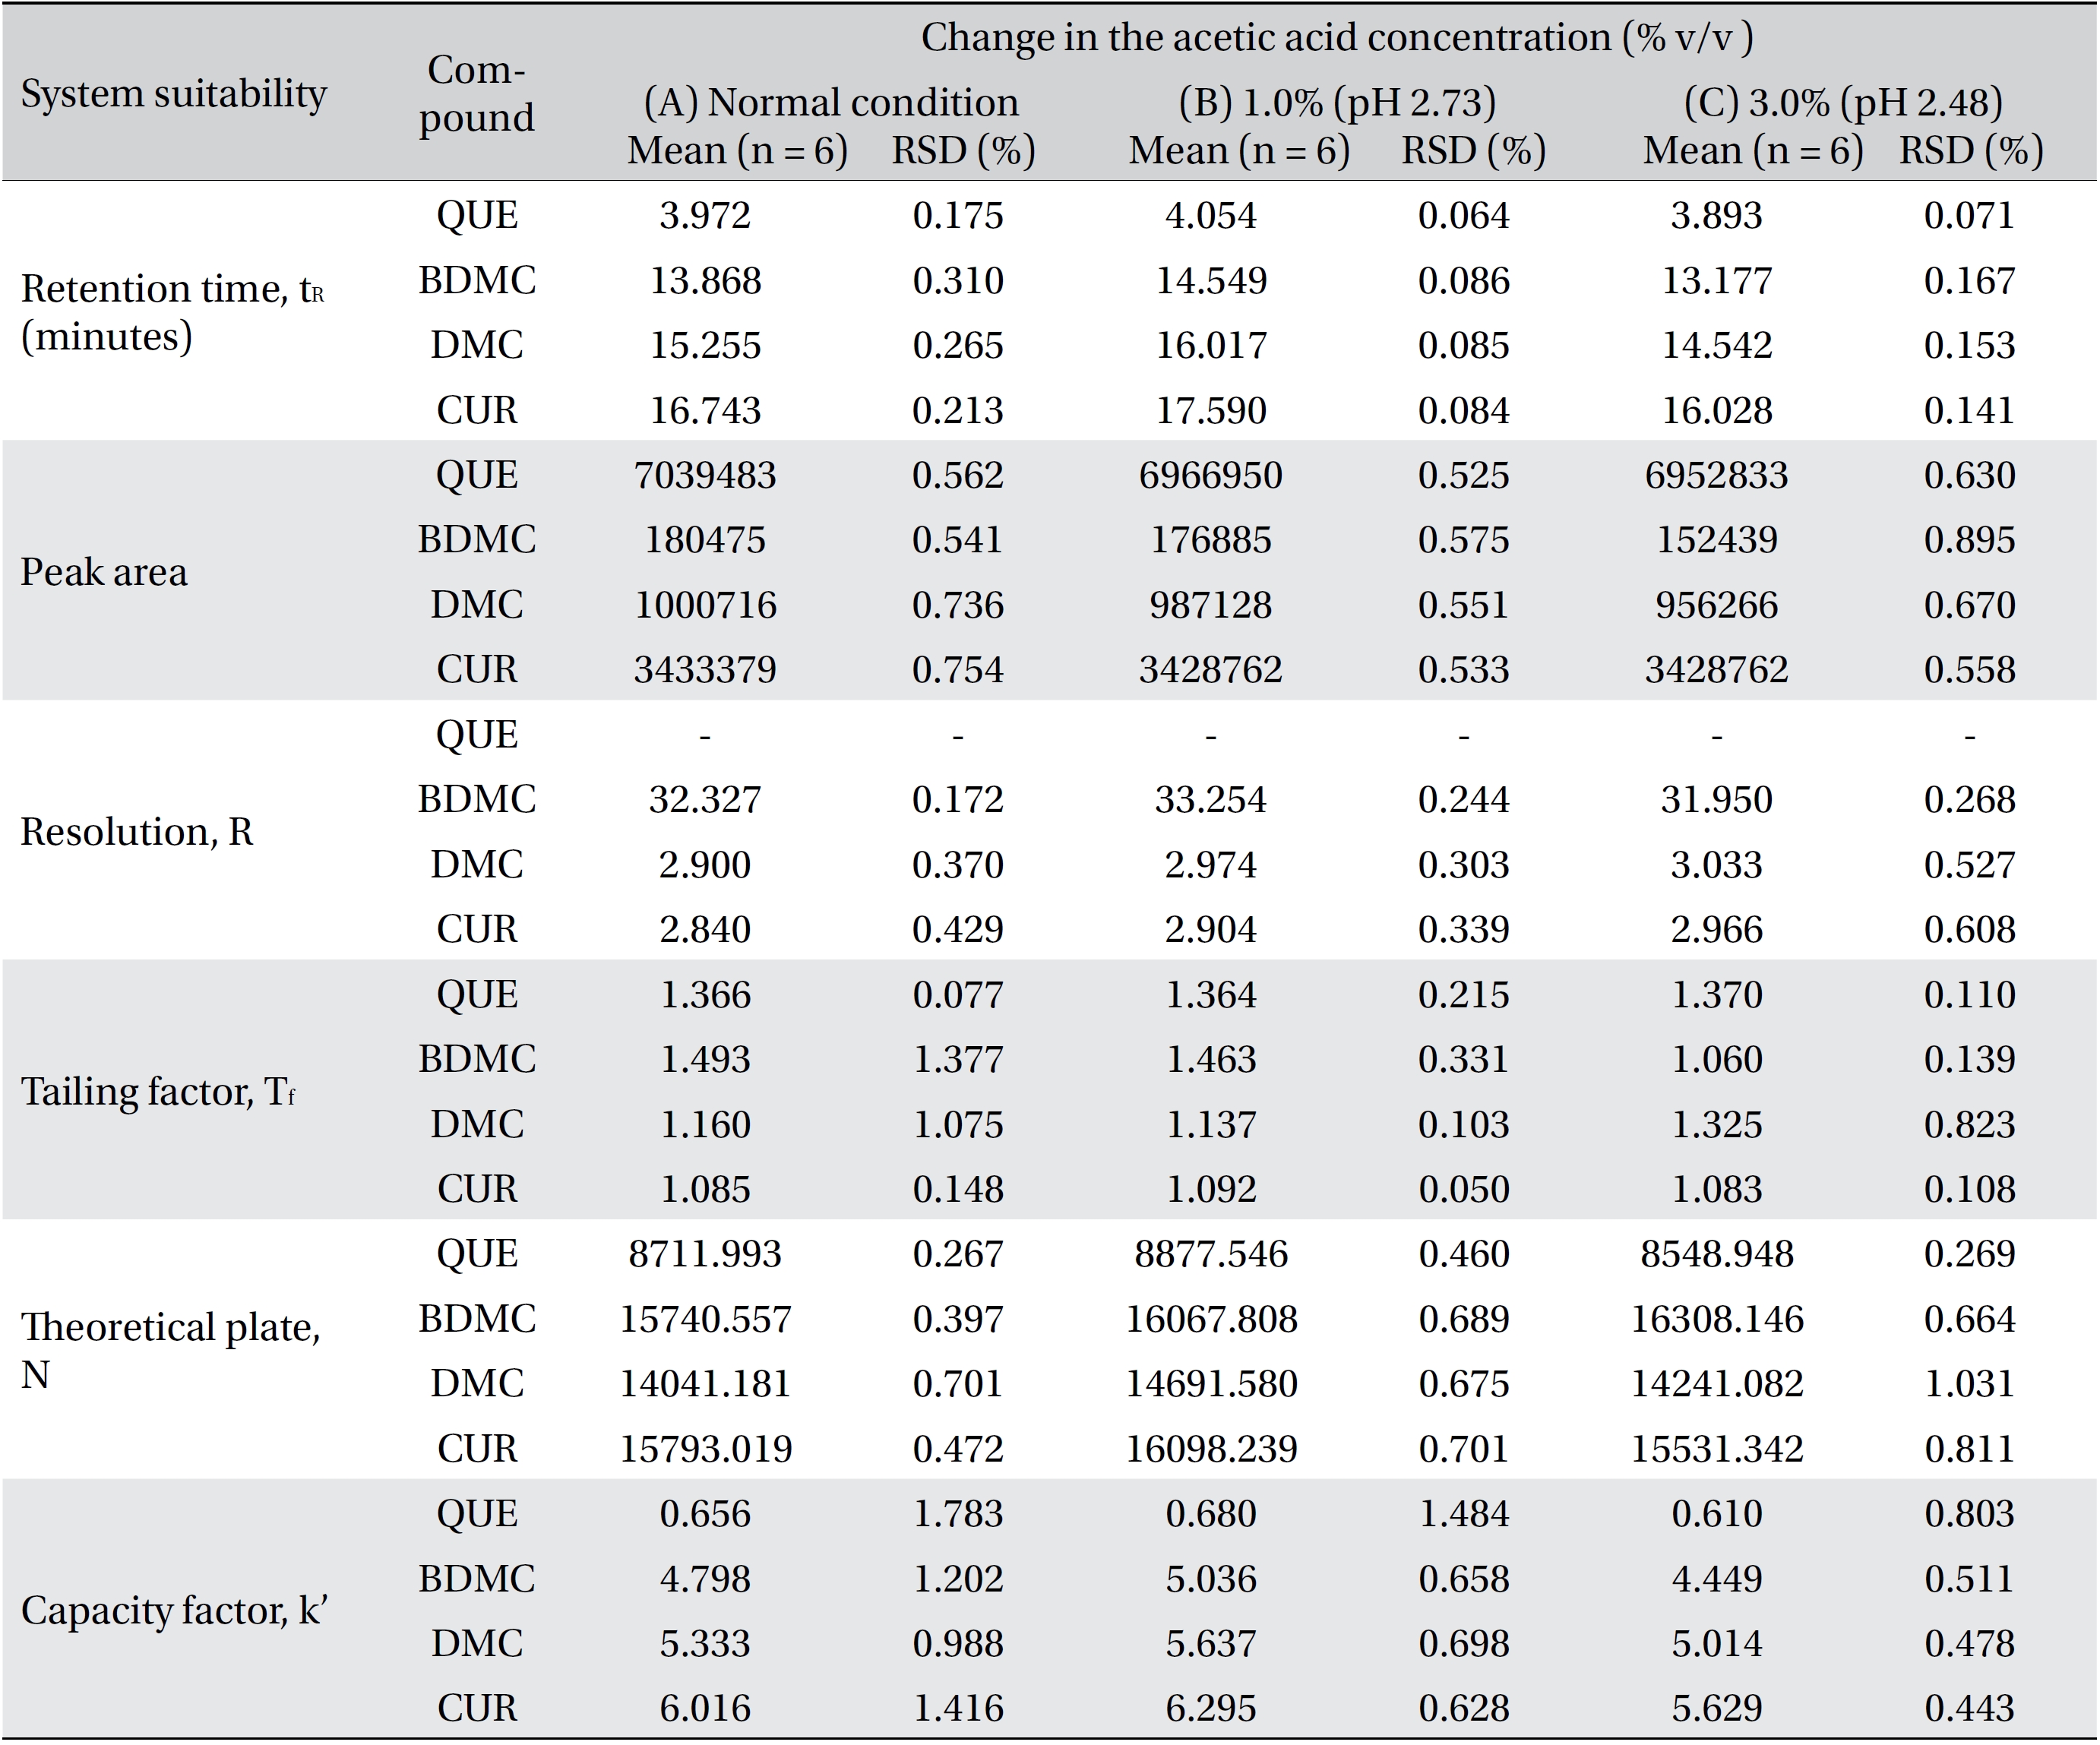
[Table. 4b] (b). Robustness ? change in acetic acid concentration

(b). Robustness ? change in acetic acid concentration
[Table. 4c] (c). Robustness ? change in flow rate

(c). Robustness ? change in flow rate
[Table. 4d] (d). Robustness ? change in column temperature
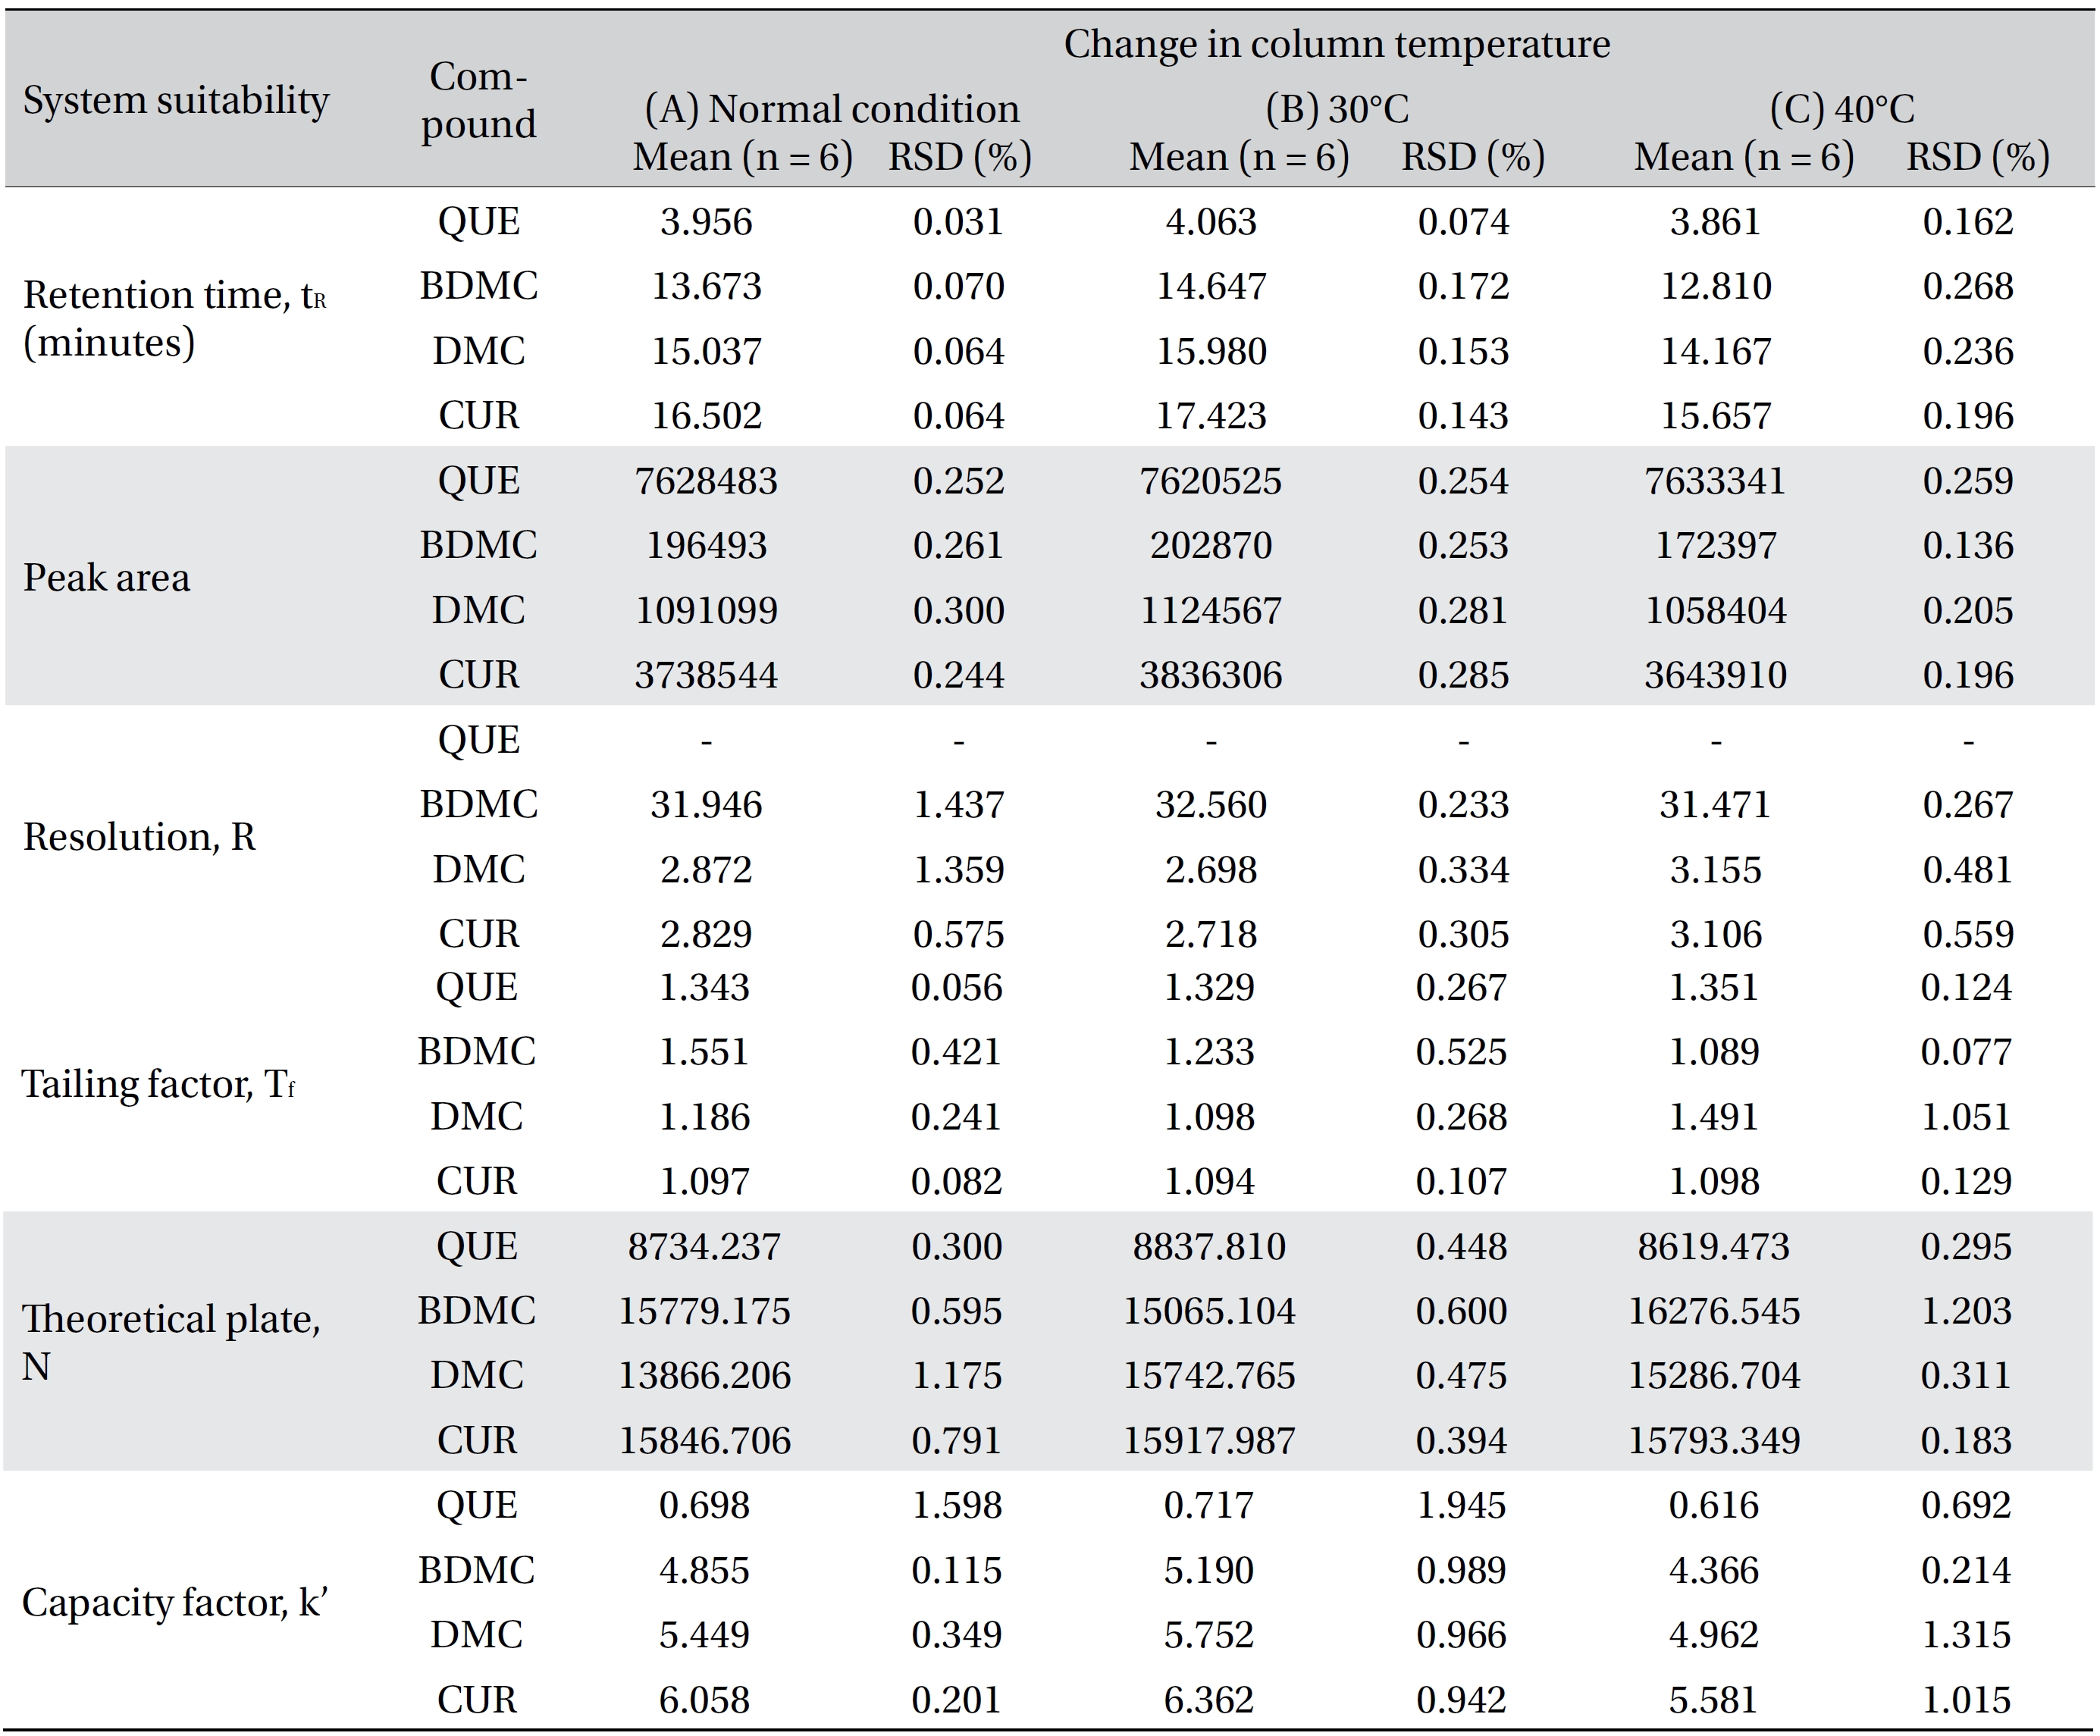
(d). Robustness ? change in column temperature
[Table. 5] System suitability parameters, calculation formula and recommendations
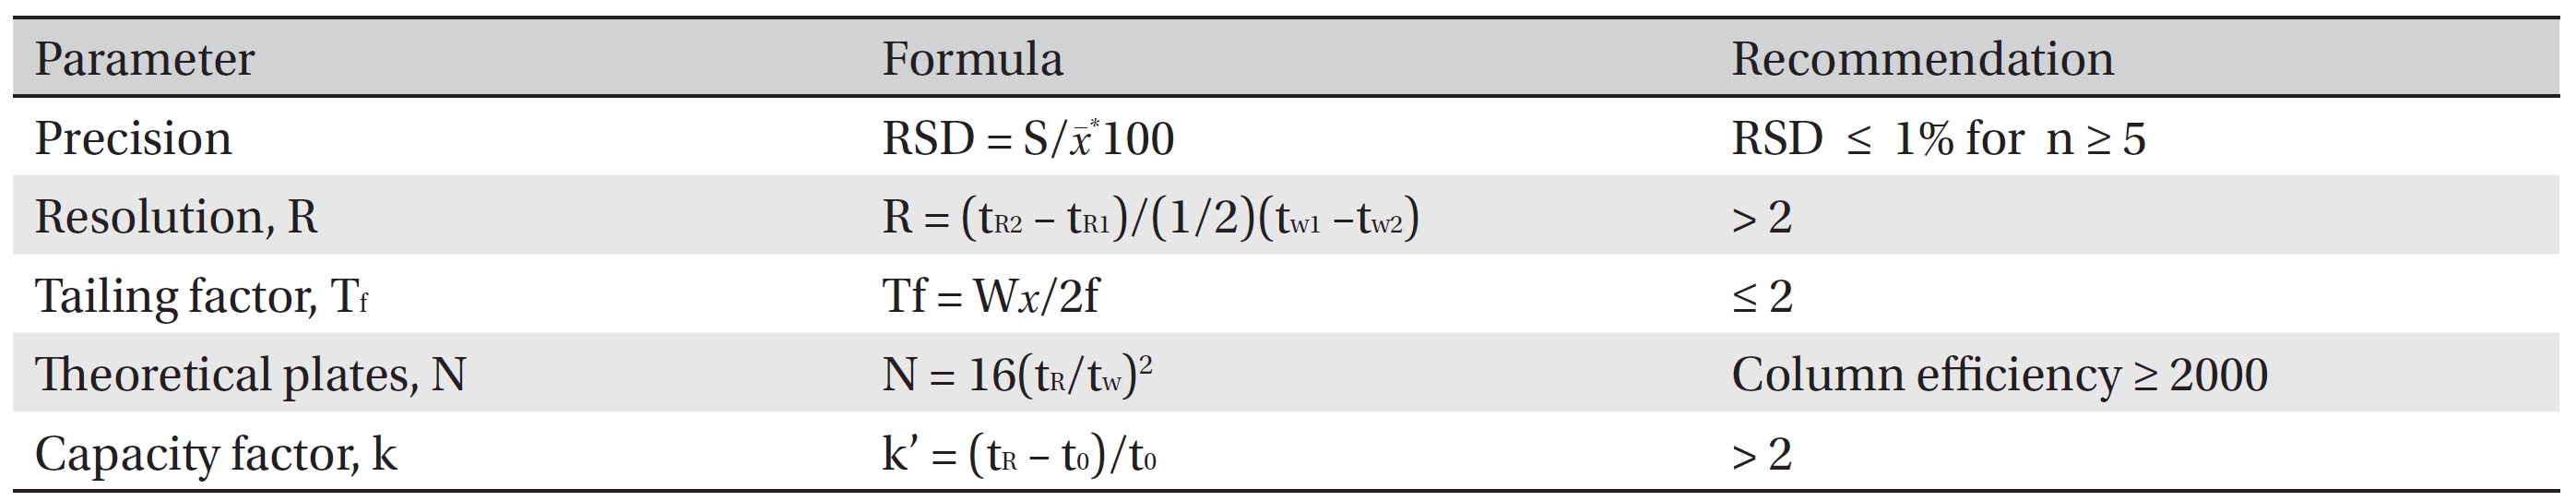
System suitability parameters, calculation formula and recommendations
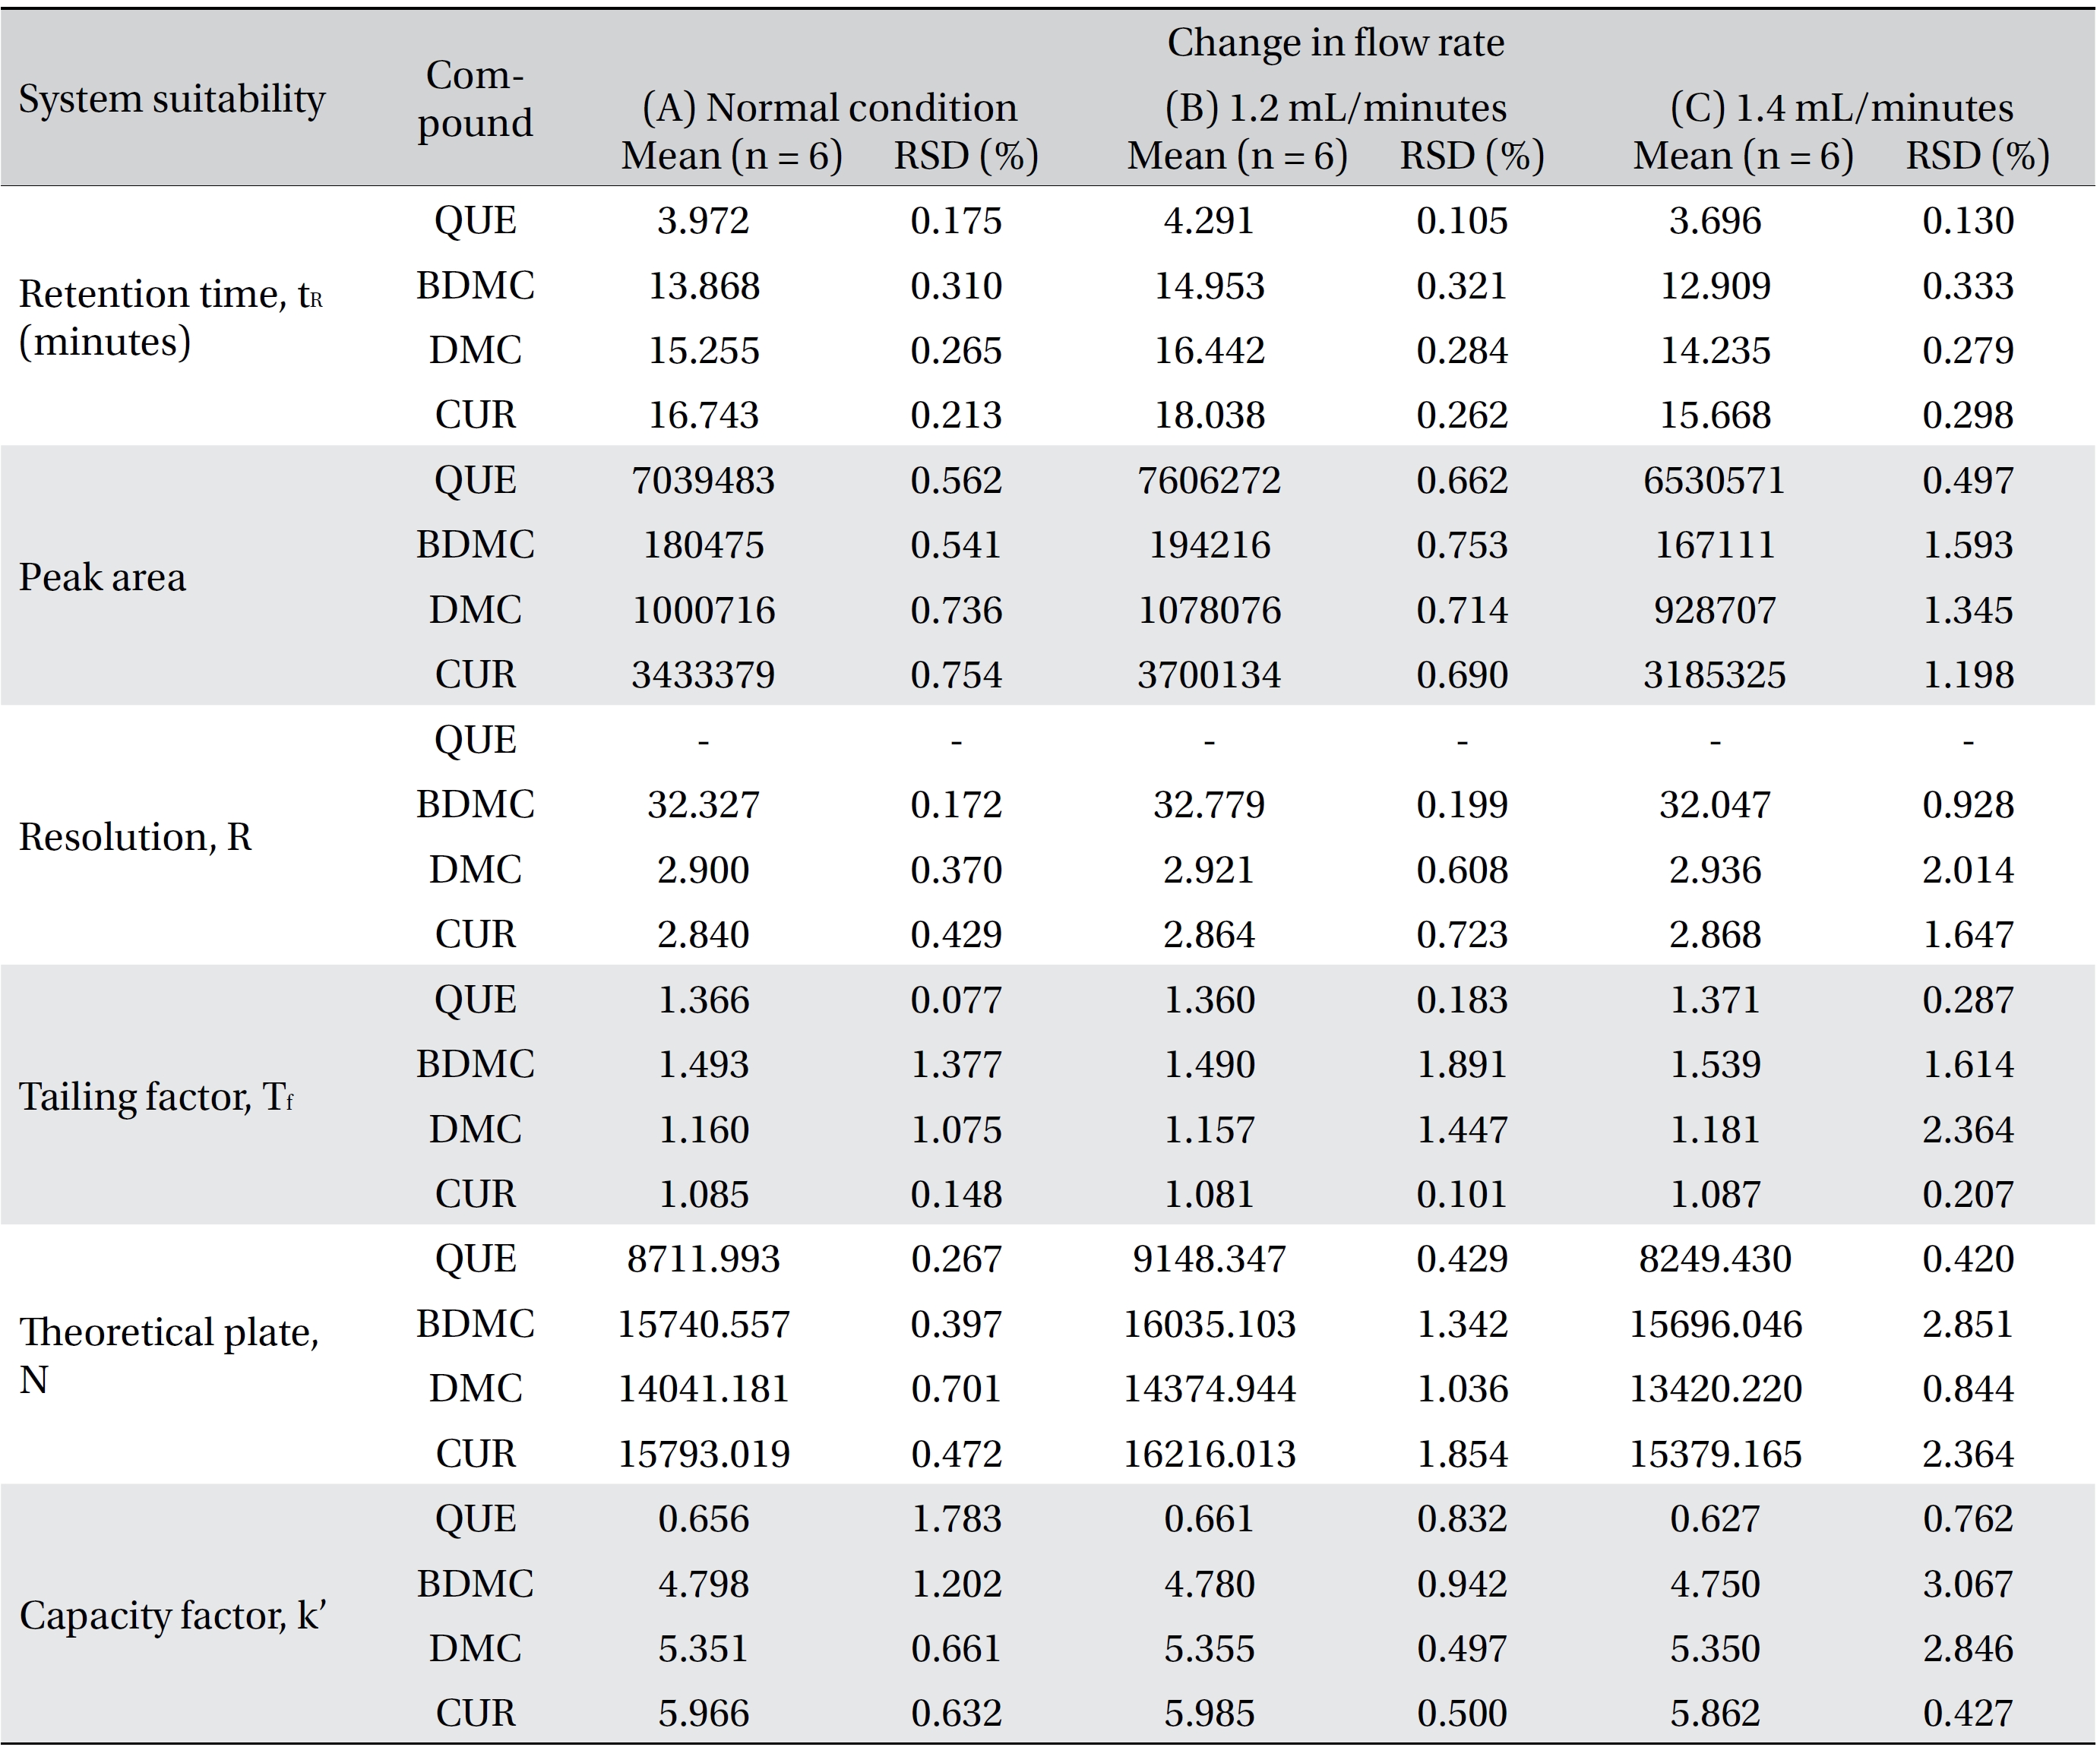
[Table. 6] System suitability testing
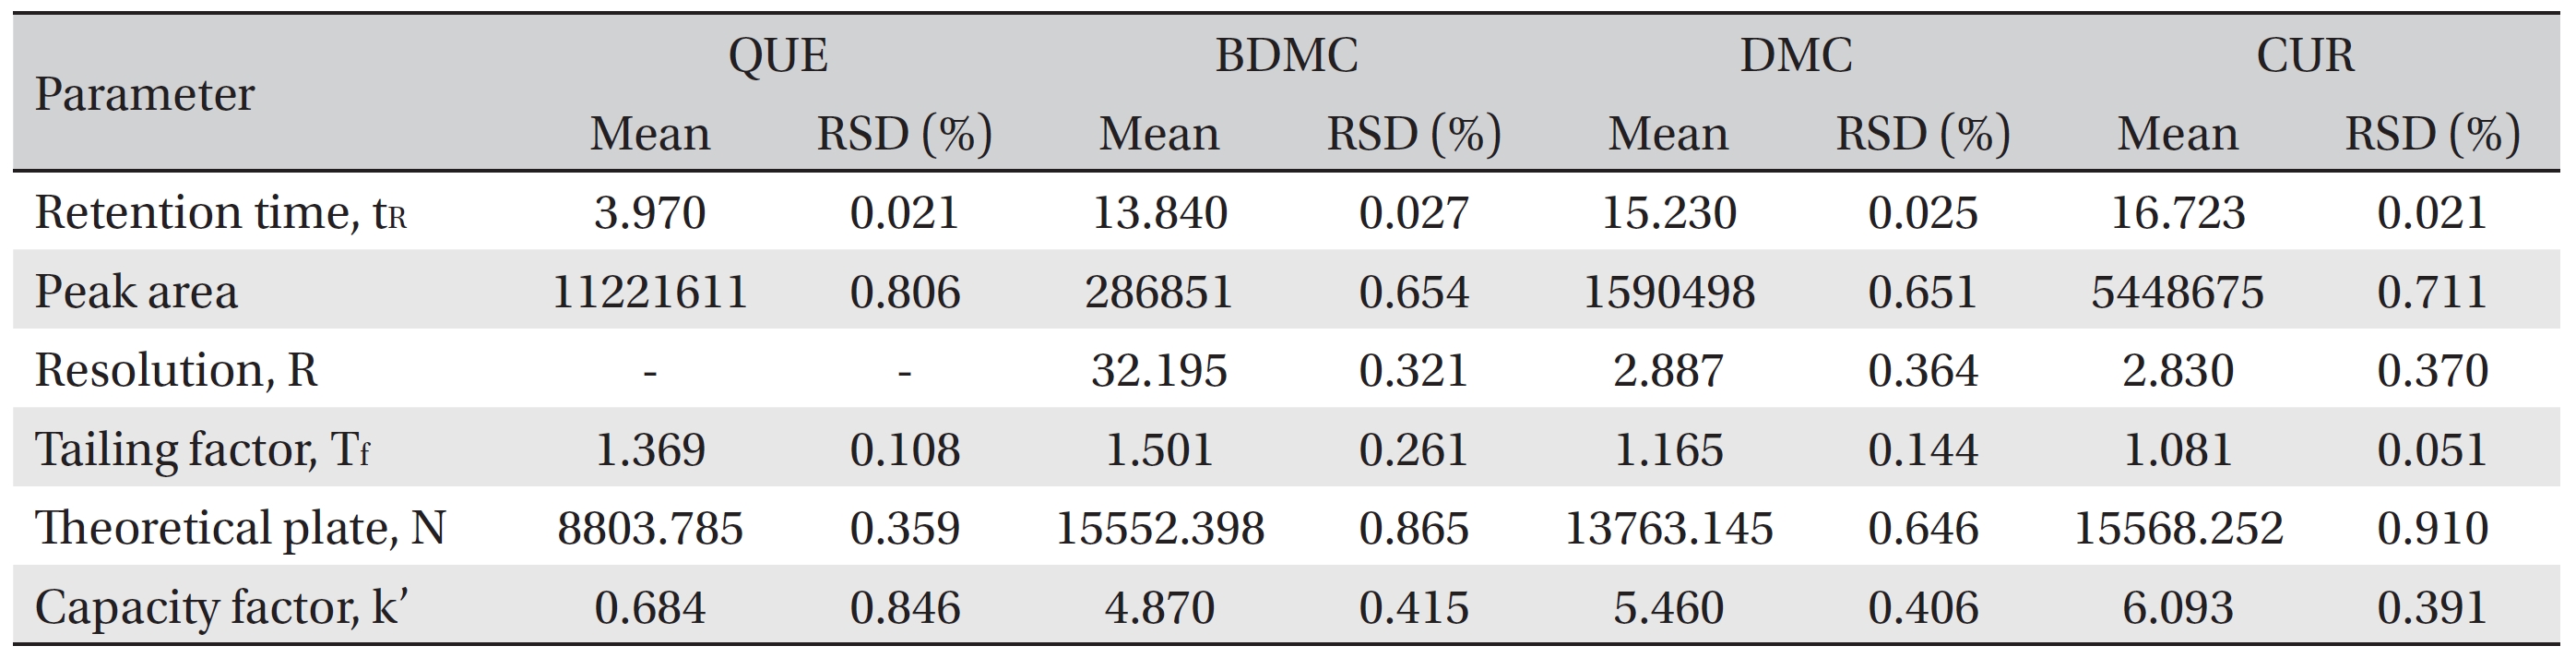
System suitability testing
Robustness is a measure of the method’s capability to remain unaffected by small, but deliberate, variations in the method parameters [52]. The robustness parameters tested were the mobile phase’s composition, the concentration of acetic acid (pH effect), the flow rate and the column temperature. The results are tabulated in Table 4(a-d). The retention times for all four compounds due to variations in the parameters were significantly different compared to those for the normal parameters. The peak area for curcumin was not significantly different after changing the acetic acid concentration from 2% to 3%, but was significantly different after changing the concentration from 2% to 1%. Quercetin, bisdemethoxycurcumin and demethoxycurcumin were shown to have significant differences in their peak area when the concentration of acetic acid was changed. Changes in the acetonitrile’s composition and temperature were shown not to cause significant differences in quecetin’s peak areas, however significant differences were seen in curcumin, bisdemethoxycurcumin and demethoxycurcumin peak areas. Increasing or decreasing the flow rate by 0.1 mL/min from normal conditions significantly raised or reduced the values of the peak areas of quercetin, bisdemethoxycurcumin, demethoxycurcumin and curcumin. Although changes in experimental conditions changed the retention time, the peak area and the values of the system’s suitability parameters, the four analyzed peaks were still well resolved from each other and from additional small peaks and showed good resolution in the tested parameters (Fig 3)
The system suitability criteria were in accordance with the Centre for Drug Evaluation and Research (CDER) guidelines [53] and are summarized in (Table 5) The mean values of the six replicate injections of 160 μg/mL QC standards were used to evaluate the retention time, the peak area, the resolutions for the analyte peaks, the tailing factor, the number of theoretical plates and the capacity factor. The results for the system suitability parameters are shown in (Table 6) The RSD values for the tested parameters were < 1%, indicating the precision of the method. The tested parameters passed the criteria under the CDER guidelines except for the capacity factor value for quercetin (< 2) [53]. This is because the retention time of quercetin was quite fast and just 1 minute behind the solvent peak. However, the quercetin peak was well resolved from the solvent peak and from the front additional small peak.
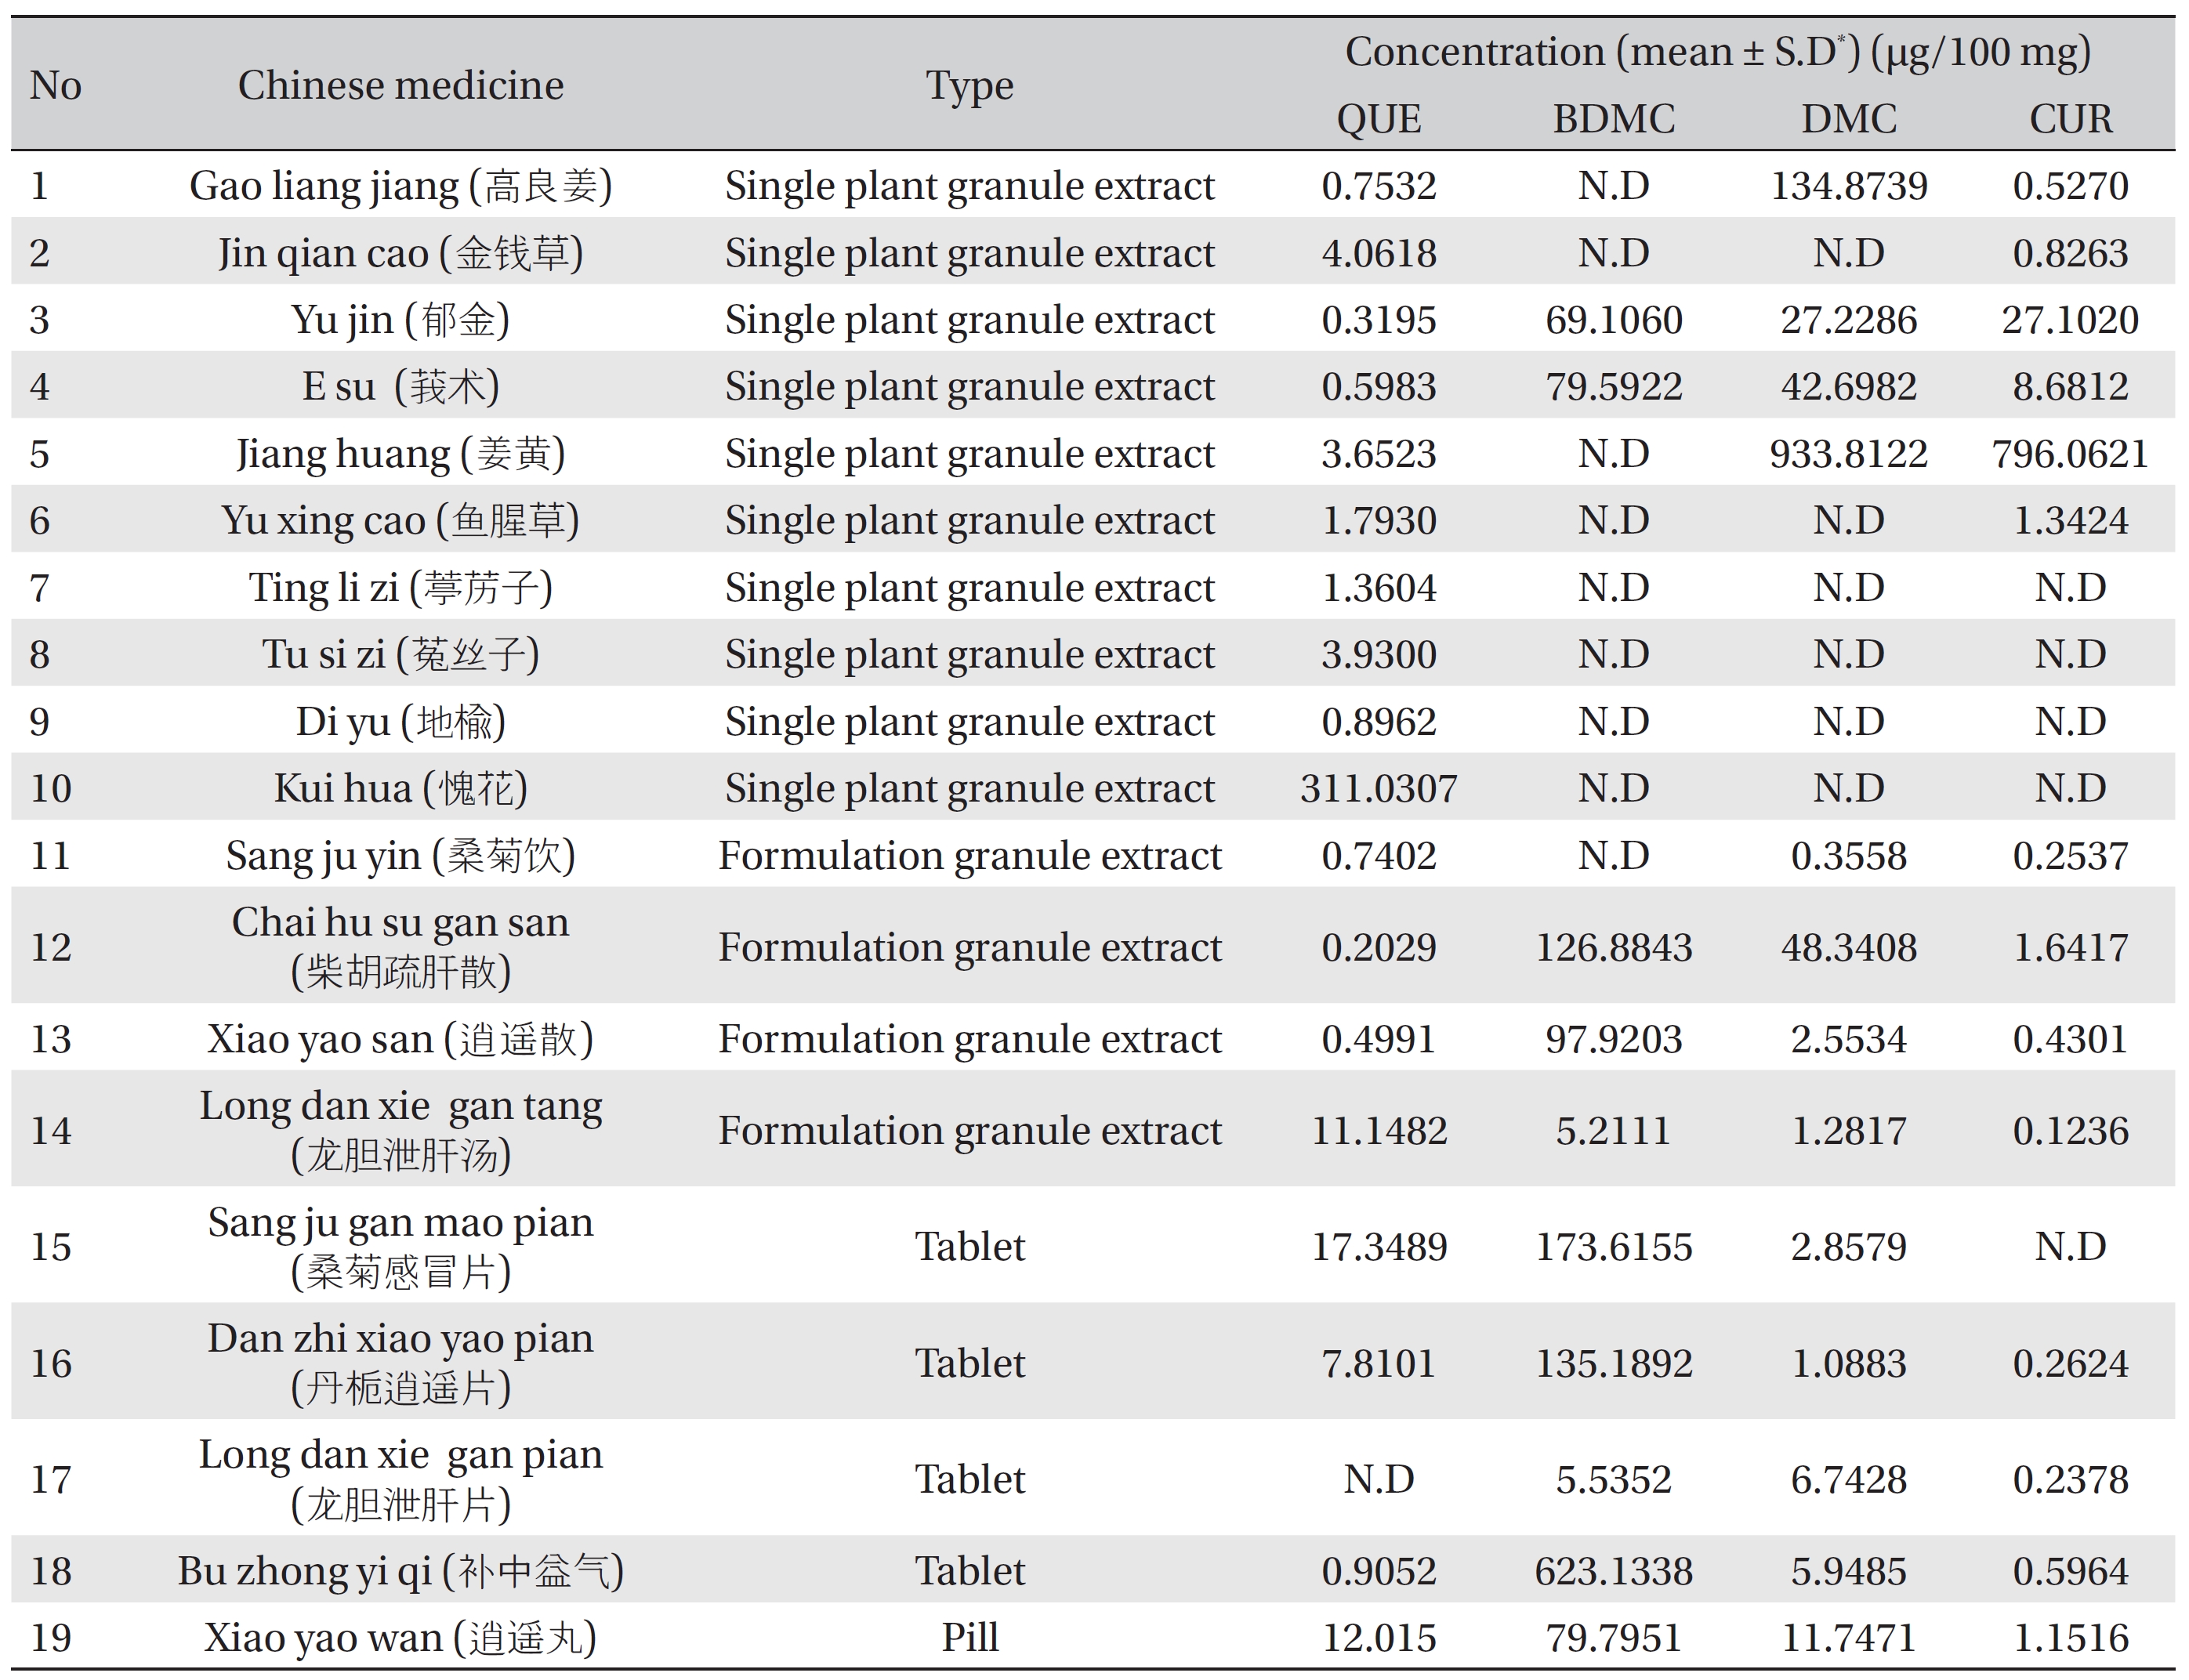
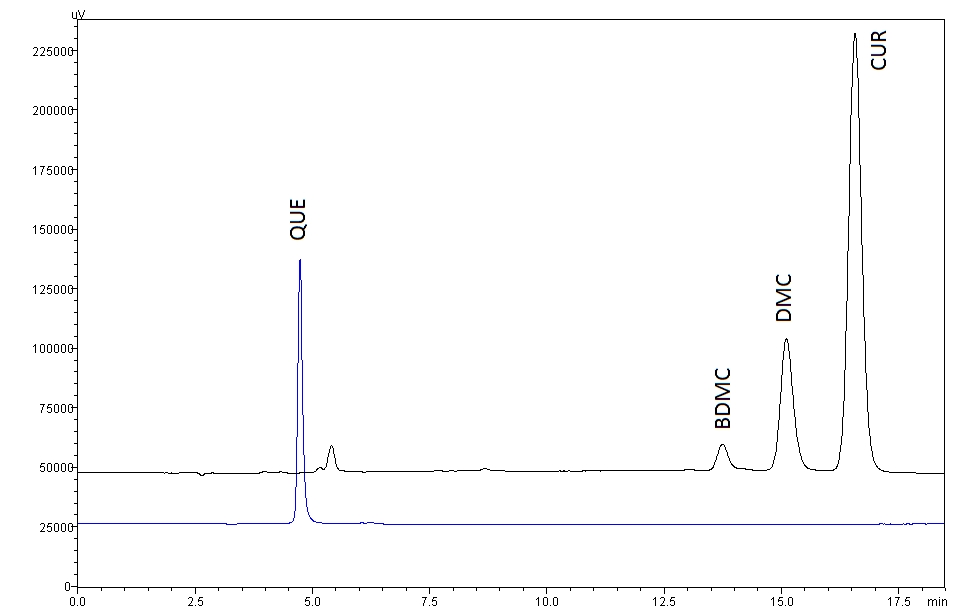
The proposed method was applied to quantitatively detect the quercetin and curcuminoids in Chinese medicines such as plant granule extracts, tablets and pills. The results of 19 samples are summarized in (Table 7). In the tested samples, BDMC had the highest concentration compared to the other two curcuminoids tested (DMC and CUR), and was found in the formulations of granule extracts, tablets and pills (such as samples 12, 13, 15, 16, 18 and 19) (Table 7). The preference of BDMC over CUR in the medicine might be due to its strong biological properties, which its use as a cure for diseases or as a supplement for certain purposes. Quercetin was found in most of the tested samples, indicating that this compound is common and useful for treatment. (Fig 4) shows the chromatograms for the quercetin and the curcuminoids found in the tested samples.
[Table. 7] Concentration of QUE, CUR, DMS and BDMC in Chinese medicines

Concentration of QUE, CUR, DMS and BDMC in Chinese medicines
The HPLC method was developed by optimization of the mobile phase conditions so that quercetin, bisdemethoxycurcumin, demethoxycurcumin and curcumin peaks could be simultaneously detected by using the same solvent system and an isocratic method. The flow rate, acetic acid concentration and column temperature were varied to determine the chromatographic conditions giving the best separation and the shortest analysis time. UV visible sperctrophotometry in the wavelength from 200 to 500 nm was used for the detection of quercetin and curcuminoids; 370 nm was chosen as appropriate wavelength for the analysis of quercetin and curcumin derivatives.
The retention times for quercetin (3.97 minutes), bisdemethoxycurcumin (13.84 minutes), demethoxycurcumin (15.23 minutes) and curcumin (16.72 minutes) were reasonable because the method is simple and general. The chromatograph peaks for mixtures of curcumin were identified based on their percentages in the mixtures. Most of the commercially available curcumin/turmeric products contain mixtures of curcumin, demethoxycurcumin and bisdemethoxycurcumin. Among these, curcumin (46% ─ 72%) is the major compound, followed by demethoxycurcumin (11% ─ 28%) and bisdemethoxycurcumin (3% ─ 14%). All four analyte peaks were well separated from each other and from small additional peaks.
The linear ranges of quercetin (0.039 ─ 200 μg/mL), bisdemethoxycurcumin (2.500 ─ 320 μg/mL), demethoxycurcumin (0.313 ─ 320 μg/mL) and curcumin (0.078 ─ 320 μg/mL) are suitable for the analysis of most the pharmaceutical products, containing the compounds and for the analysis of crude herbs. The low LOD and LOQ values indicate that the method provides adequate sensitivity. The R2 values > 0.999 for the regression model for the calibration curves confirm the good linearity of the method.
The accuracies ranged from 98.292% ─ 103.617%, and the precisions were less than 1% which indicate that the proposed method is well validated and suitable for quantitatively detecting curcuminoids and quercetin simultaneously in pharmaceutical products, herb materials and various turmeric and quercetin containing products.
System suitability testing is important to ensure the performance of the system before and during the analysis. As defined in the United States Pharmacopeia/National Formulary (USP/NF) [54] system suitability parameters were established as a direct result of the ruggedness and the robustness of the experiments. The system suitability testing proved that the proposed method will allow the separation of all four anaytes and will produce satisfactory peak shapes.
A simple isocratic RP-HPLC method with UV detection has been developed for simultaneous detection of quercetin, curcumin, demethoxycurcumin and bisdemethoxycurcumin. The analytes were well separated and detected within 19 minutes. This method was validated for specificity, linearity, precision, accuracy and robustness as per ICH guidelines. The data showed good selectivity and sensitivity, a wide linear range, precision and accuracy. The method was sensitive to HPLC conditions; that is, changes in the mobile phase’s composition, the pH, the column temperature and the flow rate affected the retention time and response, but did not affected the separation of the compounds. In addition, each parameter showed good repeatability of the retention time and response. In conclusion, the proposed method is simple, easy and cost effective, no specific solvent is involved and it utilizes common HPLC instruments with UV detectors. Hence, this UV-HPLC method is suitable for routine analysis of quercetin and curcuminoid formulations or products.