Carbon, the 6th element in the periodic table is denoted by letter ‘C.’ Carbon is found almost everywhere, and it is one of the most abundant materials on earth. It is the 4th most common element in the universe and 15th most common on earth’s crust. The name carbon comes from a Latin word “carbo,” which means coal and charcoal; hence, it is also derived from the French word “charbon” which means charcoal.
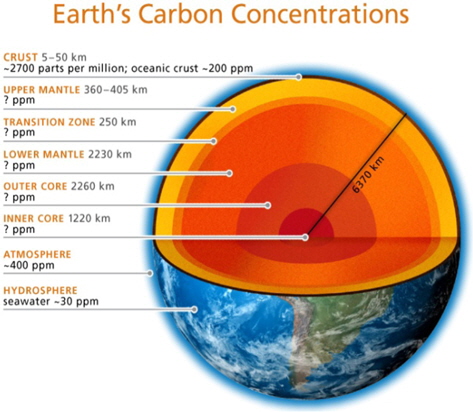
The following figure (Fig. 1) shows the carbon distribution on and in the earth, and it may be summarized as follows:
1) Earth crust has 2700 ppm of carbon 2) Oceanic crusts have 200 ppm of carbon 3) Our atmosphere has 400 ppm of carbon 4) Hydrosphere has 30 ppm of carbon content
All the organic life on earth is made up of allotropes of carbon. All living organisms are composed of carbon, including human beings, animals, plants etc. In the human body, carbon is the second most abundant element by mass after oxygen [2].
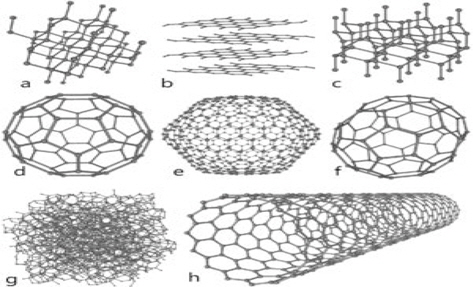
Carbon has basically 8 allotropes [3], namely, 1) diamond, 2) graphite, 3) lonsdaliete, 4) C60 (buckminister fullerene or bucky ball), 5) C540, 6) C70, 7) amorphous carbon, and 8) carbon nanotubes (CNTs; buckytube). Carbon has been the subject of intense interest from researchers for decades. In this article we shall discuss the current extent of research successful in exploring the world of carbon. The following figure (Fig. 2) represents all the eight allotropes of carbon and their structures.
Ever since the discovery of fullerene in 1985 by Kroto
Graphene is best known for its enhanced properties of electron transport, conductivity, optical properties, and the fact that it is the strongest material known to man. Graphene has zero band gap; hence, it has no possibility of luminescence and has attracted the attention of researchers in optoelectronics [8,9].
All these discoveries led to growing interest of many scientists in almost all the major fields of science, including chemistry, physics, biology, electronics, and medical sciences.
Some of the allotropes are further classified with respect to their size, shape, and orientation of bonds.
Lonsdaleite is named in honour of Kathleen Lonsdale; it also is called hexagonal diamond [10,11]. This allotrope of carbon is found in meteorites containing graphite that have struck the earth. It was first identified in 1967 from a meteorite named the Diablo Canyon meterotie. Unlike in diamond, the interlayer bonds are in an eclipsed conformation. Lonsdaleite is found to be 58% harder than diamond on the (100) face, and it has a resistance to indentation pressure of about 152 Gpa, which is much higher than the resistance of diamond of 97 Gpa [12].
Graphite was named by a German geologist Abraham Gottlob Werner in 1789. It has a planar structure of carbon atoms stacked in layers (each layer of carbon atoms is referred to as a graphene layer or graphene sheet) in a honeycomb lattice with a separation of 0.142 nm. Each layer is held together by a weakly unsaturated π-bond.
1.2.1. Graphene
Graphene is formed out of flat monolayer of carbon atoms which are densely packed in a honeycomb lattice in 2-dimensions. The carbon atoms are sp2 hybridized; hence, they form strong intra layer bonding within the hexagonal carbon-rings, which makes graphene the strongest material known to man, up to 100 times that of hypothetical steel [13].
Diamond is a meta-stable allotrope of carbon with the carbon atoms arranged in a face-centred cubic crystal structure. Diamonds are formed at a pressure of 5-6 Gpa and temperatures ranging between 900-1400 [14]. Diamond is less stable than graphite, but the conversion of diamond to graphite in standard conditions is trivial. The colour of diamond is dependent on the other elemental composition, such as nitrogen [15] and boron.
The discovery of fullerene attracted a lot of interest from researchers all over the world. Fullerene was discovered just one year before the discovery of carbon soot, which was synthesised for the first time in inert atmosphere from graphite by a resistive heating process [16].
A fullerene is a molecule formed out of only carbon atoms to form the shape of a hollow sphere, ellipsoid, or tube. Fullerenes that are in the form of a tube are referred to as CNTs. CNTs consist of hexagonal rings with carbon atoms and have pentagonal rings in order to form a curve. Fullerenes are also called “bucky balls.”
1.4.4. Types of fullerenes
Buckminster fullerene (C60)
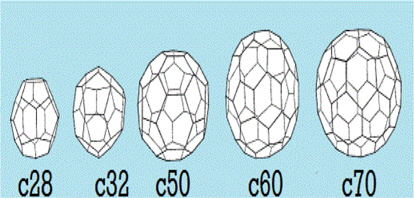
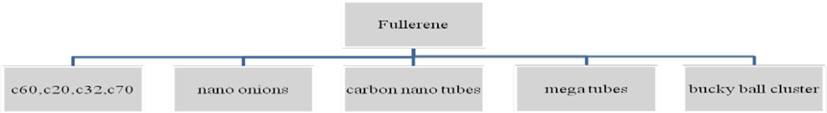
A Buckminster fullerene is an enclosed spherical structure with hexagonal and pentagonal rings made up of carbon named C60; the suffix represents the number of carbon atoms in the structure, and each carbon atom is sp2 hybridized. It has about 20 hexagonal and 12 pentagonal rings. The name Buckminster fullerene is given to C60 in reference to Richard Buckminster Fuller, an American architect who designed geodesic domes in 1960’s. The other possible structures of fullerene are C20, C26, C28, C32, C50, and C70 (Fig. 3). The C20 fullerene is the smallest possible fullerene.
1.4.1.2. Carbon nanotube
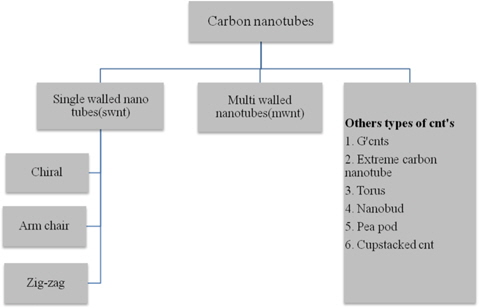
The CNT is a member of the fullerene family, and its name is derived from its cylindrical structure. A CNT is a rolled up graphene sheet in the form of cylinder which is one atom thick. CNTs with a length-to-diameter ratio of 132 000 000:1 have been constructed, which is significantly higher than any other material. They are further classified as shown in the following tree diagram:
1.4.1.2.1. Single-walled nanotubes
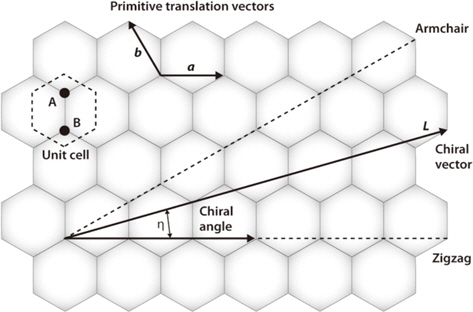
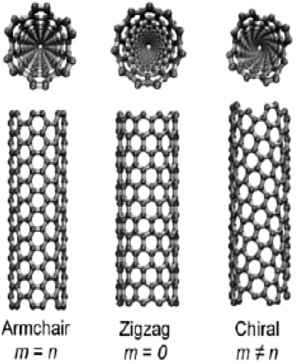
A single sheet of graphene when rolled up forms a singlewalled nanotube. Single-walled nanotubes are classified into three types which are described by the chiral vector (n, m), where n and m are integers of vector equation R = na1+ma2 as shown below (Fig. 4). The arrows represent the rolling direction of the graphene sheet three directions result in three types of single-walled CNTs (SWCNTs) (Fig. 5).
1.4.1.2.2. Multi-walled nanotubes
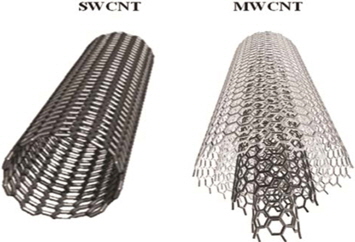
Multi-walled nanotubes are formed by concentrically rolled up sheets of graphene (Fig. 6). The rolling up of graphene to form multi-walled nanotubes has two possibilities. In the first, more than one SWCNT is arranged coaxially where the outermost single-walled nanotube’s diameter is larger than that of the inner single-walled nanotube. In the second possibility, a single graphene sheet rolls up on itself like a paper roll. The distance of seperation between two layers is approximately equal to 3.4 Å.
1.4.1.2.3. Other CNTs
1) Graphenated CNTs
Graphenated CNTs are a hybrid structure in which graphitic foliates are grown along the length of aligned multi-walled CNTs (MWCNTs), mostly referred as g-CNTs [21,22]. Graphenated CNTs are mostly known for their applications in supercapacitor performance. The advantage of having graphene is that it enhances the charge density because graphene edges have higher charge densities.
2) Extreme CNTs
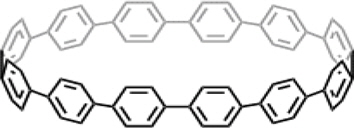
The shortest type of CNT with respect to its length is referred to as an extreme CNT [23]. The shortest CNT synthesized was by organic compound cycloparaphenylene [24] (Fig. 7).
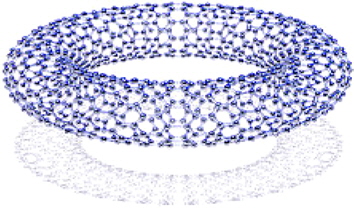
3) Torus
A torus is a doughnut-shaped CNT in which a SWCNT is organized to join head to tail to form a doughnut shape [26] (Fig. 8). A few possible torodial cage structures with varying numbers of atoms comprising the torodial shape have been reported [27].
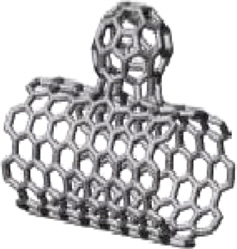
4) Nanobud
This type of CNT is a combination of both fullerene and CNT where the fullerene is bonded with the CNT on its wall by covalent bonding (Fig. 9).
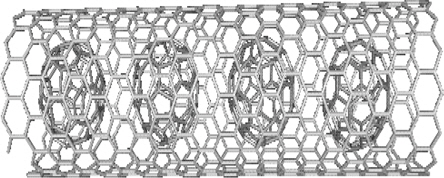
5) Peapod
It is a type of CNT which encloses a fullerene inside a CNT which has tuneable properties [30] (Fig. 10). The encapsulation is done to nanotubes with (n, m) values for an exothermic process (10, 10) nanotube and by an endothermic process for the (8, 8) and (9, 9) nanotubes. The minimum radius required for encapsulation is 6.4 Å [31].
6) Cup-stacked CNTs
Straight long carbon nanofibers which have a hollow core are stacked one above the other [33] (Fig. 11). Cup-stacked CNTs are known to exhibit a semi-conducting nature due to the stacked microstructure of graphene layers. This kind of CNT formation is particularly useful in the field of nanoelectronics owing to the electronic properties and band gap of 0.44 ev exhibited due to the stacked structure [34].
1.4.1.3. Carbon megatubes
Carbon megatubes are similar to CNTs but have a larger diameter exceeding a few microns (Fig. 12). These megatubes are large enough that they can be observed through a microscope. They were first synthesized in the year 2000 [36].
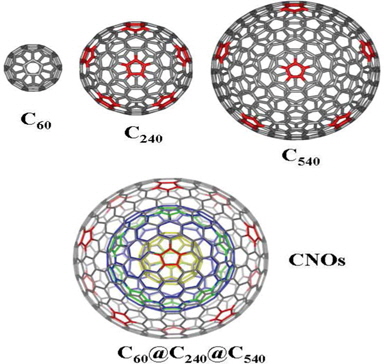
1.4.1.4. Carbon onions
Carbon onions are sphericallly closed carbon shells which resemble fullerenes. They have concentric fullerenes enclosed one inside the other as in the layered structure of an onion (Fig. 13). Carbon onions are also referred as carbon nano-onions or onionlike carbon [38]. Carbon onions have been produced in large quantities (gram quantities) by vacuum annealing of a nanodiamond precursor by Valdimr Kuznetov and others [39,40].
1.4.1.5. Bucky ball clusters
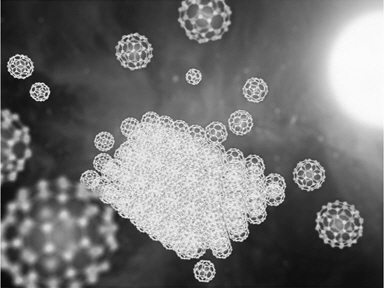
Many bucky balls combine to form a cluster called a bucky ball cluster. The shape of each bucky ball is not modified, but they bond to other bucky balls by surface to surface bonding. Tens to hundreds of bucky balls can bond to form a super bucky ball cluster (Fig. 14).
1.5. Other carbon nanomaterials
1.5.1. Carbon quantum dots
Carbon quantum dots are electrons confined fluorescent nanoparticles. Discovered in the year 2004 [43], they are a new member of the carbon family. Unlike fluorescent semiconducting nanocrystals i.e. cadmium sulphide which are referred as quantum dots or Qdots, carbon quatum dots have been poorly studied
1.5.2. Carbon spheres
Carbon spheres have a different structure compared to C60. The reports on the carbon spheres are very few in number compared to the research on other allotropes of carbon. The properties of carbon spheres are similar to those of graphite of fullerenes (Fig. 15).
1.5.3. Carbon nanofibers
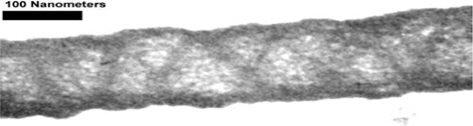
Carbon fibers can be described as sp2 hybridization-based linear filaments (Fig. 16). They come under the category of multiwalled nanotubes, but they are discontinuous, highly graphitic, and highly compatible with most polymer techniques. The diameter of carbon nanofibers is comparatively larger than CNTs, and the walls of carbon nanofibers are thicker than those of CNTs.
Many methods have been proven to be successful for the synthesis of allotropes of carbon from natural materials. Carbon nanomaterials have been synthesised using many techniques, such as chemical vapour deposition, plasma torch, arc discharge, super growth–chemical vapor deposition (CVD), laser ablation, flame synthesis, etc.
2.1.1. By vaporization of carbon source
The carbon source vaporization technique is not an efficient technique as the yield is very low >1%. A carbon source such as graphite is irradiated by laser. The conditions for this reaction are extreme with temperatures around 1300°C and pressure up to 1 kbar [16]. The fullerenes produced by this method are C60, C70, and trace amounts of C84. The purification of these fullerenes is difficult (20 high performance liquid chromatography cycles for C84). Due to the harsh environment required for the synthesis of the fullerenes, the production of a single type of fullerene is difficult. Various other methods are available for the synthesis of fullerenes for production on a commercial scale, such as the radio-frequency-plasma technique or the arc plasma technique. Even commercial production has the same drawbacks as the laser irradiation method. These above mentioned methods are referred as the I-G method for synthesis of fullerene. The I-G method is a combustion-based process for the synthesis of fullerenes, and it results in >98% pure fullerene or fullerene mixtures. The production conditions can be changed as required to meet specific requirements [46].
The longest CNT ever produced was 86 mm-long and was obtained by CVD [47].
Cup stacked CNTs (CSCNTs) about <3 μm long were grown in a quartz tube reactor. Its current voltage characteristics were reported to have a striking electronic transport, and the band gap of such CSCNTs were 0.44 eV [34].
The synthesis of CNTs or bucky tubes is being carried out on a large scale and by various techniques. Here is a report on CNTs synthesis techniques which are being carried out currently.
2.2.1. Using methane
SWCNTs and MWCNTs are synthesized by catalytic decomposition of CH4 and Fe-Mo catalyst. Fe-Mo is allowed to embed to form a bimetallic catalyst by introducing a solution onto Al2O3 powder by sonication and baking at 150°C. Then, the catalyst is placed in a quartz tube and kept in a furnace at 950°C in an Ar atmosphere. CH4 and Ar are allowed to flow at rates of 100 and 500 sccm, respectively [48]. Scanning electron microscope (SEM) analysis (Fig. 17) showed high-purity entangled carbon filaments with diameters from 20-45 nm. An high-resolution transmission electron microscope (HRTEM) image (Fig. 18) showed 70% SWCNTs and 30% DWCNTs, and the diameters of the SWCNTs were reported as 0.8-1.5 nm. The DWCNTs had inner and outer diameters of 3.1 nm and 2.3 nm, respectively, and other DWCNTs had diameters of 1.75 nm and 0.95 nm, respectively. Raman spectroscopy analysis with an Nd-YAG laser with a wavelength of 1064 nm was used; it found components of the low-frequency domain at 95.6, 134.2, 146.8, 172.2, and 263.6 cm‑1.
2.2.2. Using mustard oil
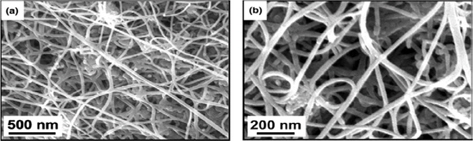
CNTs have been synthesized from mustard oil using an oil lamp by pyrolysing the mustard oil, and it was made water-soluble by oxidative treatment using nitric acid. Mustard oil was used because it contains much higher amounts of unsaturated fatty acids than other available edible oils. The mustard oil was burnt using cotton where the flame top portion temperature was about 650°C. The soot was obtained and purified using soxhlet extraction, primarily by petroleum ether, toluene, and alcohol and lastly by water to separate the unburnt oil and to remove other soluble impurities from the soot. Then, it finally was air dried [49]. SEM showed the presence of an extensive networked tubular structure with different types of junctions and branching of water-soluble CNTs (wsCNTs) (Fig. 19). By atomic force microscopy (AFM) analysis, images of the wsCNTs showed that the diameter of the wsCNTs varied in the range of 9-30 nm. The longest nanotube was almost 1 μm in length. X-ray diffraction (XRD) analysis showed high intense peak at 25.6 and low intense peak at 44.0. Raman spectral analysis showed peaks at 1590 and 1347 cm-1. Fourier transform infrared spectroscopy (FTIR) spectral data gave the information about the carboxylic functionalization of wsCNTs.
2.2.3. CNT from coal
2.2.3.1. Arc discharge
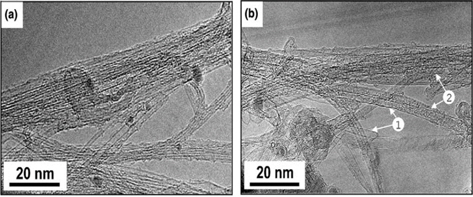
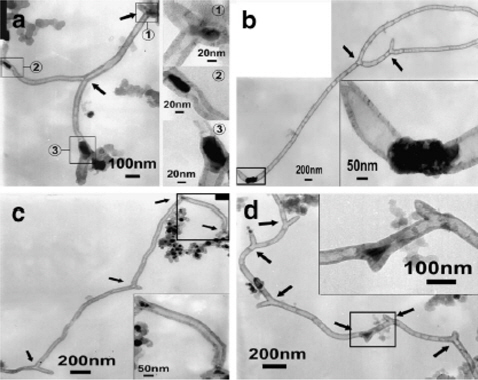
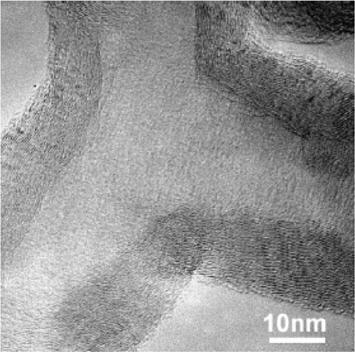
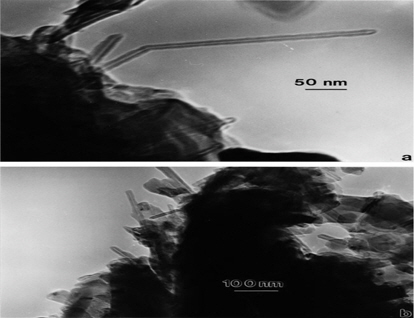
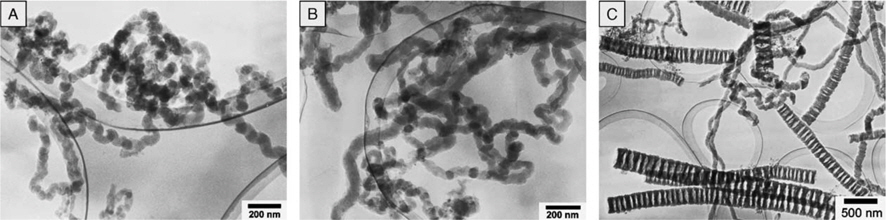
Branched CNTs (BCNTs) have been synthesized using coal. The process was carried out in a DC arc discharge reactor. The anode terminal was of high-purity graphite with inner and outer diameters of 10 mm and 8 mm, respectively, and the length was about 150 mm. It was filled with a mixture of anthracite coal and fine CuO powder of 150 μm-sized granules. The cathode was a high-purity graphite rod 15 mm in diameter and 30 mm long. The experiment was carried out in an inert (He) atmosphere. The weight ratio of CuO and coal powder was about 3:7. The operating ranges of current and voltage were 70-80 A and 25-30 V, respectively, at a pressure of 0.050.06 MPa. The erosion rate was about 0.34 g/min at the anode, and the deposits around the cathode were collected and characterised [50]. The TEM analysis of BCNTs (Fig. 20) showed several branches attached to the main stem of the tube. The inner diameters of the BCNTs were estimated to be around 40-50 nm, and the outer diameters were estimated to be around 50-60 nm. The angles between the stem and branches were from obtuse to sharp.
2.2.3.2. Arc vaporization
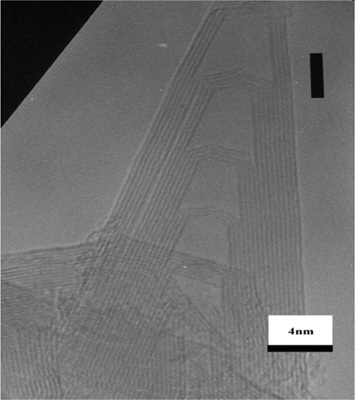
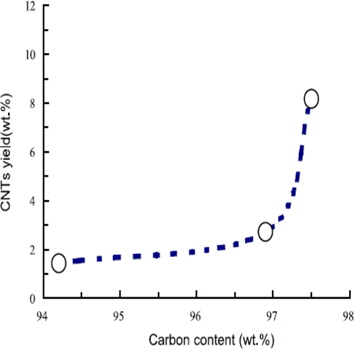
The arc vaporization method has been used to synthesize CNTs; three types of Chinese coal were used (coke, anthracite, and long-flame coal). These samples were crushed and sieved up to a size of 150 μm and mixed with binder (coal tar), the ratio was about 67:33 in weight. The binder was subjected to a press with pressure of 10-20 MPa. The mixture was formed into rods 10 mm in diameter. They were then placed in a furnace at room temperature. They were gradually heated to 900°C with a rise of 5°C/min then cooled down to room temperature. By this, the rods were resized to 10 mm in diameter and 20 mm in length. For the production of CNTs, the prepared carbon rods were placed in an electrically arching chamber with inert gas (He-99.99%). The anode was coal-derived, and the cathode was high-purity graphite. The pressure was around 0.033-0.076 MPa. The operating voltage and current were about 30-40 V and 0-70 A, respectively, and the distance of separation between the anode and cathode was about 3-4 mm. After the operation of arching, the material deposited above the cathode was collected [51]. SEM analysis showed CNTs had formed in rod-like bundles. HRTEM clearly showed (Fig. 21) the existence of CNTs that had been derived from coal with diameters ranging from 2-15 nm and a length of 4-70 μm. The highest yield was for anthracite coal at about 8.17 wt%; for natural coal it was about 1.44 wt%, and for long-flame coal it was 2.72 wt%.
2.2.4. CNT from wood soot
CNTs have been synthesized using Texas piñon pine wood chips combusted in the presence of air, combined with carbonaceous aggregates. Graphitic particulates were formed by the combustion of Texas piñon pine wood chips. Thermophoretic precipitation [52] was used to collect the smoke while the wood was combusting. High volume of air sampler was also employed fibre glass filters for PM10 and PM2.5 to separate matter by size in the ranges of <10 μm diameter and <2.5 μm diameter. The precipitate was collected on silicon monoxide/formvar-coated 200 mesh nickel TEM grids, which were placed on a cold substrate [53]. TEM analysis was performed at an accelerating voltage of 200 kV. The particle diameter ranged from 15 to 70 nm (Fig. 24). Other particles, such as graphitic fragments and multiwall CNTs and other aggregated multi-shell fullerenes, were observed.
2.3. Synthesis of carbon onions
2.3.1. By heat treatment of carbon soot
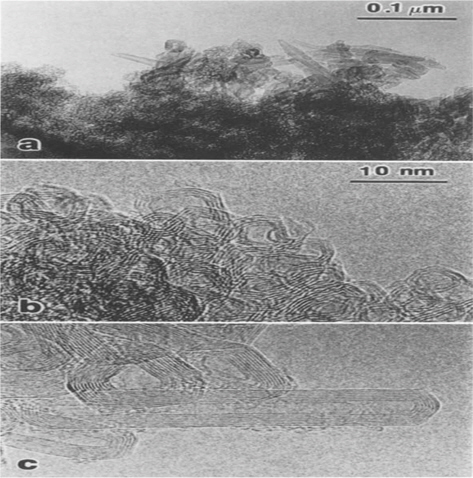
Initially carbon soot was produced by the carbon arc method. In this method carbon is compacted in a tube rolled from tantalum or tungsten foil. The tube was resistively heated to temperatures ranging between 800-2000°C in vacuum of less than 10-5 torr. The heating process was carried out in many steps to finally obtain carbon onions. Initially it was pre-heated at 500°C for approx 10 min. After that, the formation of smaller fullerenes was observed, and characterisation showed UV absorption properties of C60/C70. Then the sample was heated up to 1700°C for 1 h, and finally the sample was heated to temperatures ranging from 2000°C to 2400°C for 30 s to 1 h. It was observed that the soot heated at 1700°C was more compact and the colour was black and powdery. With further heating at 2000°C the sample was still compact, but it became extremely brittle, it would shatter even at the slightest pressure, an its colour was light black. The sample could be dissolved in water when ultrasonicated.
Electron microscopy characterization was done at almost each step and the formation of carbon onions was observed (Fig. 25). The powder obtained from the carbon arc had a particle size of 10-50 nm. At 1700°C, the material was observed to be glassy carbon, containing tangled interlocking microfibrils. At 2100°C, the structure slightly resembled hollow carbon onions with 2-3 layers of graphitic sheets, and at 2250°C, the onions had about 4-8 layers. The major and minor axes of the onions were about 4-10 nm and 3 nm, respectively. With further heating at 2400°C, the onions were more spherical, and other larger fullerenes were formed. An onion tube was also observed with dimensions of 43 nm length, and 7.5 and 2.2 nm outer and inner diameters [54].
2.3.2. Carbon onions by CVD method
A low-temperature chemical vapour deposition method is used to synthesize carbon onions with a nickel catalyst. By the homogeneous deposition precipitation process, an aluminumsupported nickel composite catalyst with a mole ratio of 1:1.84 was prepared. Ni(NO3)2. 6H2O and 400 mesh aluminum powder were added to 1 L of distilled water to get a mole ratio Ni/Al = 1.84/1. With constant stirring, NaOH mixed in 50 mL of distilled water was added to the solution prepared previously and kept for ageing for about 3 h without stirring. The pH level was kept neutral by repeatedly washing with distill water. Then it was vacuum dried for 120°C for several hours. The next procedure included calcination at 400°C for 4 h of the above obtained dry colloidal precipitate, which was mortared into fine particles. This NiO/Al composite powder was used to grow carbon onions.
The carbon onions were grown on Ni/Al by catalytically decomposing CH4. The Ni/Al was placed in a quartz boat, which was placed in the reactor and deoxidized at 600°C in a hydrogen atmosphere for 2 h. By feeding with CH4/N2 (99.99% purity/ 99.9% purity) gas to the reactor at 600°C, carbon onions were grown, and the flow rate was maintained at 60/540 mL/min. The flow of CH4 was altered only; N2 was allowed to prevent back flow. The furnace was allowed to cool down to room temperature naturally.
The XRD analysis showed peaks at 26.11° and 44.44° which can be assigned to graphite (002) and graphite and nickel (001). TEM analysis showed carbon onions of sizes ranging from 5 to 50 nm. The yield of carbon onions was calculated to be about 90%; the remaining 10% was nickel. The formation of the carbon onions depended on the size of the Ni catalyst. The formed carbon onions were not perfect spherical. The hollow core diameter was less than 5 nm [55].
2.4. Synthesis of carbon nanospheres
2.4.1. By catalytic CVD
The catalytic CVD method was used to synthesize carbon spheres with diameters of 400-200 nm. Transition metal salts (Co, Ni, Fe) were dissolved in DI water. Cobalt supported kaolin (hydrated aluminium silicate mineral) was used as a catalyst. Equal measures of cobalt and kaolin solution were made and stirred. The samples were filtered with size-100 mesh. The filtered slurry was coated on the surface of kaolin, or a ceramic plate as a thin film and was dried at about 60°C. The catalyst tube was placed in a quartz tube facing upsidedown in the center, and N2 was fed into the furnace at 100, 200 or 300 sccm. The temperature was set to 650°C, and C2H2 gas was fed into the chamber at 50 sccm. When the temperature was below 250°C, only N2 was allowed to flow inside the reaction chamber. The carbon spheres were collected under the catalyst plate [56].
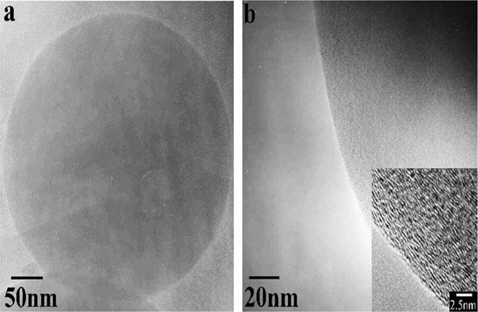
Synthesis can also be done using other transition metal salts. The yield of carbon spheres was about 1.5 times of the catalyst. The size of the carbon spheres was measured by SEM analysis and found to be around 600-800 nm. Initially a few CNTs were formed within the first 30 min of the reaction which was analyzed by TEM analysis. However, at the end of the reaction, no CNTs were observed. The HRTEM analysis showed (Fig. 26) that the solid carbon spheres were composed of uniform unclosed graphene layers which had open edges and spacing of about 0.33-0.35 nm. This is the same as the distance of separation between the crystal layers of graphene in graphite. Auger electron spectroscopy and energy dispersive X-ray spectroscopy (EDS) were carried out to check for the presence of other elements, and no other elements were found except carbon; hence, the carbon spheres were composed of pure carbon without any impurities. The Raman spectral analysis showed peaks at ~1590 and ~1360 cm-1 for carbon spheres in the size range of 1 μm-500 nm.
2.4.2. From hydrocarbon soot
The precursor used was diesel, kerosene, paraffin wax, carbon black and lubrication oil to produce carbon nanomaterial without using a catalyst. The precursor was placed in a simple lamp arrangement separately with a combustible cylinder cotton material arranged for each lamp. The lamp was lit and left for 24 h in open air. To collect the soot formed by the flame, flat ceramic tiles were placed above the flame. The collected soot was allowed to dry. Solid paraffin wax was available commercially as paraffin wax candles, which were allowed to burn in open air. The soot of paraffin wax was collected by a process similar to that described above using a flat ceramic tile. Carbon black was also used for characterization [57].
Raman scattering was measured at room temperature, and two peaks were observed at ~1355 and 1602 cm-1. FTIR analysis was performed, and a broadened peak was centred at 3442 cm-1, which represents the O-H stretching of the carboxylic acid group or adsorbed water. Other peaks at 2923 and 2846 cm-1 were absorbed which represents CH2 stretching. The occurence of C-H stretching is due to the presence of methyl, methylene and methane. For kerosene soot, no peaks were observed except that of graphitic carbon. XRD analysis of all the soot samples showed the presence of pure graphite. Distinct peaks were observed for all samples at ~25° and higher intensity and broader peaks at 42°.
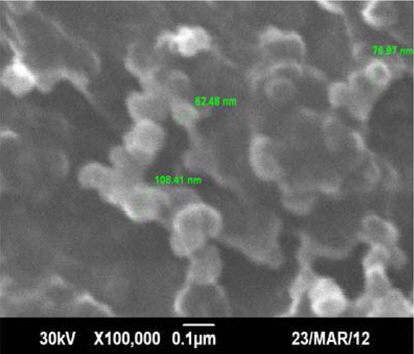
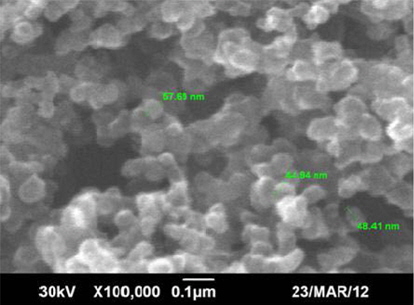
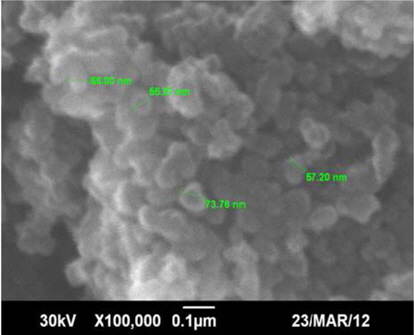
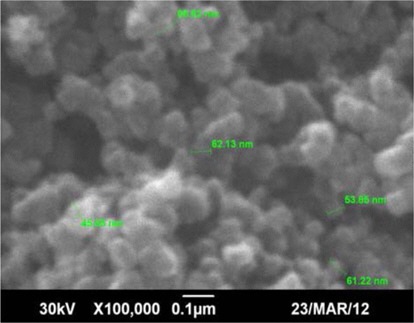
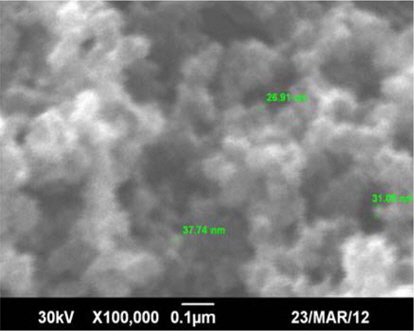
Under HRSEM the diameters of carbon spheres were observed to be 62.48-108.41 nm for kerosene. EDS analysis was carried out to check the weight percent of carbon and other elements, and it was about 99.21% of carbon and 0.79% of oxygen by weight, and no other impurities were found for kerosene. For diesel, the particle size was found to be in the range of 48-57 nm with 97.17% carbon and 2.83% oxygen by weight. For paraffin wax, the size of the nanoparticles was in the range of 80-95 nm with 96.31% carbon and 3.69% of oxygen. For lubrication soot, the particle size was in the range of 45-68 nm. EDS analysis measured the weight percent of carbon as 97.4% with 1.06% of oxygen and trace amount of Cu of about 1.53%. For carbon black, the particle size was in the range of 26-37 nm.
2.5. Synthesis of carbon quantum dots
2.5.1. Fluorescent carbon nanoparticles from candle soot
Fluorescent carbon nanoparticles (CNPs) were prepared from carbon soot which is obtained by combustion of candle. The obtained candle soot was then purified by a specific purification process using polyacrrylamide gel electrophoresis. Due to incomplete combustion, the CNPs produced are in the size range of 200-800 nm, and they very strongly bind with each other and agglomerate thus increasing the size to several micrometers. To break down the interaction and to produce well dispersed CNPs, oxidative acid treatment was used. This oxidative method is commonly used for the separation of CNTs [58]. This method is commonly used to introduce OH and CO2H groups to the surfaces of CNPs, which make the particles acquire negative charge by which the particles acquire a hydrophilic property. The soot was collected by placing a glass plate on top of the burning candles. The composition of the soot was carbon 91.69%, hydrogen 1.75%, nitrogen 0.12%, and oxygen 4.36%. Initially, the soot was hydrophobic and insoluble in some solvents. The soot was then subjected to heating with 5 M HNO3, and it turned into a homogeneous, black aqueous suspension. The suspension was then centrifuged, and a black precipitate was obtained as well as a light-brown supernatant. The supernatant, when examined under UV light, showed fluorescence at 312 nm. To obtain the maximum recovery, the precipitate and supernatant were neutralized and dialyzed against water. The neutralized soot exhibited excellent dispersion in water.
The above procedure failed to generate fluorescence in the visible region if an oxidant, such as HNO3, was lacking. A few other oxidants (30% H2O2/AcOH = 2:1) were tested, and the result was blue fluorescence. The oxidative function is predicted as follows: 1) to break the agglomerated carbon into small nanosized particles, 2) to make the carbon nanosized particles solubilise, and 3) to influence the fluorescence property of the soluble particles.
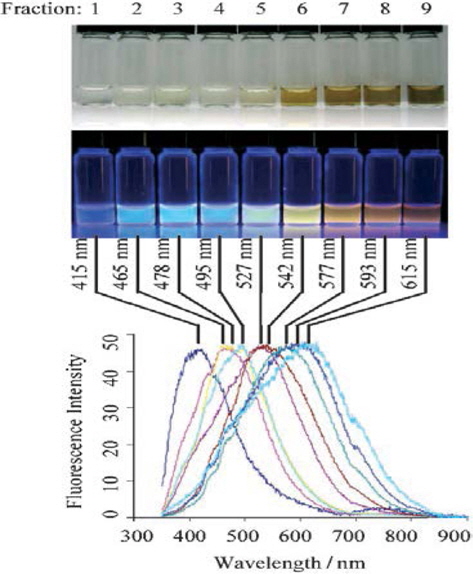
The soot was purified and characterised using various techniques, and the results may be summarised as follows. The elemental analysis showed a different ratio of carbon, hydrogen, nitrogen, and oxygen compared to the initial elemental analysis mentioned above. The percentages of carbon, hydrogen, nitrogen and oxygen were 36.79%, 5.91%, 9.59% and 44.66%. The FTIR analysis showed a peak at 1721 cm-1. Solid state 13C NMR showed peaks at 114, 138 and 174 ppm (terminal C=C bonds, internal C=C bonds and C=O bonds). Saturated sp3 carbons were not observed. The photoluminescence spectra analysis showed a broad colour range with an emission peak ranging from 415 (violet) to 615 nm (orange-red).
2.5.2. Green synthesis of carbon dots
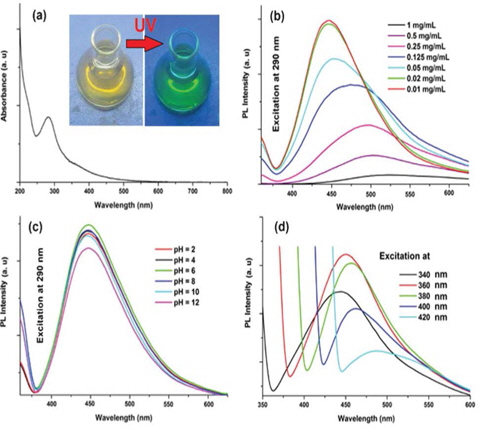
In the following method banana juice is used to produce fluorescent carbon dots. This is a very short and simple procedure. The end product is oxygenous carbon dots with a size of 3 nm that are obtained without using any surface passivation or oxidizing agent or inorganic salt. The synthesis of carbon dots started with heating the banana juice (banana 80 g, water 100 mL and turned into paste); 20 mL of the juice was taken which was pulp free. Then, 20 mL of ethanol was added to the juice and sealed and held at a constant temperature and pressure at 150°C for 4 h. The obtained dark brown solution was then cooled to room temperature. The dark brown solution was dissolved in 20 mL of water, and filtration was done to remove the residue. Then 50 mL of ethanol was added and centrifuged at 3000 rpm for 15 min. By centrifugation large particles were separated. The solvent was evaporated at room temperature under vacuum, and highly fluorescent carbon dots were obtained. The yield was about 600 mg [59].
The TEM images reveal that the carbon dots range in size from 1.5 nm to 4.5 nm. The FTIR spectrum analysis showed stretching peaks at 3492, 2935, 1730, 1625, 1422, 1264 and 918 cm-1 , representing -OH, -C-H, C=O, C-O-C, C-O and epoxy ring, respectively. The XRD pattern showed broad peaks at 21.1°, which represents the (002) peak. This indicates that the d-spacing between the interlayers is 0.42 nm, formawhich is wider than the graphitic interlayer spacing (0.33 nm). Thus, it is known that the carbon dots have poor crystalline nature. The absorbance was recorded by UV/Vis (Fig. 33) spectrometry, and the maximum value was obtained at 283 nm. The 1H NMR spectrum found regions 1-3 ppm for sp3 C-H protons, 3-6 ppm for protons that were attached with hydroxyl, ether and carbonyl groups; 6-8 ppm was observed for aromatic sp2 protons, and 8-10 ppm was observed for aldehydic protons. The 13C NMR spectrum found four regions at 20-80 ppm, which indicated carbon and carbons attached to hydroxyl groups, that is, 80-100 ppm for carbons attached to ether linkages, 100-120 ppm for C=C for sp2 protons and 175-190 ppm for C=O.
Recently many studies are being carried out to synthesize carbon dots using the green method because the green synthesis is very cost effective and obtains a good yield. The synthesis of carbon dots from bio-degradable waste helps in waste management. Here, a synthesis technique is described in which carbon dots were synthesized using Tarapa bispinosa (singhada in Hindi language).
T-bispinosa is an Indian water plant. The peel of the fruit is used to synthesize fluorescent carbon-dots. The carbon dots produced from T-bispinosa are water soluble.
Trapa bispinosa peel was soaked in cold water for 30 min. Then, 50 gm of peel was taken and crushed in 500 mL of distilled water. The solution was centrifuged to remove large particles. The solution was light pink in colour. From this solution 100 mL was taken for the synthesis of carbon-dots and heated at a temperature of 150°C for 2 h until the solution turned greenish brown. The solution was then centrifuged at 5000 rpm for 20 min and was suspended with 5 mL 1 N NaOH to solubilise and intensify the green fluorescence.
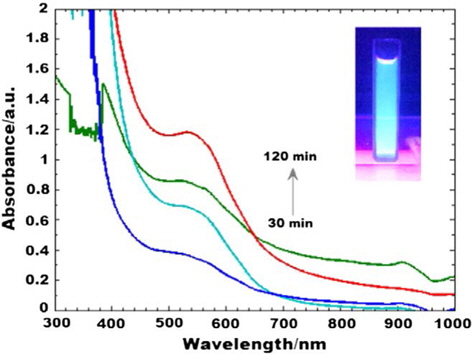
The characterization results were the following. For UV analysis the solution exhibited (Fig. 34) deep green fluorescence at 365 nm. The fluorescence was expected because of the recombination of electron-hole pairs from impurity atoms and oxygen functional groups [60]. The actual mechanism of multicoloured luminescence is still unclear. Samples characterized under UV-Vis spectroscopy at a time interval of 30 min show continuous red shift followed by blue shift after 120 min; this was done to explore the optical properties for biological application. Red shift was observed from 538 to 541 nm after 60 min, which indicates controlled formation of mono-disperse C-dots. Peaks at 536 and 907 nm were observed after 120 min, which indicates the stabilization of nanoparticles. HRTEM showed the presence of carbon dots that were spherical in shape, and their size ranged from 1 to 2 nm. XRD analysis showed an intense peak at 2θ = 43.3°, which is assigned to the (002) and (101) diffraction patterns of graphitic carbon. The Raman spectra showed a sharp and intense G-band peak at 1578 cm-1, and a D-band peak at 1331 cm-1. FTIR analysis showed the functional groups associated with the surface of the carbon dots; peaks were observed at 2925 cm-1 and 2860 cm-1. These peaks are assigned to -C-H and a weak absorption at 3394 cm-1, which corresponds to O-H stretching. An overtone observed at 1648 cm-1 is due to -C=C- stretching.
2.6. Synthesis of carbon nanofiber
2.6.1. Synthesis of carbon nanofiber by CVD method using nickel as catalyst
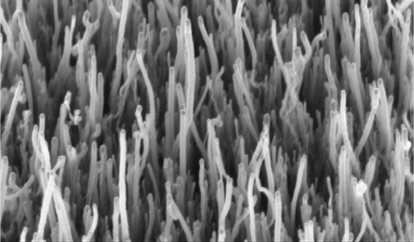
The following method has gained a lot of interest in industries for large-scale production of carbon nanofiber, as it uses low temperatures ranging from about 500°C to 1100°C. Initially an alumina plate was coated with nickel by the dip coating method. The plate was then placed in a horizontal quartz reactor of 1100 mm length and reduced with hydrogen at 600°C for 1 h. The plate surface turned metallic gray, indicating the formation of Ni. Different flow rates were maintained for C2H2, H2 and N2 gases at 30, 150 and 100 sccm. The reaction time was 30 min, and the plates were cooled down by passing nitrogen gas into the reaction chamber. The yield of carbon nanofiber was calculated by the ratio of mass gain to the area of the alumina plate [61].
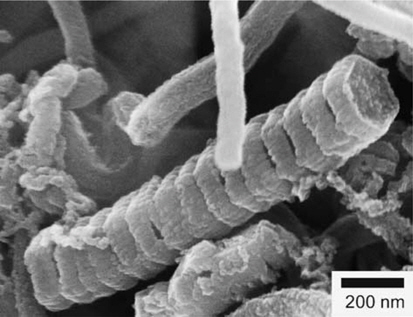
The carbon deposits were then characterized using HRTEM and field-emission SEM (FESEM). For HRTEM analysis, the carbon deposit was removed and dispersed in acetone, and the solution was ultrasonicated. Coil-like structures were observed (Fig. 35) with a size ranging from about 35 to 70 nm with an average diameter of 50 nm. FESEM observation showed (Fig. 36) a carbon nanofiber having a hexagonal ring arrangement.
2.6.2. Synthesis of carbon nanofiber using electrospinning technique
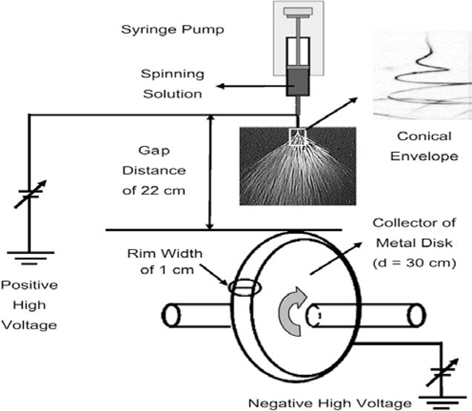
The electrospinning technique is one of the most commonly applied techniques for the synthesis of carbon nanofiber. The precursor used is polyacrylonitrile (PAN) with an average molecular weight MW = 150 000 g/mol and N,N-dimethylformamide (DMF) is used as a solvent. Firstly, PAN was dissolved in DMF to prepare a 10 wt% solution. To this solution 5% wt acetone and 0.01 wt% dodecylethyldimethyammonium bromide was added. Acetone dodecylethyldimethyammonium bromide was used to prevent the formation of beaded nanofibers and to get uniform-sized nanofibers. The experimental setup is shown in Fig. 37. The prepared solution was held in a syringe that had a stainless steel needle with a 0.55 mm orifice. A metal disk of 30 cm diameter and width of 1 cm was placed at a distance of 22 cm from the needle. A positive high voltage of 20 kV was applied to the needle, and a negative high voltage of -2 kV was applied to the metal disk. During the reaction, the temperature in the fume board was kept at room temperature, and the rotation of the metal disk was 1500 rpm by which the metal disk had a surface velocity of ~24 m/s, and the flow rate was maintained at 1.5 mL/h. The carbon nanofibers were collected by placing aluminium foil alongside the width of the metal disk, and the collected bundle of nanofibers was maintained at ~10 g/m2.
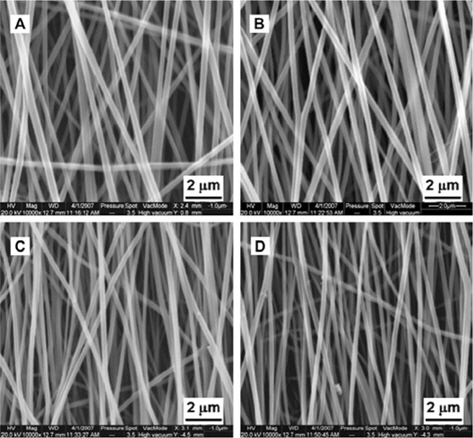
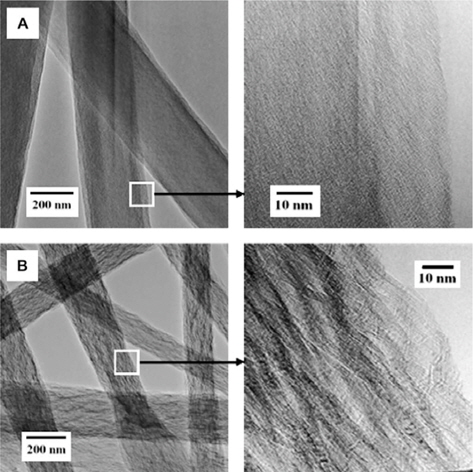
SEM analysis showed (Fig. 38) uniformity of the obtained electrospun carbon nanofibers with a low stabilization temperature (1000°C) and a high carbonization temperature (2000°C). The diameter of a single strand was found to be approximately 300 nm. TEM analysis showed (Fig. 39) that the 2200°C carbonized nanofibers were graphitic in nature and looked like stacked layers of graphene, whereas 1000°C carbonized nanofiber looked like crumpled or folded sheets of carbon atoms. XRD analysis was performed to detect the crystallinity of the carbon nanofibers, and it showed a strong diffraction peak centred at the 2θ angle of 16.8°, and a weak diffraction peak was observed at the 2θ angle of 28.6°. These two peaks represent the (100) and (110) planes. Raman spectroscopy analysis was carried out to investigate the D-band centred at ~1340 cm-1 wave number, which relates to turbostratic structures, and the G-band centred at ~1580 cm-1, which relates to the order of the graphitic structures. The D-band to the G-band relates to the amount of structurally ordered graphitic crystallites.
As the synthesis methods include several common factors to obtain most of the allotropes of carbon, the applications of the carbon-allotropes are common too. Mostly, the carbon allotropes are applicable in drug delivery (targeted drug delivery) systems. As the allotropes of carbon are bio-friendly, the application of these allotropes is most hopeful for drug delivery systems.
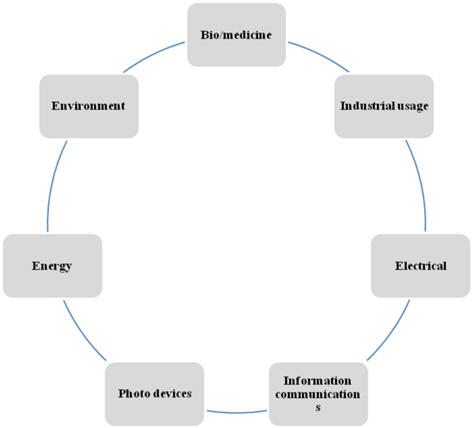
Apart from drug delivery, all of the allotropes have a wide range of possible applications from power to protection i.e. solar power to carbon fiber applications for strength. All the different applications of the carbon-allotropes are listed below by their type.
Not all nanomaterials are bio-compatible; the study of biocompatibility is called nanotoxicology. This measures the effects of nanomaterials on biological bodies. Nanotoxicology is a challenging avenue to obtain data about various materials and their toxic effects.
The following diagram represents the potential applications of carbon nanomaterials.
3.1.1. In energy conversion
Carbon nanomaterials are the building block in energy concversion devices [63] which includes C60, CNTs. These are deposited on an optically transparent glass electrode. Hence, they are excited by visible light.
3.1.2. In electrical applications
Carbon nanomaterials can be used in electrical application as they have high conductivity; therefore, losses like corona can be eliminated.
3.1.3. In electronics
Graphene has a very impressive nature, and it has a very wide range of applications, one of which is ultrahigh electron mobility of about 200 000 cm2V-1s-1 at electron densities of ~2×1011 cm-2 [64]. Recently, a high-frequency transistor which operates at 100-GHz has been developed using wafer-scale epitaxial grapheme [65]. A dye-sensitized solar cell based on graphene was recently reported [66].
Polymer-fullerene solar cells have been reported to show good efficiency of light conversion, and they are very cost effective and lighter in weight. The most effective solar cell is the bulk heterojunction solar cell [67]. A water soluble fullerene has been reported to have anti-HIV activity [68]. Some salts which are fullerene derivatives, such as K3C60, show superconductivity and a ferromagnetic property [69,70].
One of the major areas where CNTs are researched by application is the biomedical field and devices.
3.3.1. In drug delivery
For an efficient drug delivery system CNTs were used. By transporting and translocating the therapeutic molecules [71].
3.3.2. Biosensors
CNTs can be used as a vaccine delivery system, and they have been found successful by attaching few groups to the CNT [71,72]. SWCNTs-based biosensors have been used for the detection of biomolecules like streptavidin and IgG [73]. A MWCNT- based bio-sensor used to detect glucose was built in which platinum was used as transducer [74].
3.3.3. Electronics
SWCNTs and MWCNTs were separately fabricated onto field effect transistors (FETs) and their efficiencies were calculated [75]. CNT FET-based biosensors have also synthesized to detect proteins [76,77] and carbohydrates [78-80].
3.3.4. Other applications
CNTs are used in the storage of hydrogen at room temperature [81] and, hydrogen storage using single-wall CNTs is possible [82]. In heterogeneous catalysis applications, CNTs play a prominent role as they support noble metal catalyst by possessing good mechanical strength, large surface area, and good durability in harsh conditions [83]. Numerous studies have reported the application of CNTs in fuel cells and electro catalysis. This has resulted in power sources for electronic devices and vehicles [84].
CNTs can be used as a reinforce composite for application in sporting goods, such as tennis rackets, as they possess a high tensile strength of about 150 GPa [85].
There was a report on the application of carbon onions as energy storage devices, such as ultra-capacitors or super-capacitors; this is due to the high surface area of the carbon electrode [38].
Multiwalled carbon onions have been reported in biological applications when treated on skin showed more stress on the cellular functions cell growth and maintenance [86].
Surface passivated carbon dots have been used for bio-imaging without any toxic effect [87]. By the property of fluorescence quenching, detection of Cu2+ and Hg2+ ions has been possible by optical sensing [88,89]. Carbon dots were used in white light emitting devices, which can be used in liquid crystal displays and next-generation lightning systems [90].
Carbon spheres can be applied in fields ranging from nanoscale electronics to neuro-protective agents. Carbon spheres can be used together with tin as a high-performance anode material in lithium-ion batteries [91]. Carbon spheres are used as templates for the synthesis of other compounds [92,93].
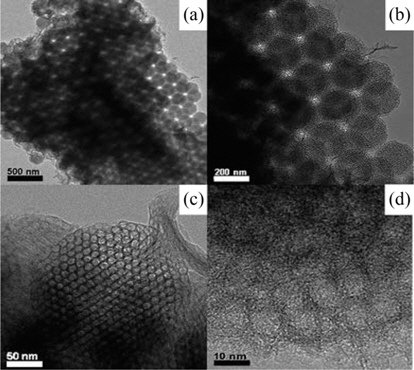
An array of mesoporous carbon spheres were synthesised using a template-based method, which were applicable in super-capacitors. The capacitance retention was 93% over 5000 cycles [44].
Surface-modified carbon spheres have the properties of superparamagnism and luminescence; they have been successfully tested for brain cells like the nucleus and it was non-cytotoxic; thus, it is a brain theranostic agent [94].
Among all the allotropes of carbon, carbon fiber has gained a lot of potential applications to date. Carbon fibers can be found in sports accessories. As it is found to be one of the strongest but lightest and most flexible materials, it has been used in automobiles (example, BMW i8 has been recently equipped with carbon fiber) [95] and most sports bicycles, golf clubs, and surf boards, as well as military protective goods, such as helmets, Kevlar, etc. Carbon fiber is also used as a composite reinforcing material and as micro-electrodes [96].
In the future it will not be a surprise to find most of the carbon allotropes in all the regular essential goods that people use in their day to day life. Equipment/products based on allotropes of carbon will help mankind in many ways, from power to protecIntertion. Not only in goods, they will occupy most of the market as well. Carbon has been a focus of research, and soon it will be globally recognized as a noble element. Generally, people think of carbon as a threat to the environment, and future generations will accept carbon nanomaterials as an “element of surprise.” Presently, only a few applications have successfully utilized carbon to the fullest extent. The day is not far off when all the present discoveries will hit the commercial market, and we will see aircrafts designed of carbon fiber, capacitors with high charge capacity. Mobile phones will be flexible and thin as paper, and we will be able to effectively cure all types of cancer and other diseases, and we will be able to add more nutrition for food.
This review article briefly introduced the allotropes of carbon, and it can be understood that allotropes of carbon can be synthesised from organic and inorganic materials. All the allotropes of carbon have similar synthesis techniques, and the materials used are quiet similar as well. Nanoscale carbon has the power to change the world in terms of technology, strength, and precision and to help mankind to touch new heights and new depths. Carbon-allotropes are the new face of technology. The synthesis methods have proven a successful achievement, but when it comes to the efficient application of carbon allotropes the results are not highly satisfactory because present technologies are a few steps behind what is needed for its perfect application.


![Carbon content in and on earth. Reprinted with permission from [1].](http://oak.go.kr/repository/journal/14945/HGTSB6_2014_v15n4_219_f001.jpg)
![Structures of all carbon allotropes. Reprinted with permission from [4].](http://oak.go.kr/repository/journal/14945/HGTSB6_2014_v15n4_219_f002.jpg)

![Graphene sheet with arrows indicating the formation of various types of carbon nanotubes. Reprinted with permission from [17].](http://oak.go.kr/repository/journal/14945/HGTSB6_2014_v15n4_219_f004.jpg)
![Types of single-walled carbon nanotubes. Reprinted with permission from [18].](http://oak.go.kr/repository/journal/14945/HGTSB6_2014_v15n4_219_f005.jpg)
![Difference between single-walled carbon nanotubes (SWCNTs) and multi-walled CNTs (MWCNTs). Reprinted with permission from [20].](http://oak.go.kr/repository/journal/14945/HGTSB6_2014_v15n4_219_f006.jpg)
![Extreme carbon nanotube. Reprinted with permission from [25].](http://oak.go.kr/repository/journal/14945/HGTSB6_2014_v15n4_219_f007.jpg)
![Torus carbon nanotube. Reprinted with permission from [28].](http://oak.go.kr/repository/journal/14945/HGTSB6_2014_v15n4_219_f008.jpg)
![A nanobud on a carbon nanotube. Reprinted with permission from [29].](http://oak.go.kr/repository/journal/14945/HGTSB6_2014_v15n4_219_f009.jpg)
![Peapod. Reprinted with permission from [32].](http://oak.go.kr/repository/journal/14945/HGTSB6_2014_v15n4_219_f010.jpg)
![Cup-stacked carbon nanotube. Reprinted with permission from [35].](http://oak.go.kr/repository/journal/14945/HGTSB6_2014_v15n4_219_f011.jpg)
![Carbon megatube. Reprinted with permission from [37].](http://oak.go.kr/repository/journal/14945/HGTSB6_2014_v15n4_219_f012.jpg)
![Various types of fullerenes. CNOs: carbon nano-onions. Reprinted with permission from [41].](http://oak.go.kr/repository/journal/14945/HGTSB6_2014_v15n4_219_f013.jpg)
![Carbon buckyball clusters. Reprinted with permission from [42].](http://oak.go.kr/repository/journal/14945/HGTSB6_2014_v15n4_219_f014.jpg)
![Transmission electron microscope (TEM) images of the 3Dordered MCSA, (a) view of the (111) plane, the scale bar is 500 nm; (b) view of the (111) plane, the scale bar is 200 nm; (c) one mesoporous carbon sphere, the scale bar is 50 nm; (d) high-resolution TEM of the local part of the mesoporous carbon sphere, the scale bar is 10 nm. Reprinted with permission from [44].](http://oak.go.kr/repository/journal/14945/HGTSB6_2014_v15n4_219_f015.jpg)
![Carbon nanofibers. Reprinted with permission from [45].](http://oak.go.kr/repository/journal/14945/HGTSB6_2014_v15n4_219_f016.jpg)
![Scanning electron microscope (SEM) images of the as-synthesized carbon filament materials by catalytic decomposition of CH4 over Fe-Mo/Al2O3: (a) low-magnification SEM image and (b) high-magnification SEM image. Reprinted with permission from [48].](http://oak.go.kr/repository/journal/14945/HGTSB6_2014_v15n4_219_f017.jpg)
![Transmission electron microscope (TEM) images of the assynthesized single-walled and double-walled carbon nanotubes (SWCNTs and DWCNTs): (a) high-resolution TEM (HRTEM) image of SWCNTs; (b) HRTEM image of SWCNTs. Reprinted with permission from [48].](http://oak.go.kr/repository/journal/14945/HGTSB6_2014_v15n4_219_f018.jpg)
![(a) High-magnification (b) scanning electron microscope image of water-soluble carbon nanotube from mustard soot. Reprinted with permission from [49].](http://oak.go.kr/repository/journal/14945/HGTSB6_2014_v15n4_219_f019.jpg)
![Transmission electron microscope images of branched carbon nanotubes with two (a and b), four (c) and six (d) branches or junctions, as indicated by black arrows. High-magnification images of catalyst particles with various shapes are shown in the insets of the corresponding figures. Reprinted with permission from [50].](http://oak.go.kr/repository/journal/14945/HGTSB6_2014_v15n4_219_f020.jpg)
![High-resolution transmission electron microscope image of one Y-junction carbon nanotube. Reprinted with permission from [50].](http://oak.go.kr/repository/journal/14945/HGTSB6_2014_v15n4_219_f021.jpg)
![Typical high-resolution transmission electron microscope image of multi-walled carbon nanotube with a cone-like end. Scale bar 4 nm. Reprinted with permission from [51].](http://oak.go.kr/repository/journal/14945/HGTSB6_2014_v15n4_219_f022.jpg)
![Carbon nanotube (CNT) yield vs. carbon content in coalderived carbon rods. Reprinted with permission from [51].](http://oak.go.kr/repository/journal/14945/HGTSB6_2014_v15n4_219_f023.jpg)
![(a) and (b) show transmission electron microscope examples of multiwall carbon nanotubes aggregated with graphite nanofragments and fullerene-like nanoforms. Reprinted with permission from [53].](http://oak.go.kr/repository/journal/14945/HGTSB6_2014_v15n4_219_f024.jpg)
![(a) Low-magnification micrograph showing the coexistence of small nanometric carbon onions and large graphitic structures (tubes and onions); (b) a typical region containing small graphitic ions; (c) detailed look at polyhedral and tubular graphitic structures formed by thermal annealing. Reprinted with permission from [54].](http://oak.go.kr/repository/journal/14945/HGTSB6_2014_v15n4_219_f025.jpg)
![High-resolution transmission electron microscope images of a carbon sphere. Reprinted with permission from [56].](http://oak.go.kr/repository/journal/14945/HGTSB6_2014_v15n4_219_f026.jpg)
![Scanning electron microscope and energy-dispersive X-ray spectroscopy analysis of soot obtained from the atmospheric combustion of kerosene. Reprinted with permission from [57].](http://oak.go.kr/repository/journal/14945/HGTSB6_2014_v15n4_219_f027.jpg)
![Scanning electron microscope and energy-dispersive X-ray spectroscopy analysis of soot obtained from the atmospheric combustion of diesel. Reprinted with permission from [57].](http://oak.go.kr/repository/journal/14945/HGTSB6_2014_v15n4_219_f028.jpg)
![Scanning electron microscope and energy-dispersive X-ray spectroscopy analysis of soot obtained from the atmospheric combustion of paraffin wax. Reprinted with permission from [57].](http://oak.go.kr/repository/journal/14945/HGTSB6_2014_v15n4_219_f029.jpg)
![Scanning electron microscope and energy-dispersive X-ray spectroscopy analysis of soot obtained from the atmospheric combustion of lubricant. Reprinted with permission from [57].](http://oak.go.kr/repository/journal/14945/HGTSB6_2014_v15n4_219_f030.jpg)
![Scanning electron microscope and energy-dispersive X-ray spectroscopy analysis of soot obtained from the atmospheric combustion of carbon black. Reprinted with permission from [57].](http://oak.go.kr/repository/journal/14945/HGTSB6_2014_v15n4_219_f031.jpg)
![Optical characterization of the purified carbon nanoparticles (CNPs). Optical images illuminated under white (top) and UV light (312 nm; center). Bottom: fluorescence emission spectra (excitation at 315 nm) of the corresponding CNP solutions. The maximum emission wavelengths are indicated above the spectra. Reprinted with permission from [58].](http://oak.go.kr/repository/journal/14945/HGTSB6_2014_v15n4_219_f032.jpg)
![Spectra of the carbon dots: (a) UV absorption, and PL with variation of (b) concentration, (c) pH and (d) excitation wavelength (340- 420 nm). Reprinted with permission from [59].](http://oak.go.kr/repository/journal/14945/HGTSB6_2014_v15n4_219_f033.jpg)
![UV-Vis spectroscopy of C-dots representing characteristic absorption between 450 and 650 nm. Inset shows intense green colour under UVlight (λex = 365 nm) of C-dots. Reprinted with permission from [60].](http://oak.go.kr/repository/journal/14945/HGTSB6_2014_v15n4_219_f034.jpg)
![Transmission electron microscope micrographs of carbon nanofibers synthesized at 550 C (A), 600 C (B) and 700 C (C), respectively. Reprinted with permission from [61].](http://oak.go.kr/repository/journal/14945/HGTSB6_2014_v15n4_219_f035.jpg)
![Field-emission scanning electron microscope micrographs of carbon nanofibers synthesized. Reprinted with permission from [61].](http://oak.go.kr/repository/journal/14945/HGTSB6_2014_v15n4_219_f036.jpg)
![Diagram of electrospinning technique. Reprinted with permission from [62].](http://oak.go.kr/repository/journal/14945/HGTSB6_2014_v15n4_219_f037.jpg)
![Scanning electron microscope image of electrospun carbon nanofibers. Reprinted with permission from [62].](http://oak.go.kr/repository/journal/14945/HGTSB6_2014_v15n4_219_f038.jpg)
![Transmission electron microscope images of electrospun carbon nanofibers. Reprinted with permission from [62].](http://oak.go.kr/repository/journal/14945/HGTSB6_2014_v15n4_219_f039.jpg)