Because they are highly adhesive to substrates and have good resistance to heat and chemicals, epoxy resins are widely used as matrices for composites. Recently, epoxy composites incorporating carbon nanotubes (CNTs) as a filler material have received a great deal of attention [1]. Due to their high strength, stiffness, aspect ratio, and thermal and electrical conductivity, CNTs are widely used as a filler material. In 2000, using an atomic force microscope (AFM) tip, Yu
Attractive forces between CNTs, such as van der Waal’s forces, make it difficult to disperse them as filler in matrices. Well-known effective dispersion methods are divided into three categories: mechanical, physical, and chemical [1,5]. Ultrasonic dispersing and highshear mixing are examples of commonly used mechanical dispersion methods. Physical methods involve the absorption and/or wrapping of polymers or surfactants onto the surface of the nanotubes, while chemical methods involve the covalent chemical bonding of polymer chains to the CNTs surfaces [1]. Using the chemical method, it’s possible to obtain better dispersion and resulting composite properties than with other methods, but it is a more time-consuming and expensive process than the other methods.
Many studies have been carried out with the goal of improving the mechanical properties of CNTs-reinforced epoxy composites. In 2004, Gojny
The linear coefficient of thermal expansion (CTE) was evaluated to investigate the thermal stability of hybrid composites in which carbon nanofibers and silicon dioxide particles were used as filler materials [13]. Lavorgna
The above literature review indicates that the mechanical dispersion of CNT filler is relatively less effective than chemical dispersion for enhancing the various properties of nanotubereinforced composites. However, the mechanical dispersion method has a number of advantages, including being a simple, inexpensive, and environmentally sustainable process. In the present work, MWCNT reinforced epoxy composites were fabricated using shear mixing and sonication. The concentrations of nanotube filler in the matrix were varied from 0 to 1.0 wt%. The mechanical, viscoelastic, thermal and electrical properties of the specimens fabricated with this simple mechanical dispersion process were measured and evaluated.
2.1. Materials and composite fabrication
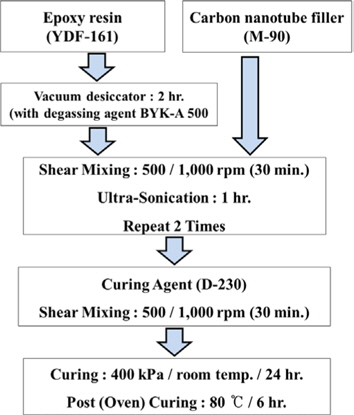
YDF-161 (Bisphenol-F type) epoxy resin purchased from Kukdo Chemical Co., Ltd. (Seoul, Korea) was chosen as the matrix. Based on the material data from the manufacturer, the viscosity and density of the epoxy resin were 5-7 Pa∙s and 1.17 g/cm3 at 25°C, respectively. Jeffamine D-230 manufactured by Huntsman International LLC was used as a curing agent for the epoxy resin. The viscosity and density of the hardener were about 9×10⁻³ Pa∙s and 0.948 g/cm3 at 25°C, respectively. Commercial grade MWCNT, M90, from Carbon Nano-material Technology Co., Ltd. (Pohang, Korea) was selected as the filler material to improve the various properties of the epoxy composite. The CNTs were used as received without any further purification. These CNTs had dimensions of 5-20 nm in diameter and about 10 μm in length, with an aspect ratio of more than 500. Composite samples were fabricated using YDF-161 resin along with the hardener at a weight ratio of 3:1. Before mixing with the nanotube filler, the air entrapped in the epoxy resin was released using a vacuum desiccator with an air release agent (BYK-A 500; BYK-Chemie GmbH) for two hours. The CNTs were then added to the resin in appropriate amounts to reach the desired loadings, and were then dispersed in the resin using a shear mixer (PDM-300 Paste mixer; Dae Wha Tech. Co., Ltd., Yongin, Korea) and an ultrasonic bath sonicator (WUC-A03H, 100 W peak out, 40 kHz frequency; Daihan Scientific Co., Seoul, Korea). After mixing with the filler, a curing agent was added and mixed with the epoxy resin using a paste mixer. When the mixing of epoxy resin with the filler and hardener was completed, the resin mixture was poured into silicone molds and cured at 400 kPa pressure and room temperature for one day. This was followed by post curing in an oven at 80°C for 6 h. The detailed fabrication process is shown in Fig. 1.
Specimens having different filler loadings were prepared from baseline (that is, neat epoxy) to 1.0 wt% filler content specimens with respect to the total weight of the resin and the hardener. 115 mm-long and more than 4 mm-thick dog-bone shaped specimens fabricated following the standard test method (ASTM D638-10) were used in the investigation of tensile strength and stiffness. Rectangular-shaped 35 mm (L) × 10 mm (W) specimens with 1.5 mm thickness were used in dynamicmechanical analysis (DMA) to measure the damping property of the specimens. Other rectangular specimens (45 mm [L] × 10 mm [W]) of 3 mm thickness were fabricated and used to determine the CTE. The thermal and electrical conductivities were measured using 25 mm-diameter circular specimens of 2 and 3 mm thickness.
In this study, a FE-SEM (S-4700; Hitachi Ltd., in Korea Basic Science Institute [KBSI] Jeonju Center, Jeonju, Korea) was used to qualitatively assess the dispersion of the nanotube filler in a matrix, using high and low magnified images. A tensile test, using a universal testing machine (RB 301 Unitech T; R&B Inc., Daejeon, Korea), was also used to quantitatively assess the filler dispersion from the values and deviations of the tensile strengths and stiffnesses. It is well known that mechanical properties such as the tensile strength of well-dispersed specimens usually have relatively small deviation. DMA (Q800; TA Instruments) were performed to determine the effect of the nanotube filler on the viscoelastic property of the composite with temperature. Both the storage and loss modulus were measured. The temperatures were varied from room temperature to 120°C. Tests were performed at a frequency of 1 Hz under the condition of a single cantilever at 3°C/min temperature increments.
The coefficients of thermal expansion of the specimens were calculated from measured thermal strain differences divided by temperature differences. The thermal strains were measured using strain gages (CEA-13-240UZ-120; Micro-measurements) and a strain indicator (P3; Micro-measurements) using a half bridge connection. Also, the temperatures of the specimens were measured using T-type thermocouples (TG-T-36-500; Omega Engineering, Inc.) and an A/D converter (34970A; Agilent Technologies). Another thermal property, the thermal conductivity, was measured using a thermal conductivity measurement system (ThermoCon M100; Hantech Co., Ltd., Gunpo, Korea) in accordance with the ASTM D5470 standard. The threshold and improvement of the electrical property of the nanotube-added composite specimens were investigated from the measurement of electrical conductivity (FPP-RS8[1G]; Dasol Engineering Co., Ltd., Cheongju, Korea).
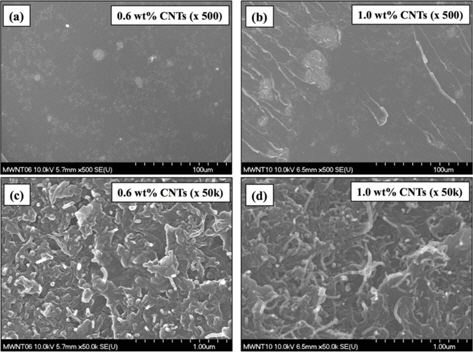
Excellent dispersion of the nanotube filler in the matrix is essential for improving several properties of the composites. To assess the filler dispersion in the epoxy matrix, the fracture surfaces of specimens cooled by liquid nitrogen were magnified, and are shown in Fig. 2. Fig. 2a and c show 500 and 50 000 times magnified fracture surface images, respectively, of the specimen containing 0.6 wt% CNT filler. The images on the right hand side (Fig. 2b and d) show the composite specimen having 1.0 wt% nanotube filler. It is difficult to determine the dispersion status in the two lower, highly magnified, images.
However, it is clear that the case of 0.6 wt% nanotube filler in Fig. 2a shows better dispersion than the case of 1.0 wt% filler content shown in the Fig. 2c. Fig. 2c shows more and larger agglomerates of CNTs than those in Fig. 2a. Although the results are restricted to the fabrication process used in this study, from this qualitative result we believe that the specimen with 1.0 wt% nanotubes has an excessive amount of nanotube filler.
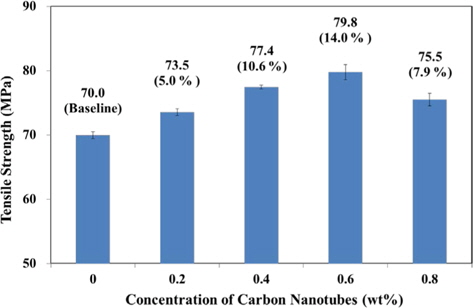
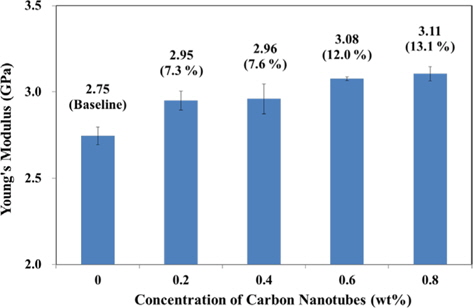
Figs. 3 and 4 show the tensile strength and stiffness of the composite specimens, respectively. More than 5 specimens were tested in each case, and the data were averaged. Data labels in both figures are the strengths and moduli. The values in parentheses indicate a percentile increment with respect to those of baseline specimens. In the case of specimens with 0.6 wt% CNTs, approximately 14% improvement in tensile strength is obtained with respect to the baseline, showing the highest tensile strength tested. The case of the 0.8 wt% CNTs specimens showed a lower strength than the case of the 0.6 wt% CNTs specimens, but was still higher than the baseline. As shown in Fig. 3, there are only relatively small deviations from the significant increments of strength, and it is believed that the fabrication process of this study is sufficiently reliable. In contrast to the tensile strengths shown in Fig. 3, the Young’s moduli shown in Fig. 4 demonstrate a tendency to increase from the baseline to the 0.8 wt% CNTs samples. The measured Young’s modulus of the 0.8 wt% CNTs specimens is 3.11 GPa, which is 13.1% higher than that of the baseline samples.
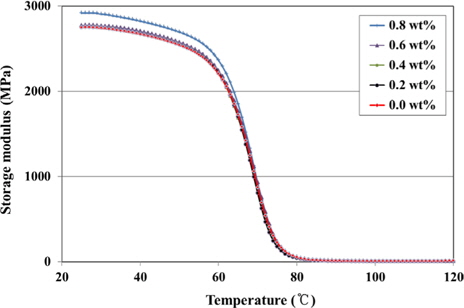
Figs. 5-8 show the results of the dynamic mechanical analyses. In the glassy plateau region shown in Fig. 5, it can clearly be seen that the 0.8 wt% CNTs sample shows the highest storage modulus, but the tendency among the other cases is not clear.
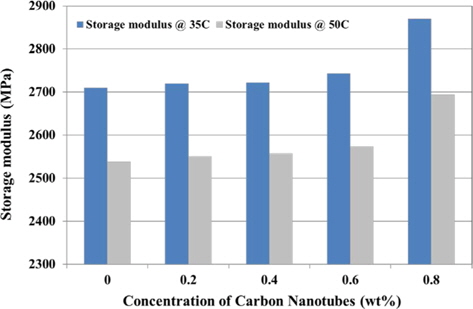
Therefore, the storage moduli of these cases at temperatures of 35°C and 50°C are plotted in Fig. 6.
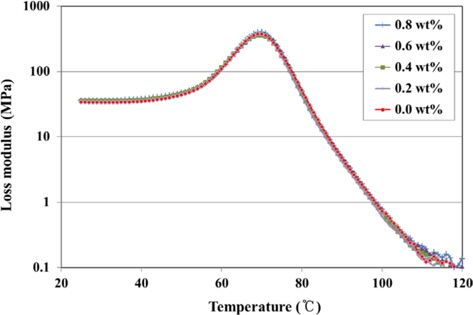
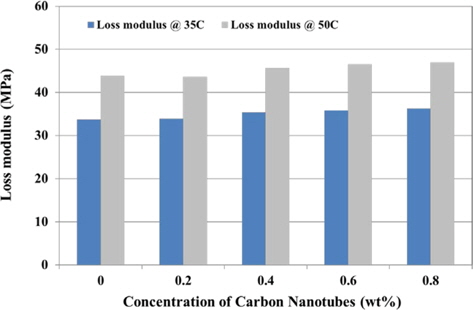
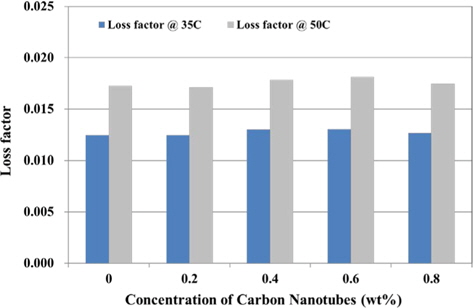
In this experiment, as the concentrations of CNTs filler in the composite specimens are increased, their storage moduli also tend to increase. Similar to Figs. 5 and 6, Figs. 7 and 8 show the loss moduli with temperature variation and the detailed moduli at temperatures of 35°C and 50°C, respectively. Although no tendency of loss modulus with respect to the filler concentration can be seen in Fig. 7, slight increments of the moduli with filler concentrations at the two temperatures are clearly seen in Fig. 8. The ratio of loss to storage moduli is called the loss factor or tangent delta and is an indicator of the viscoelasticity of a specimen. The loss factors of these specimens at temperatures of 35°C and 50°C are plotted in Fig. 9, but only the small increments are seen from the baseline to the 0.6 wt% CNT content specimens. These small differences of loss factors with respect to the CNT filler concentrations might be caused by the excessively small increments in the measurement of loss moduli from the baseline to the 0.6 wt% CNTs specimens, as seen in Fig. 8.
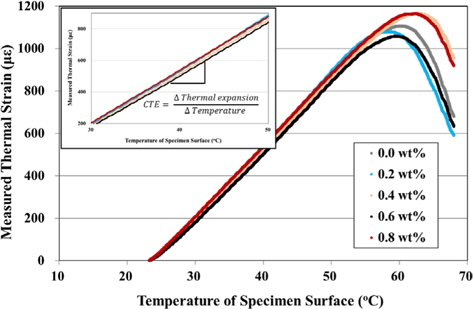
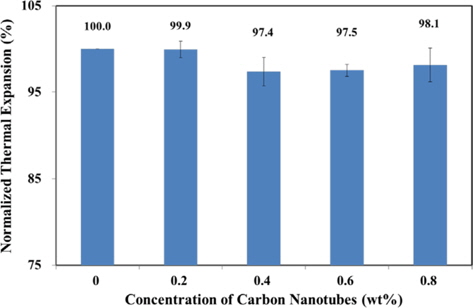
Thermal strains with temperature increases were measured and are plotted in Fig. 10. The temperature increment was 1°C per 3 min from room temperature to 67°C. The temperature of the specimens’ surface and the thermal strain were measured and stored at one second increments using a data logger and computer. From these raw data, linear sections were selected from 30°C to 50°C to calculate the coefficients of thermal expansion, as seen in the small figure in Fig. 10. Three groups of thermal strain measurements were performed and the CTEs were calculated. The CTEs were then averaged and normalized with respect to those of the baseline, as shown in Fig. 11. The specimens containing 0.4 and 0.6 wt% CNTs show lower thermal expansions than those of the other specimens. A thermal stability enhancement of only 2.6% was obtained. While the CNT filler may be helpful in strengthening the cross-link of the epoxy composite, the improved heat transfer of the specimen produced by the filler is detrimental to the thermal stability of the composite specimen. The competition between these positive and negative contributions to thermal stability might cause the small increase in thermal stability.
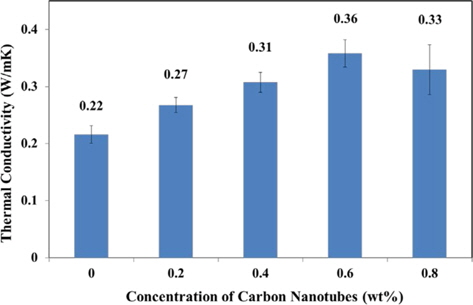
Thermal conductivity, another factor related to the thermal property of the composite, was measured and plotted, as shown in Fig. 12. The averaged thermal conductivities of the specimens with 0.2, 0.4, 0.6, and 0.8 wt% of CNTs filler were measured to be around 0.27, 0.31, 0.36, and 0.33 Wm-1K-1, respectively, while the conductivity of the baseline was measured to be 0.22 Wm-1K-1. Similar to the results for tensile strength, the 0.6 wt% CNTs specimens show higher thermal conductivity than that of the other specimens. An improvement of thermal conductivity of about 64% over that of the baseline was achieved with a nanotube filler of only 0.6 wt%.
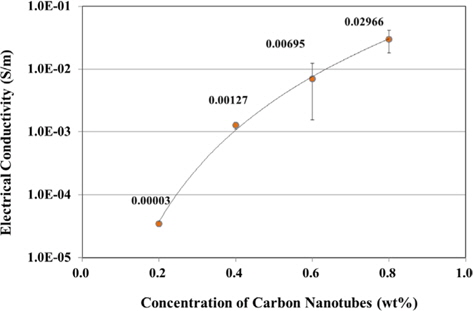
In contrast to thermal conductivity, the electrical conductivity increased consistently with the concentration of the nanotube filler, as shown in Fig. 13. The averaged electrical conductivities of the specimens with 0.2, 0.4, 0.6, and 0.8 wt% of CNTs filler were measured to be around 0.00003, 0.00127, 0.00695, and 0.02966 Sm-1, respectively. The threshold value of the nanotube filler content for the electrical conductivity appears to be lower than 0.2 wt%.
In this experiment, multi-walled-carbon-nanotube reinforced epoxy composites were fabricated using shear mixing and sonication. The concentrations of the nanotube filler in the matrix were varied from 0 to 1.0 wt%. The mechanical, viscoelastic, thermal, and electrical properties of the fabricated specimens were measured and evaluated. To confirm the nanotubes were well dispersed in the epoxy matrix, samples were investigated with electron microscope images and tensile tests. On the basis of the images and the measured tensile strengths, the specimens having a nanotube content of 0.6 wt% showed better dispersion and higher strength than those of the other specimens. The Young’s moduli of the specimens were increased as the content of nanotube filler in the matrix was increased. As the concentrations of the nanotubes filler in the composite specimens were increased, the storage and loss moduli also tended to increase. A higher thermal conductivity than that of the other specimens was measured for the specimen having 0.6 wt% nanotube filler content. In contrast, lower values of thermal expansion were measured for those having 0.4 and 0.6 wt% filler contents, as compared with other samples. The electrical conductivities also increased with the increasing content of nanotube filler. Based on the measured and evaluated properties of the composites, it is believed that the simple and efficient fabrication process for nanotube reinforced epoxy specimens proposed in this study was sufficient to obtain specimens with improved properties.

![Scanning electron microscopy images of the fracture surfaces of specimens for carbon nanotube (CNT) filler concentrations of 0.6 wt% ([a] and [c], images on the left hand side) and 1.0 wt% ([b] and [d], right hand side).](http://oak.go.kr/repository/journal/14875/HGTSB6_2014_v15n4_255_f002.jpg)