We examined chemical changes in oysters
최근 수산물이 웰빙식품으로 주목 받으면서 수산물에 대한 관심이 증가하고 있으며, 식습관의 변화로 단백질과 지방이 다량 함유된 식품 위주로 소비구조가 변화됨에 따라 고단백 식품인 수산물의 소비가 점차 증가할 것으로 예측된다(Kang and Kim, 2013). 수산물 소비 패턴과 식문화의 변화에 따라 가공기술 개발과 유통구조도 변화하고 있다. 특히, 최근에는 가공식품보다는 신선식품의 선호도가 높아지고 있어, 신선식품의 선도 유지와 안전성 확보기술 개발에 초점을 두고 있다.
굴(
우리나라에서 생산된 굴은 생굴(반각굴, 알굴)과 냉동굴, 건조굴, 젓갈, 통조림 등으로 판매된다. 그러나 최근 내수 유통물량이 증가되면서 내수를 목적으로 한 생굴 비중이 점차 증가하고 있다. 굴은 생산자가 껍질을 제거한 후에 산지 위판장에서 경매를 거친 후 생굴 상태로 시장이나 대형소매점으로 유통되거나 봉지굴 형태로 유통된다(Park et al., 2006). 굴은 식물플랑크톤 등 먹이생물 뿐만 아니라 인체에 유해한 세균이나 바이러스 등도 쉽게 축적할 수 있다(Potasman et al., 2002; Feldhusen, 2000; Cliver, 1997; Grimes, 1991). 그리고 다른 패류보다도 조직이 연하여 소화·분해되기 쉽고 가공, 유통 중 온도변화로 품질저하가 빨리 일어난다(Park et al., 2006). 따라서 굴의 위생학적 안전성을 확보하기 위하여 정부에서는 생산해역에 대한 위생관리를 하고 있으며, 생산자단체인 수협은 경매단계에서 pH와 관능평가 등의 방법을 이용하여 선도를 측정하여 신선하고 안전한 생굴이 국내에 유통되도록 하고 있다.
생굴의 선도에 대한 선행 연구로는 온도에 따른 참굴의 미생물, pH, 휘발성염기질소 함량 변화, 관능평가(Cao et al., 2009)와 오존, 키토산, 초고압, 박테리오신이 코팅된 항균성 플라스틱 필름의 처리로 생굴의 유통기한 연장에 관한 연구가 있다(Chen et al., 2014; Cao et al., 2009, Park et al., 2006; Kim et al., 2002, He et al, 2002).
따라서 본 연구에서는 현장에서 신속, 정확하게 생굴의 선도를 측정할 수 있는 기술을 개발하기 위하여 소포장 생굴의 저장온도에 따른 이화학적 성분 변화를 측정하고, 이들 성분간의 상관관계를 분석하여 생굴의 선도측정을 위한 기초자료로 활용하고자 하였다.
실험재료로 사용한 굴은 2014년 4월에 경상남도 통영시 해역에서 채취된 것이며, 채취된 굴은 껍질을 제거하여 경매 후 인근 가공공장에서 포장하였다. 이때, 포장된 총 용량은 362.26±8.38 g, 굴은 136.63±8.92 g과 충진수(해수와 담수를 일정비율 혼합물) 225.63±11.87 mL이었다. 충진수의 염분농도는 14.8 psu이었다. 포장된 굴은 항온기(PFC-PO-150, TAESHIN bio science, Korea)에서 각각 5, 10, 20℃ 의 일정한 온도에 저장하면서 1일 간격으로 실험을 진행하였다.
pH
pH분석시료는 굴과 증류수를 1:9 비율로 혼합하여 제조하였다. 분석시료와 충진수의 pH는 pH meter (Orion 3 star, Thermo Scientific Inc., Fort Collins, USA)로 측정하였다.
글리코겐 함량
글리코겐 함량은 시료 0.5 g에 30% KOH 5 mL를 첨가하여 95℃에서 20분간 중탕하고 포화 Na2SO4용액 0.5 mL와 ethanol 5 mL를 첨가하여 95℃에서 다시 15분간 중탕한 후 원심분리(1,259 g, 10 min) 하였다. 침전물에 2 mL 탈이온수와 2.5 mL ethanol 을 첨가하고 원심분리(1,259 g, 10 min) 후, 5 M HCl 2 mL넣고 완전히 녹인 다음 0.5 M NaOH로 중화하여 50 mL로 정용하여 시료액으로 사용하였다. 시료용액 5 mL에 0.2% anthron-sulfate solution을 10 mL를 가하고 95℃에서 10분간 중탕 후 냉각하여 분광광도계(UV mini-1240, Shimadzu, Tokyo, Japan)를 이용하여 620 nm에서 흡광도를 측정하였다(Click and Engin, 2005). 글리코겐 함량은 glucose를 표준물질로 작성한 정량곡선에 따라 측정하였으며, 글리코겐 전환계수 0.9를 곱하여 계산하였다.
탁도
충진수의 탁도는 휴대용 탁도계(2100P, HACH, Loveland, USA)를 사용하여 측정하였으며, 0-1,000 NTU (Nepheometric Turbidity Unit)로 나타내었다.
가용성단백질
충진수의 가용성 단백질 함량은 Biuret assay를 이용하여 측정하였다. 충진수 1 mL에 Biuret시약 4 mL를 넣고 혼합하여, 실온에서 30분간 방치한 후 분광광도계(UV mini-1240, Shimadzu, Japan)를 이용하여 540 nm에서 흡광도를 측정하였다(Robinson and Hodgen, 1940). 가용성단백질 함량은 bovin serum albumin를 표준단백질로 작성한 정량곡선에 따라 측정하였다.
일반세균수
굴과 충진수의 일반세균수는 Standard Methods for the Examination of Water and Wastewater (APHA, 1970)의 방법에 따라 Standard plate count agar (Difco)를 사용하여 35 ± 0.5℃에서 24-48시간 배양한 후, Colony Forming Unit (CFU)로 나타내었다.
통계처리
굴과 충진수의 이화학적 성분변화 결과에 대한 통계 처리는 SAS 프로그램을 이용하여 단순상관계수(Pearson’s correlation coefficient, r) 및 주성분 분석을 실시하였다(Steel and Torrie, 1960).
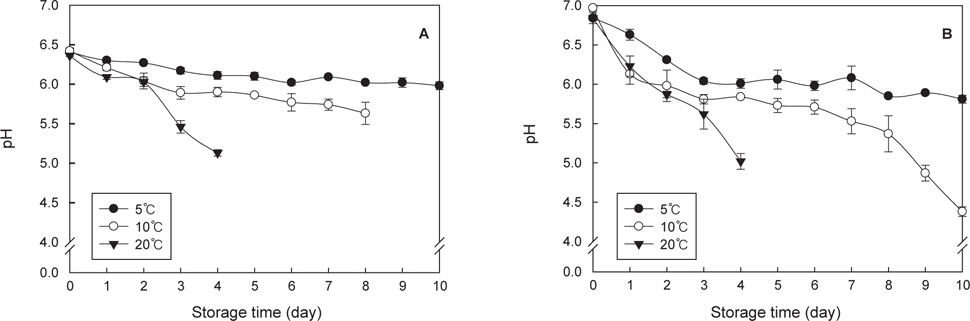
5℃에서 저장한 굴의 초기 pH는 6.41이었으나 10일 경과 후 5.98로 저하되었으며, 10℃ 에서 굴의 초기 pH는 6.42 이었으나 3일 경과 후 5.89이었다가 8일 경과 후 5.63까지 저하되었다. 20℃에서는 저장 초기에 pH 6.36이었으며, 4일 경과 후 5.13까지 저하되었다(Fig. 1A). 충진수의 초기 pH는 6.84-6.97로 굴의 pH에 비해 다소 높게 나타났다. 5℃에서는 10일 경과 후 5.81까지 감소하였고, 10℃에서는 8일 경과 후 5.37, 20℃ 에서는 4일 경과 후 5.02까지 감소하였다(Fig. 1B).
굴 저장시 pH 변화는 품질 변화를 알려주는 중요한 지표이다. 굴에 다량 함유하고 있는 glycogen은 해당과정(glycolysis)을 거치면서 lactate을 생성하고, 생성된 lactate에 의해 pH가 저하된다(Cao et al., 2009; Park et al., 2006). 일부 연구에서는 굴의 선도 판정지표로 pH를 이용하는데, 굴의 pH가 6.3이상이면 “Very good”, 6.2-5.9는 “good”, 5.8은 “off”, 5,7-5.5는 “musty”, 5.2이하는 “sour” 또는 “putrid”로 판정한다(Pottinger, 1948; Hunter and Linden, 1923). 굴과 충진수의 pH는 저장온도가 높아질수록 빠르게 저하되며, 굴보다는 충진수의 pH가 변화폭이 큰 것으로 나타났다. He et al. (2002)은 생굴을 2~4℃ 에서 16일 저장 후 pH 가 5.1까지 저하되는 것으로 보고하였으며, 저장온도에 의한 굴의 단백질 변성은 pH변화에 직접적인 영향을 주는 것으로 확인되었다.
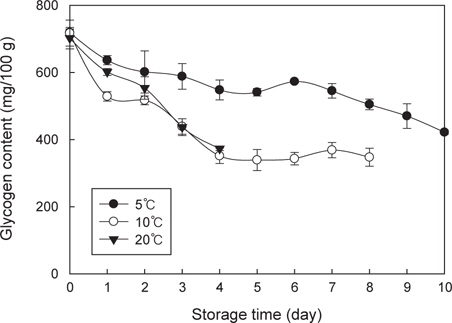
굴의 글리코겐 함량은 초기에는 702.51-718.87 mg/100 g이었으며, pH변화와 같이 저장기간 동안 지속적으로 감소하였다. 저장 초기에 5℃에서는 718.87 mg/100 g이었으나 저장 7일 경과 후 545.22 mg/100 g으로 감소하였다가 저장 10일 후 421.85 mg/100 g까지 감소하였다. 10℃에서는 5℃ 보다 빠르게 감소하여 저장 4일 후 351.49 mg/100 g으로 감소하였으며, 그 이후에는 서서히 감소하여 저장 8일에는 347.36 mg/100 g이었다. 20℃에서는 초기 702.51 mg/100 g이었으며, 10℃와 유사한 경향으로 저장 4일까지 감소하였다(Fig. 2). 굴의 종류에 따라 글리코겐 함량은 차이가 있으며, 채취시기에 따라서도 차이가 있다(Dridi et al., 2007; Krishnamoorthy et al., 1979; Willis et al., 1976). 따라서 초기 글리코겐 함량은 다소 차이가 있지만 저장 중 글리코겐 감소는 pH변화 등에 영향을 주는 것으로 사료된다.
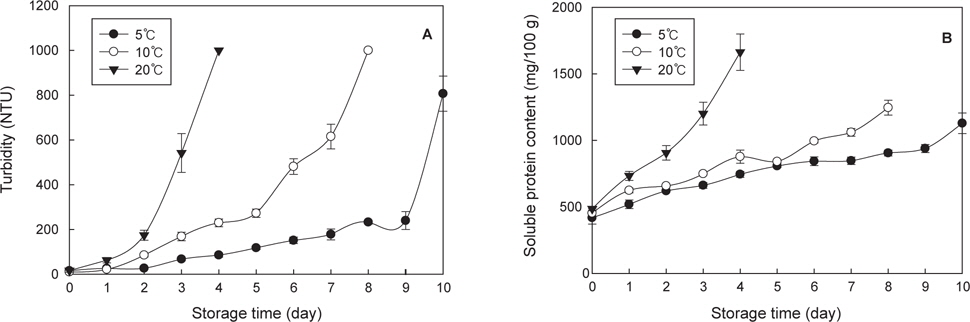
충진수의 탁도 변화는 저장온도에 따라 큰 차이가 있었다. 초기 탁도는 12.46-17.45 NTU의 범위이었다. 5℃에 저장시 탁도는 9일까지 239.5 NTU이었으며, 이후 급격하게 증가하였다. 10℃에 저장시 탁도는 5일 경과 후 272.58 NTU이었다가 이후 급격히 증가하여8일 이후에는 검출 최대 한계인 1,000 NTU를 초과하였다. 그리고 20℃ 저장시 탁도는 2일 경과 후 174.33 NTU이었으며, 이후에 급격하게 증가하여 4일에 검출 최대 한계를 초과하였다(Fig. 3A).
굴의 가용성단백질 함량은 5℃에서 1일째는 417.93 mg/100 g이었으나 저장기간 동안 지속적으로 증가하여 10일 후 1128.67 mg/100 g이었다(Fig. 3B). 10℃ 에서는 가용성단백질 함량이 453.82 mg/100 g이었으나 8일 후 1,245.76 mg/100 g로 증가하였다. 20℃ 에서는 초기값이 486.04 mg/100 g이었으나 5일 후에 1,663.38 mg/100 g까지 증가하였다. 굴의 선도가 저하될수록 굴 조직의 파편과 글리코겐 및 가용성단백질의 용출로 충진수의 탁도는 높아진다. 따라서 가용성단백질 함량의 증가와 글리코겐 함량의 감소는 충진수의 탁도에 영향을 주는 것으로 사료된다. 이러한 충진수의 탁도 증가는 저장 2~3일 이후부터 나타나기 때문에 유통시 관능적 기호도 저하에 따른 소비자 구매 감소에도 영향을 미칠 것으로 판단된다.
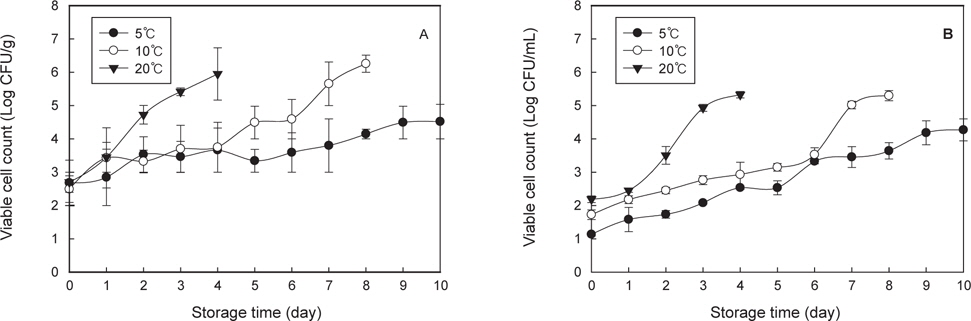
굴의 초기 세균수는 2.36-2.68 log CFU/g이었으며, 5℃에서 8일간 저장한 굴의 세균수는 4.0-4.34 log CFU/g로 증가하였다. 10℃에서 4일 이후에는 3.70-3.79 log CFU/g이었으며, 20℃에서 2일간 저장 후에는 3.45 log CFU/g로 증가하였다. 10℃와 20℃ 에 저장한 굴의 생균수는 각각 8일과 4일 경과 후에 6.25와 5.94 log CFU/g까지 상승하였다. 반면에 충진수의 세균수 변화는 초기에는 1.13-2.19 log CFU/mL이었으며, 5℃ 저장 10일까지 지속적으로 증가하여 4.26 log CFU/mL이었으며, 동시기 굴의 세균수 4.52 log CFU/g과 유사하였다. 10℃ 에서 저장된 굴의 충진수는 저장 8일에는 5.65 log CFU/mL로 증가하였으며, 20℃ 에서는 저장 1일 경과 후에 급격히 증가하여 저장 4일에는 5.94 log CFU/mL까지 증가하였다.
Park et al. (2006)은 초고압 처리한 굴의 저장 중 미생물 수의 변화에서는 무처리하여 10℃ 저장 중 세균수가 저장기간 동안 지속적으로 증가한다고 보고하였다. 그리고 동 온도에서 저장 8일에 8 log CFU/g까지 증가하였다고 보고하였으나, 본 연구에서는 6 log CFU/g까지 증가하여 다소 차이가 있었다.
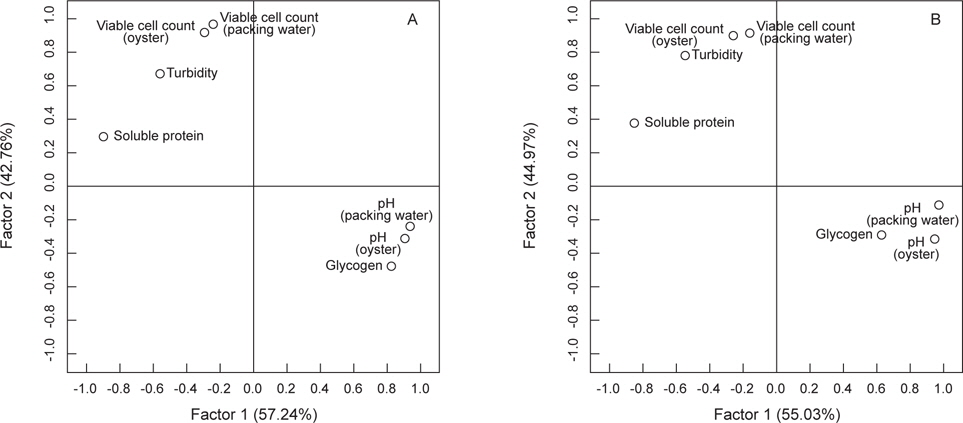
선도에 따른 pH, 글리코겐, 탁도, 가용성단백질, 일반 세균수에 대한 상관관계를 살펴본 결과, 저장기간에 따라 선도가 저하되면 굴과 충진수의 pH, 글리코겐 함량은 지속적으로 감소하며, 탁도와 가용성단백질 함량, 일반 세균수는 증가하게 된다(Table 1). 특히 충진수 pH는 5℃에서 저장한 굴 pH와 글리코겐 함량 변화에서 상관계수는 r=0.92, r=0.83 이었으며, 가용성단백질 함량과는 r=−0.82로 높은 상관성을 나타내었다. 반면 10℃ 저장 굴의 pH와 글리코겐 함량 변화와는 각각 r=0.92, r=0.51이었으며, 가용성단백질 함량과는 r=−0.74으로 높은 상관성을 나타내었다(Table 1). 그리고 탁도는 글리코겐 함량과 가용성단백질 함량과 상관성이 높았으며(r=-0.48~−0.73, r=0.71~0.83), 일반 세균수와도 상관성이 높았다(r=0.71~0.86). 따라서 굴의 선도변화에 관여하는 인자 중 pH, 글리코겐, 가용성단백질 함량은 선도변화와 가장 밀접한 관련이 있었다. 특히 주성분분석 결과, 5℃ 에서 생굴의 선도에 따른 제1주성분인 충진수의 pH와 굴의 pH 및 글리코겐 함량이 57.24% 설명이 가능하며, 제 2주성분인 기타 성분이 42.76% 설명 가능하였다. 10℃ 에서도 유사하여 제1주성분이 55.03%, 제2주성분이 44.97% 설명 가능하였다(Fig. 5). 따라서 굴의 선도는 충진수와 굴의 pH, 글리코겐 함량 변화로 판정할 수 있으며, 특히 가용성단백질 함량은 이들 성분과 가장 밀접한 관계를 가지는 것으로 확인되었다. 따라서 pH, 글리코겐, 가용성단백질 함량 변화는 굴의 선도 측정기술개발을 위한 품질 지표로서의 활용이 가능할 것이다.
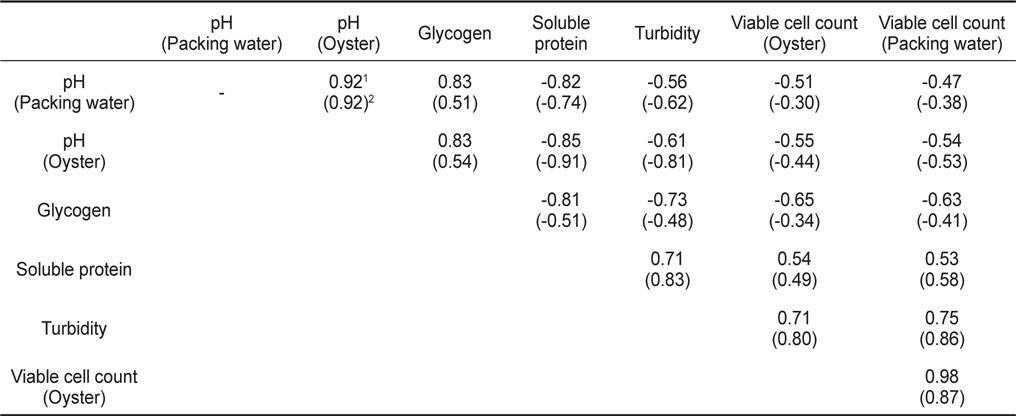
Correlation coefficients (r) for physicochemical of oyster Crassostrea gigas and packing water