Rechargeable lithium-ion (Li-ion) batteries have been used for numerous commercial applications, such as portable electronic devices and electric vehicles. However, the inherent limitations of Li-ion batteries (i.e., cost and performance factors) are becoming more obvious [1-3]. To overcome the capacity limit of the current graphite anodes used in Li-ion batteries, a number of high capacity materials based on lithium alloying processes have been developed [3-7]. However, such materials are not commercially viable due to several underlying issues associated with poor cycle life and low rate [5-8]. In this context, interest in soft carbons has been renewed because of their advantageous properties, including a high capacity and excellent rate capability [9-11].
In general, the capacities of soft carbons decrease as the carbonization temperature increases, which results in improved cycle performance [12,13]. However, when petroleum cokes used as carbon precursors are treated with phosphorus (P) compounds such as POCl3 and various phosphorus acids, the reversible capacities of soft carbons significantly increase, retaining excellent cycle performance [9-11]. It was suggested that during carbonization, phosphorus incorporated into the carbon lattice reacts with graphene edges to form C-O-P or C-P-O bonds, which create micropores that contain lithium [9-11]. However, the detailed mechanism for the extra-capacities of P-doped soft carbons has not been fully elucidated.
We found that the POCl3 doping material has a critical drawback with respect to industrial application, in that highly reactive HCl gas is generated during the carbonization process, leading to severe corrosion of the structural materials of the electric furnace. In this work, a series of phosphorus-doped soft carbons with different phosphorus contents were prepared by carbonizing petroleum cokes pretreated with hypophosphorous acid (H3PO2) which has advantages of low cost and high mass percent composition of P among phosphorus acids. In addition, the effects of phosphorus content and operating temperature on the electrochemical properties of P-doped soft carbons were extensively investigated.
Phosphorus-incorporated petroleum cokes (GS Energy, Korea) were prepared by simply mixing the cokes with a H3PO2 solution (50% in H2O; Sigma-Aldrich) for 10 h at room temperature. To prepare a series of soft carbons with different phosphorus contents, various mass ratios of petroleum cokes and phosphorus (i.e., 97.5:2.5, 92.5:7.5 and 90.0:10.0) were applied. The resulting materials were carbonized at 900℃ for 1 h. The prepared soft carbons were denoted as P-2.5, P-7.5 and P-10.0. For comparison, pristine soft carbons (P-0.0) were prepared by carbonizing pure petroleum coke at 900℃ without treatment with phosphorous acids. Note that the P-0.0 sample was re-examined and compared with the P-doped carbons in this work, even though physicochemical and electrochemical data for P-0.0 were reported previously [11]. The P content was examined by inductively coupled plasma-atomic emission spectroscopy (ICP-AES, Ultima 2; Horiba). X-ray diffraction (XRD) analysis was carried out with an X-ray diffractometer (Empyrean, PANalytical) to examine the structural changes in the soft carbons due to phosphorus incorporation.
The carbon electrodes were prepared by coating a composite slurry composed of soft carbons (90 wt%), carbon black (Super- P, 2 wt%), and polyvinylidene difluoride (PVDF, 8 wt%) on a copper substrate. The detailed process has been described in a previous paper [11]. The electrochemical performance of the carbon electrodes were evaluated with coin-type cells, which were assembled with a lithium metal counter electrode in an argon-filled glove box. 1.0 M LiPF6 dissolved in a mixture of ethylene carbonate/ethyl methyl carbonate (30/70, v/v, Panax Etec) with a 2 wt% vinylene carbonate additive was used as an electrolyte solution. The test cells were evaluated with cut-off voltages of 5 mV and 1.5 V vs. Li/Li+. Upon charging (lithium insertion), a constant current-constant voltage (CC-CV) mode with 0.02 C (1 C = 372 mA/g) cut-off current was used. Upon discharging (lithium deinsertion), a CC mode was used. The first two cycles, which are known as the formation step in this work, were tested at rates of 0.1 C. The cycling tests were conducted at 0.5 C starting in the third cycle, which was defined as the first cycle of the cycle tests. The rate capability tests were galvanostatically evaluated at the charge rates of 0.2 C and 5.0 C with the discharge rate of 0.2 C. In addition, the electrochemical behaviors of the soft carbons were investigated at 0.5 C in a wide temperature range from 25 to 50℃ after the formation step. For comparison purposes, the electrochemical performance of mesocarbon microbeads graphite was examined under the same conditions.
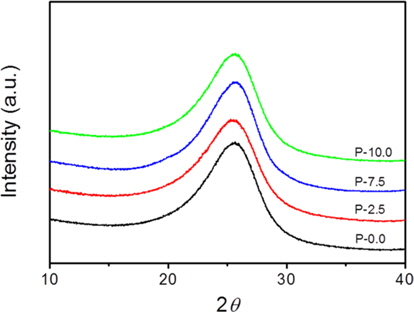
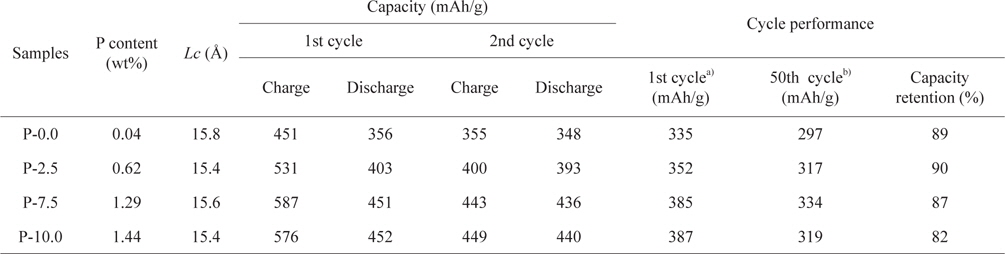
It was observed from the ICP-AES analysis that the P content in the soft carbons increased to 1.44 wt% as the mass ratio of phosphorus to petroleum cokes increased to 10.0:90.0 (Table 1). XRD patterns of the prepared carbons are shown in Fig. 1. All of the soft carbon samples exhibited broad (002) diffraction peaks near
Results of characterization and electrochemical performance tests of pristine and P-doped soft carbons
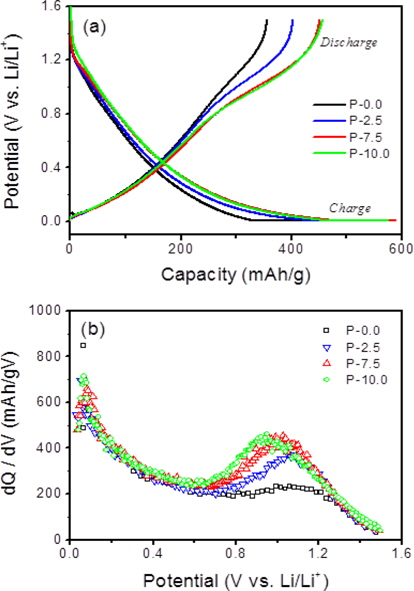
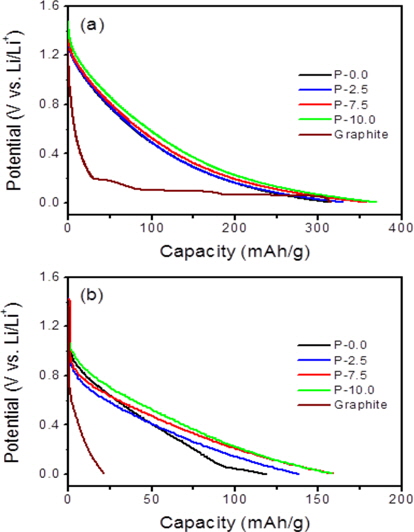
Fig. 3a shows the first charge (lithium insertion) and discharge (lithium deinsertion) curves for the soft carbons. The three P-doped carbons showed much higher discharge capacities (reversible capacities) compared to the pristine soft carbon (P-0.0) even though there were no appreciable changes in the crystallinity and morphology. Upon charging (lithium insertion), a large portion of the additional capacities were observed in the low potential range of 5 mV to 0.6 V vs. Li/Li+ (Fig. 3a). On the other hand, upon discharging, most of the additional capacities occurred in the high potential range of 0.6 to 1.3 V vs. Li/Li+, as shown in Fig. 3b. It has been reported that when phosphorus acids are thermally decomposed, phosphorus moieties interact with graphene edges to form C-O-P or C-P-O bonds near graphene edges, which create micropores between crystallite domains [11,14-17]. It is likely that the micropores may serve as a reservoir to store lithium in the form of lithium clusters, leading to the additional capacities.
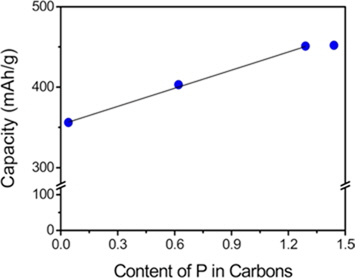
As shown in Fig. 4, the additional reversible capacities were proportional to the phosphorus content when it was below ~1.3 wt%. However, the linear relationship between the additional reversible capacities and the phosphorus content was not observed above ~1.3 wt%. It seems that excessive phosphorus moieties contained in the carbons do not contribute to the generation of micropores.
All the soft carbons exhibited excellent rate performance during charging at a high rate of 5 C with respect to that of graphite (Fig. 5). This feature is strongly related to the lithium intercalation mechanism, which depends on the structure of the carbons. Most lithium intercalation in graphite occurs below 0.3 V, while lithium intercalation in soft carbons starts near 1.2 V and a large portion of lithium is inserted with a sloping voltage profile, indicating that it is much easier for lithium to insert in soft carbons due to a broad interlayer distance, as compared with graphite. At high C rates, the overpotential due to mass transfer and charge transfer as well as
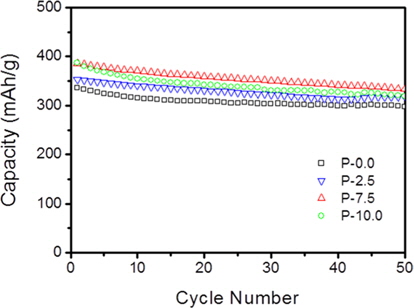
Fig. 6 shows the cycling performance of the prepared soft carbons at a current density of 0.5 C. Despite delivering higher capacities, the P-7.5 sample exhibited good capacity retention (87%) compared to that (89%) of undoped soft carbon (P-0.0) after 50 cycles. On the contrary, the P-10.0 sample showed relatively poor cycling properties compared to the other carbons. It is likely that this feature can be attributed to the irreversible reaction of phosphorus moieties which have not reacted with the graphene edge and remain intact within the carbon particles. The overall results indicate that when considering the electrochemical properties (i.e., reversible capacity, rate capability and cycle performance) in conjunction with cost, the optimal P-doped soft carbon in this work is the P-7.5 sample.
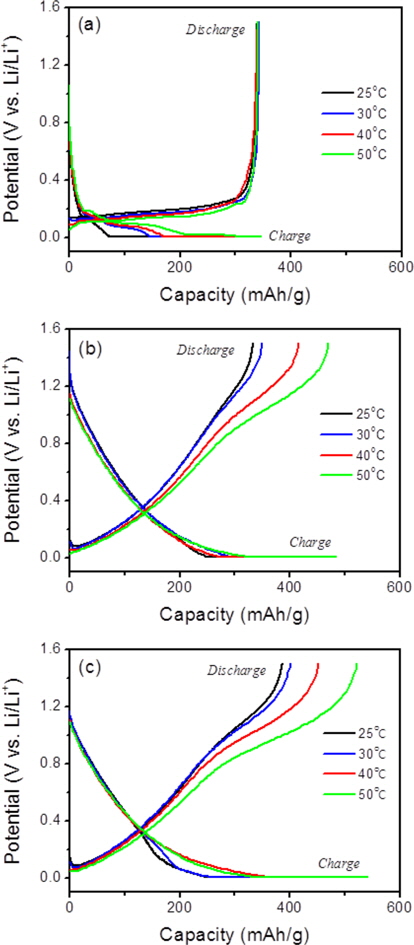
Fig. 7 shows the electrochemical behaviors of graphite and the prepared soft carbons at various temperatures. The discharge capacities of graphite were not sensitive to the operating temperature, except for the potential profiles. The lithium insertion potential increased with an increase of temperature, while the lithium deinsertion potential decreased, indicating that lithium ions are more easily inserted and removed at higher temperatures. In contrast, the discharge capacities of the soft carbons significantly increased as the operating temperature increased. The pristine soft carbon (P-0.0) and the P-doped soft carbons (P-7.5) exhibited huge discharge capacities of 470 and 522 mAh/g, respectively, at 50℃. An increase in capacities was observed in the high potential range of 0.6 to 1.3 V vs. Li/Li+, suggesting that more lithium ions may be confined in the micropores of the soft carbons. This feature may be due to better lithium ion mobility within the carbon particles at higher temperatures, which may allow the lithium ions to approach more of the micropores that exist between carbon crystallites.
A series of soft carbons with different phosphorus contents were successfully prepared by incorporating H3PO2 into petroleum cokes with various mass ratios of petroleum cokes and phosphorus, and then carbonizing the P-incorporated petroleum cokes at 900℃. As phosphorus content increased, the discharge capacities of the soft carbons substantially increased. Most of the additional capacities were observed in the high potential range of 0.6 to 1.3 V vs. Li/Li+. It is thought that the additional capacities of the P-doped soft carbons may arise from the formation of micropores, which may store lithium ions in the form of lithium clusters. In addition, the electrochemical performance of the soft carbons was investigated at high temperatures. Surprisingly, the discharge capacities of the pristine and P-doped soft carbons significantly increased with an increase in the operating temperature, unlike graphite material. This feature may be caused by better lithium ion mobility in the carbon structure at higher temperatures, which enables more micropores to serve as a reservoir for lithium ions.