Opportunistic networks (OPPNETs, also known as pocket switched networks) have become one of the emerging wireless communication techniques due to the appearance of smart mobile devices such as cell phones and tablets. OPPNETs enable mobile users to communicate with their social contacts [1]. However, the frequent disconnection and sparse density in OPPNETs cause virtually no complete paths to be found between the source and destination. Such a network falls into the category of mobile ad hoc networks (MANETs) and delay-tolerant networks (DTNs) [2].
In OPPNETs, nodes communicate in multiple hops and relay nodes forward messages to other nodes. Furthermore, forwarding does not work on-the-fly, because the relay nodes store the messages when no forwarding opportunity exists. A node should use any other node with connection opportunities to forward the messages [3]; this forwarding process is called a store, carry, and forwarding scheme.
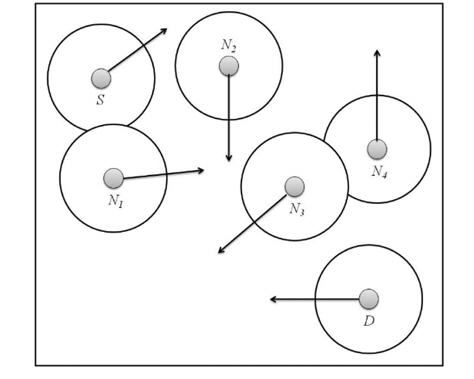
Fig. 1 illustrates an example of message forwarding in OPPNETs. The arrows indicate the moving directions of the nodes and the circles are their communication ranges. The source node S wants to send a message to the destination node
The problem of message forwarding is thus the selection of proper relay nodes to which the message (or duplicate of the message for a multi-copy scheme) should be sent [4].
The representative social-unaware scheme, Epidemic [5], shows the highest network traffic, since it duplicates messages to any nodes without social information.
On the other hand, the other social-unaware scheme, WAIT, has the longest transmission delay and the lowest network traffic, because it uses a single copy of the message and waits until the source node meets the destination.
Even if ProPHET [6] is a social-aware scheme, it also has higher network traffic, because it still spreads the message to the nodes with a higher delivery predictability. It is very difficult for these schemes to optimize the equilibrium between the network traffic and transmission delay. Thus, it is important to select proper relay nodes as the next hops and to use an appropriate number of copies of the message considering both the network traffic and transmission delay.
To resolve this problem, we propose a new forwarding scheme, called the direction entropy-based forwarding scheme (DEFS), in order to achieve equilibrium between the network traffic and transmission delay. People usually move around with different speeds, locations, and directions. If we give a message to people going to different locations to which we may not go ourselves, we have a better chance of delivering the message to the destination more quickly. To take advantage of this concept, DEFS uses the main direction and the direction entropy of a node. By the main direction of a node, we mean the direction that the nodes move with the highest frequency among the four cardinal directions. In DEFS, the direction entropy captures the certainty of the direction of a node. The lower the direction entropy a node has, the greater the certainty of direction it has; that is, the likelihood that the node moves in a certain direction. Since each node sends a message to another node with a different location and less direction entropy, DEFS utilizes those nodes that are more likely to travel to various locations to forward the messages to the destination node. For these reasons, DEFS selects the proper number of relay nodes during forwarding and, thus, it balances the network traffic and transmission delay quite well.
This paper is organized as follows. We first discuss related work in Section II. Section III introduces the proposed scheme in more detail. The simulation environment and experimental results are provided in Section IV. Finally, our conclusions are drawn and future work is discussed in Section V.
Opportunistic routing schemes can be classified into two categories: social-unaware and social-aware ones. Social-unaware schemes do not use the social information at all, whereas social-aware ones take advantage of the information about the nodes’ behaviors or social relations to make decisions about forwarding messages.
Routing schemes, such as Epidemic and Spray-and- Wait [7], can be considered as social-unaware routing schemes, as they do not need to any specific social information for routing. In Epidemic, a node duplicates the message to others whenever the node encounters other nodes. In Spray-and-Wait, a node sprays a fixed number
Various social-aware routing schemes have been proposed in OPPNETs [4, 6, 8-10]. SimBet [8] uses the locally determined social similarity and the betweenness centrality to the destination. When a node meets other nodes, it sends the message to the node that has a higher value computed with the similarity and betweenness centrality. Bubble rap [9] makes use of both the global and local centralities. Bubble rap sends a message to the destination or its community. However, when the destination belongs only to a community whose members have a low global centrality value, this scheme may fail to deliver the message. In this case, a relay node cannot be identified as the destination in the same local community. PRoPHET [6] estimates a probabilistic metric called the delivery predictability. When the nodes are near enough to the destination, they exchange the vector of the information on the messages and the delivery predictability vector. The information in the vector is used to determine which message should be sent. PeopleRank [10] uses the PageRank algorithm of Google for forwarding decisions. When the adjacent nodes meet in the social network, they exchange their current values of PeopleRank and the numbers of neighbors in the social network. In [4], an analytical model based on Markov processes for socialaware routing in OPPNETs was proposed.
The system used for the proposed scheme obeys the rules of typical data forwarding. Each node in a network has a unique identifier. The nodes in a network are denoted by
>
B. Estimate Information of Direction
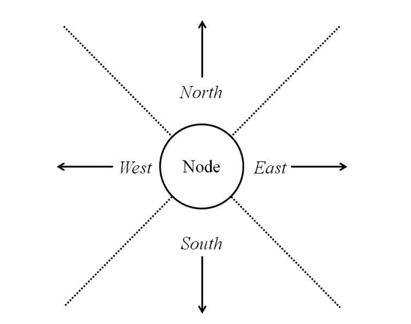
A source node is not aware of the current position of the destination node. Nodes move around with various directions. DEFS utilizes the information about the directions of the nodes. Each node accumulates its moving direction changes within a fixed angle for the four cardinal directions: north, south, west, and east. A fixed angle is a right angle, as illustrated in Fig. 2.
Each node determines the highest frequency of its moving direction changes for its main direction and also computes the entropy of the movement directions for certainty.
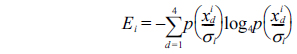
The direction entropy is based on the information entropy of information theory, in which the entropy is a measure of the uncertainty in a random variable [11]. The direction entropy is a numerical value, such that the smaller the value is, the more reliable it is; that is, a large value indicates less certainty.
The main direction of a node

In the equation above,
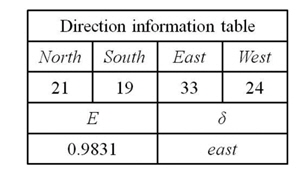
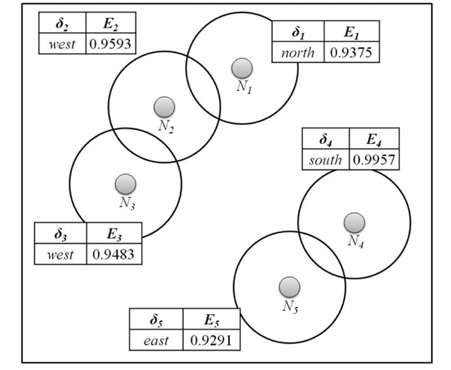
Fig. 3 shows an example of the direction information. The accumulated occurrences in each direction are recorded on the table. The direction of the maximum accumulated value is denoted as
x1 = 21/97 = 0.2165, x2 = 19/97 = 0.1959 x3 = 33/97 = 0.3402, x4 = 24/97 = 0.2474 log4x1 = -1.1038, log4x2 = -1.1760 log4x3 = -0.7778, log4x4 = -1.0074 E = -(x1log4x1 + x2log4x2 + x3log4x3 + x4log4x4 ) = 0.9831
Each node calculates its
In DEFS, a node
A message
Mi =
where
Fig. 4 shows an example of the forwarding decisions made in DEFS. We assume that the threshold
In this paper, we use the network simulator NS-2 v.2.35 [12] for the simulations. The number of nodes is set to 40. The network area is set to 450 m × 450 m and the communication range is 10 m. The movement of a node follows the HCMM [13] which is a frequently used moving pattern in OPPNET simulations. The velocity of a node ranges from 1 to 9 m/s, which is appropriate for pedestrians and vehicles. In our simulator, a mobile node issues a single message. The total simulation time is 9,600 seconds. The warm-up time for estimating the direction entropies is 600 seconds. After transmitting a message to other nodes, the originating node does not delete it. In addition, for the sake of simplicity, we do not consider the buffer size, bandwidth, or power. We run each scheme 20 times to calculate the average of the results. Table 1 shows the parameters used in our simulation. In this experiment, we evaluate three metrics: the delivery success ratio, the network traffic, and the delay time. The delivery success ratio is the ratio of the number of messages reaching the destination to the total number of messages generated. The network traffic is the number of packets sent and received between nodes. The delay time is the time period from the moment that a message is generated to the time at which it is delivered to the destination. Our simulation followed the hotspot [14].
[Table 1.] The parameters of the simulation
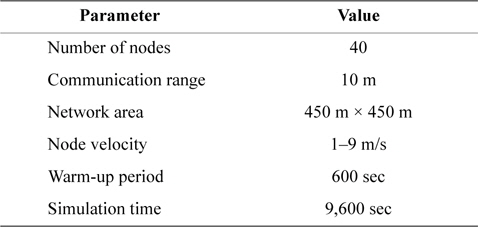
The parameters of the simulation
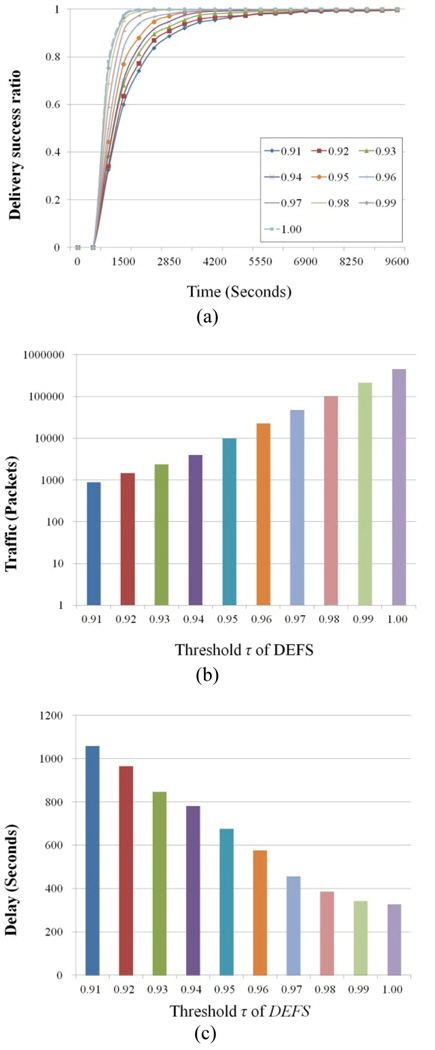
We examine the performance of DEFS at different values of the threshold,
Fig. 5(a) shows the variation of the delivery ratio as the simulation time increases. The delivery ratio increases with increasing threshold
As shown in Fig. 5(b), the y-axis is on the log-scale and the x-axis represents the threshold
On the other hand, in Fig. 5(c), as the threshold
Note that when
However, since DEFS allows forwarding to the nodes with direction entropies of less than
From the results in Fig. 5, we determined that the value of the threshold
>
C. Comparison between DEFS and Other Schemes
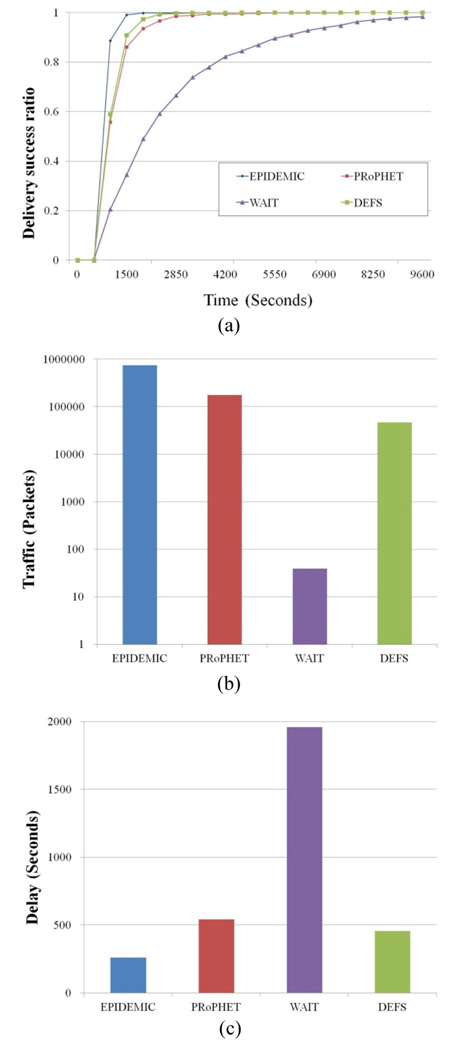
First, we evaluate the performance based on the simulation time for each of the three schemes: Epidemic, PRoPHET, and WAIT. We set the threshold
Therefore, WAIT requires a longer time to reach a delivery ratio of 1.0. In DEFS, the nodes basically forward the packets by flooding. Hence, DEFS is faster than the other schemes except for Epidemic.
Fig. 6(b) shows the results of the network traffic for the various schemes. Note that the y-axis of the figure is on the log-scale. DEFS exhibits much lower traffic than Epidemic and PRoPHET with 93.7% and 74.4% improvements, respectively. DEFS shows higher traffic than WAIT, because the nodes in WAIT forward the packets only when they meet the destination nodes.
The reason why DEFS shows such a reduction in traffic is that the relay nodes are suitably selected. Observe that those nodes with the same
Note that the traffic of WAIT is equivalent to the number of messages generated for the simulation. Fig. 6(c) compares the delay times of the schemes, showing almost a reverse trend compared to the network traffic results in Fig. 6(b). The average delay time of DEFS is about 198 seconds longer than that of Epidemic, while it is 84 seconds shorter than that of PRoPHET. In DEFS, relaying nodes with lower entropies move all around the network, resulting in faster delivery of the message, although a source node doesn’t know where the destination node is. The results of the experiments show that DEFS outperforms PRoPHET in terms of both the network traffic and delay.
In OPPNETs, the use of flooding-based schemes results in higher network traffic and lower transmission delays. On the other hand, the wait-based schemes suffer from unbearable transmission delays. In order to resolve this problem of imbalance between the traffic and delay, we proposed an effective forwarding scheme using the direction entropy and main direction, which capture the uncertainty in people’s mobility. As a future work, we plan to study more enhanced predictable forwarding schemes with the coordinates of the nodes in OPPNETs.