Inflammation in the central nervous system (CNS) is thought to play an important role in several pathways that lead to neuronal cell death, which in turn causes a number of neurodegenerative diseases1-5 such as Alzheimer’s disease (AD),6 Parkinson’s disease (PD),7 prion diseases, multiple sclerosis and HIV-associated dementia,1 narcolepsy, and autism.8,9 Inflammatory responses are mediated by the activation of microglia, the primary mechanism of innate immune defense in the CNS.2 Microglia arise from the monocyte/macrophage lineage and reside in the brain parenchyma. Activation of microglia is an important characteristic of brain pathology. Under some pathological conditions, microglia become activated, thereby governing inflammation-mediated neuronal damage.10 Microglia are normally activated in response to neuronal damage and remove damaged cells by phagocytosis. Activated microglial cells are amoeboid in shape and promote several signaling cascades that play significant roles in neurodegeneration. Chronically activated microglia are capable of producing a variety of proinflammatory mediators and potentially neurotoxic compounds.
The intracellular signaling mechanisms related to the effects of lipopolysaccharide (LPS), which constitutes the polysaccharide component of the cell walls of gramnegative bacteria, have been well studied in several types of cells including macrophages, microglia, and astrocytes.11-13 LPS activates the microglia and initiates the process of neuroinflammation. LPS has been known to activate several protein kinases, which in turn increase the levels of cellular phosphorylation in microglia. LPS is known to activate mitogen-activated protein kinases, nuclear factorkappa B (NF-κB), protein kinase C, and tyrosine kinases, which have been implicated in the release of immune-related cytotoxic factors such as arachidonic acid metabolites, reactive oxygen species (ROS), tumor necrosis factor-α (TNF-α), interleukin-1 (IL-1), nitric oxide (NO), and proinflammatory cytokines in several types of cells.11-13 Investigation on LPS activation of microglia in neurodegeneration is an expanding area of biomedical research that requires extensive use of animal models, because it could provide useful insights for understanding molecular mechanisms underlying microgliamediated neurodegenerative diseases. To facilitate many research programs and reduce the necessity of continuous cell preparations and animal experimentation, a microglialike cell line that reproduces the
In order to study a detailed mechanism of cellular signaling, omics technology has been developed for over twenty years. Recent studies15-17 of mouse microglia have been reported using omics technology. Most of these reports used proteomics method. They presented whole cell proteome15, membrane proteome,16 and glial secretome.17 They provided basic information of cellular components, mostly proteins in BV-2 cells and hints for understanding underlying mechanism of cellular signaling induced by various stimulus and processes such as phagocytosis, inflammation, and infection. Information of alteration of cellular proteins based upon inflammatory signaling in BV-2 cells could suggest much clearer molecular mechanism of neurodegenerative diseases. However, investigation on LPS activated microglia through omics approach has been done by only proteomics, and information relating to neurodegeneration in BV-2 cells produced by other omics approaches such as phosphoproteomics, lipidomics, and metabolomics is little. Other omics, especially phosphoproteomics could provide detailed mechanism of cellular kinases’ signaling underlying microglia-mediated neurodegeneration. Therefore, a study of LPS activated microglia through phosphoproteomic and lipidomic analysis is now highly demanding because understanding cellular kinases’ signaling is necessary for finding a biomedical therapy of neurodegenerative diseases.
Phosphatidylinositol (PI) is a negatively charged phospholipid and a minor component of cytosolic eukaryotic cell membranes. Phosphoinositides are phosphorylated derivatives of phosphatidylinositol and are known to have important regulatory roles in cell physiology, including lipid signaling, cell signaling, and membrane trafficking,18,19 secretion, adhesion, migration, cell survival, and replication.20-22 The inositol ring can be phosphorylated by a variety of kinases at the three, four, and five positions in seven possible combinations. The activation of microglia has been known to trigger several kinases’ signaling. It has previously been shown that type I phosphatidylinositol 4-phosphate 5-kinase α (PIP5Kα) and its lipid product, phosphatidylinositol 4,5-bisphosphate (PI[4,5]P2), are enhanced,23 and phosphoinositide 3-kinase gamma (PI3Kγ) expression is upregulated in activated microglia.24 Investigation on changing of cellular phosphoinositides in LPS activated microglia through lipidomics approach could provide molecular understanding of cellular changing of lipid components, and of certain cellular kinase signaling in microgliamediated neurodegenerative diseases. Therefore, we could expand understanding cellular kinases’ signaling in microglia-mediated neurodegeneration through combined investigation of phosphoproteomics and phosphoinositide lipidomics on LPS activated microglia cell line.
In this study, we firstly performed phosphoproteomics analysis and phosphoinositide lipidomics analysis with LPS activated microglia to compare phosphorylation patterns in active and inactive microglia and to detect the pattern of changes in phosphoinositide regulation upon activation of microglia. We looked into the difference of cellular signaling between control and LPS activated microglia with this detection of changes of the phosphorylation pattern and the molecular phosphoinositide species. This investigation could provide better understanding molecular mechanisms underlying microglia-mediated neurodegenerative diseases.
Dithiothreitol (DTT), LPS, urea, iodoacetamide, phosphatase inhibitor cocktail, and ammonium bicarbonate were obtained from Sigma-Aldrich (St. Louis, MO, USA). Sequencing grade modified trypsin, porcine was purchased from Promega (Madison, WI, USA). HPLC grade water and acetonitrile were supplied from Burdick & Jackson (Muskegon, MI, USA). Formic acid, LC/MS grade was purchased from Fisher Scientific (Seoul, Korea). PepcleanTM C18 spin column and Ga-IDA phosphopeptide enrichment kit were obtained from Thermo Scientific (Seoul, Korea). The murine BV-2 cell line was kindly donated by the Genomics Lab in Konkuk University (Chungju, Korea). Dulbecco’s modified Eagle’s medium (DMEM), trypsin-EDTA, fetal bovine serum, and penicillin-streptomycin were obtained from PAA Laboratories, Inc. (Ontario, Canada).
>
Cell culture and LPS activation
BV-2 cells were cultured in a 10-cm cell culture dish with DMEM containing 10% fetal bovine serum and 1% penicillin-streptomycin and maintained at 37℃ in a humidified atmosphere with 5% CO2. Confluent cultures were passaged by trypsinization, and cells were seeded into a 10-cm culture dish (2×10⁶ cells/well). Cells were treated with LPS (100 ng/mL) or a control buffer and incubated for 1 h. After incubation, cells were trypsinized, washed with PBS, and pelleted by centrifugation.
>
Sample preparation for phosphoproteomics analysis
A 10 cm culture dish of BV-2 cells was collected by centrifugation at 500 g for 5 min, washed with phosphate buffered saline (PBS). After 30 min incubation at -80℃, the cells were lysed in RIPA buffer (50 mM Tris-HCl, pH 7.5, 150 mM NaCl, 0.1% sodium dodecyl sulfate, 0.5% sodium deoxycholate, 1% NP-40) supplemented with protease inhibitor and phosphatase inhibitor cocktail 1 & 2 (Sigma Aldrich Korea), and then vortexed for 15 min, and cell lysates were centrifuged at 14,000 x g for 10 min to remove insoluble material. Protein concentration was determined by BCA assay. In-solution digestion with the same amount of protein from LPS-activated BV-2 cell and control BV-2 cell, was performed as previously described in the modified filter-aided sample preparation (FASP) protocol.25 Aliquots of lysates corresponding to 2×10⁵ HeLa cells (0.13 mg of protein) were mixed with 200 ìl of 8 M urea in Microcon devices YM-10 or YM-3 (Millipore). The device was centrifuged at 14,000 g at 20℃ for 40 min. The concentrate was diluted with 200 μL of 8 M urea in 0.1 M Tris-HCl, pH 8.5 and the device was centrifuged. Subsequently, 100 μL of 0.05 M iodoacetamide in 8 M urea in 0.1 M Tris-HCl, pH 8.5 were added to the concentrate followed by centrifugation. The resulting concentrate was diluted with 100 μL of 8 M urea in 0.1 M Tris-HCl, pH 7.9 and concentrated again. This step was repeated 2 times, and the concentrate was subjected to proteolytic digestion. The 120 μL of 0.05 M NH4HCO3 solution with trypsin was added into the concentrate and incubated at room temperature for 4 hrs. A ratio of sample:sequencing grademodified trypsin (100:1) was used to obtain digested peptides. Trypsin-digested peptides were phosphoenriched using a Pierce® Ga-IDA Phosphopeptide Enrichment Kit according to the recommended protocol. Enriched phosphopeptides were desalted to remove detergent and other contaminants with a PepcleanTM C18 spin column according to the supplier-provided protocol.
>
Phosphopeptide analysis by nanoLC-ESI-MS/MS and database search
The enriched phosphopeptides were analyzed using an LTQ mass spectrometer (Thermo Finnigan, San Jose, CA, USA) coupled with a NanoLC-Ultra system (Eksigent Technologies, CA, USA). The phosphopeptides were applied to the analytical column (75 μm × 10 cm; Homemade) packed with C18 spherical particles (5 ìm) in the presence of solvent A (0.1% formic acid in HPLC water). Samples were resolved using a linear gradient of solvent B (100% acetonitrile, 0.1% formic acid; 5-60% over 60 min, 60-90% over 10 min; flow rate 0.2 μL/min). The separated peptide ions eluted from the analytical column were injected into the mass spectrometer with an electrospray voltage of 1.9 kV. All MS/MS spectra were acquired in data-dependent mode for fragmentation of the five most abundant peaks from the full MS scan with normalized collision energy set to 35%.
The acquired MS/MS spectra were searched against the Mouse IPI protein database (IPI-MOUSE v3.83) by using the Turbo-SEQUEST algorithm (Thermo Finnigan, San Jose, CA, USA) with the following search parameters: precursor and fragment ion mass tolerances of ±2 and ±1 Th, respectively; two miscleavage sites; +16 Da for methionine residues (oxidation); +57 Da for cysteine residues (carbamidomethylation); and +80 Da for serine, threonine, and tyrosine residues (phosphorylation) as variable modifications. After computation of the search, MS/MS-based peptide and protein identifications were validated using Scaffold 3 (Proteome Software, Portland, OR, USA), which is based on probability thresholds. We obtained a list of peptides that were identified with greater than 95% confidence by the Peptide Prophet algorithm.26 To further increase the search stringency, the Protein Prophet algorithm was used to obtain protein identifications with greater than 99% confidence and at least two unique peptides identified. Identified phosphoproteins were categorized according to the DAVID Bioinformatics Resources 6.7 Database (http://david.abcc.ncifcg.gov/).
>
Phosphatidylinositol extraction for lipidomics analysis
Phosphatidylinositol was extracted as described previously.18,19 Briefly, ice-cold 1:1 CHCl3/CH3OH (400 μL) was added to each cell pellet and vortexed for 1 min or until thoroughly mixed. Samples were centrifuged at 9,000 rpm for 5 min at 4℃, and the supernatant was decanted. To the remainder of the cell pellet, 200 μL of 2:1 CHCl3/CH3OH containing 0.25% 12 N HCl was added. Samples were vortexed for 5 min and then pulse spun. The supernatant was combined with 40 μL of 1N HCl and vortexed for 15 s. Samples were centrifuged to separate the phases, the lower layer was collected, the solvent was evaporated in a vacuum centrifuge, and the product was stored at -20℃.
>
Mass spectrometry analysis of phosphoinositide extracts
Mass spectrometry analysis was performed on a SYNAPT G2 High Definition mass spectrometer (Waters Corporation, MA, USA). The instrument was equipped with an electrospray source. The samples were analyzed in negative ionization mode over the range of m/z 400-1,200. The peaks of phosphoinositides based on their mass and pattern of fragmentation were identified by traditional full scan or precursor ion scan (m/z 481) techniques, and quantitated with an internal standard (PtdIns-(3,4,5)-P3 (1,2-dipalmitoyl)-d62 (sodium salt) (Cayman Chemical, Ann Arbor, USA)).18,19
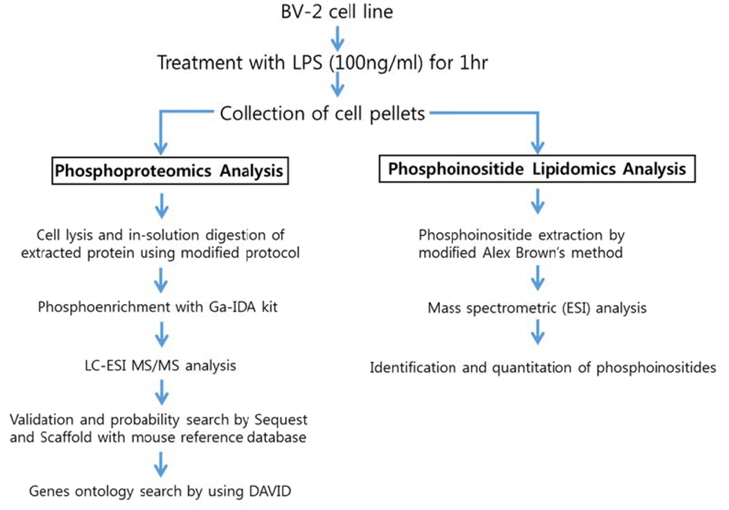
Experimental scheme of phosphoproteomic and phosphoinositide lipidomic analysis of BV-2 cell line is in Figure 1. We followed the established experimental procedures for cell lysis, in-solution digestion and phosphoinositide extraction, which were applied for phosphoproteomic and lipidomic analysis in other cell line. We used Tris-HCl based RIPA buffer instead of phosphate based buffer because we were trying to enrich phosphopeptides. The FASP protocol was applied for insolution digestion of extracted proteins because it is well established. We tested several phosphopeptide enrichment kits, such as TiO2 based kit, Ga-imidodiacetic acid (IDA) based kit, Fe-nitriloacetic acid (NTA) based kit. Among them, GA-IDA enrichment kit produced relatively higher number of phosphopeptides and reproducible results (data not shown).
For lipidomics analysis, we extracted phosphoinositides from BV-2 cell line according to modified Alex Brown’s method. In order to confirm if phosphoinositides are extracted in a proper way, we checked recovery amount of phosphoinositide with a standard (PtdIns-(3)-P (1,2-dipalmitoyl) (ammonium salt), 50 pmol) through extraction process of this experiment. We found that more 95% of the standard was recovered through comparing the intensity of it in a mass spectrum before extraction and after extraction (data not shown). The analytic conditions of mass spectrometry for phosphoproteomic and lipidomic analysis were based on general protocols. We performed triplicate experiments for phosphoproteomic and phosphoinositide lipidomics analysis based on the experimental scheme. The representative data were given from the triplicate experiments herein.
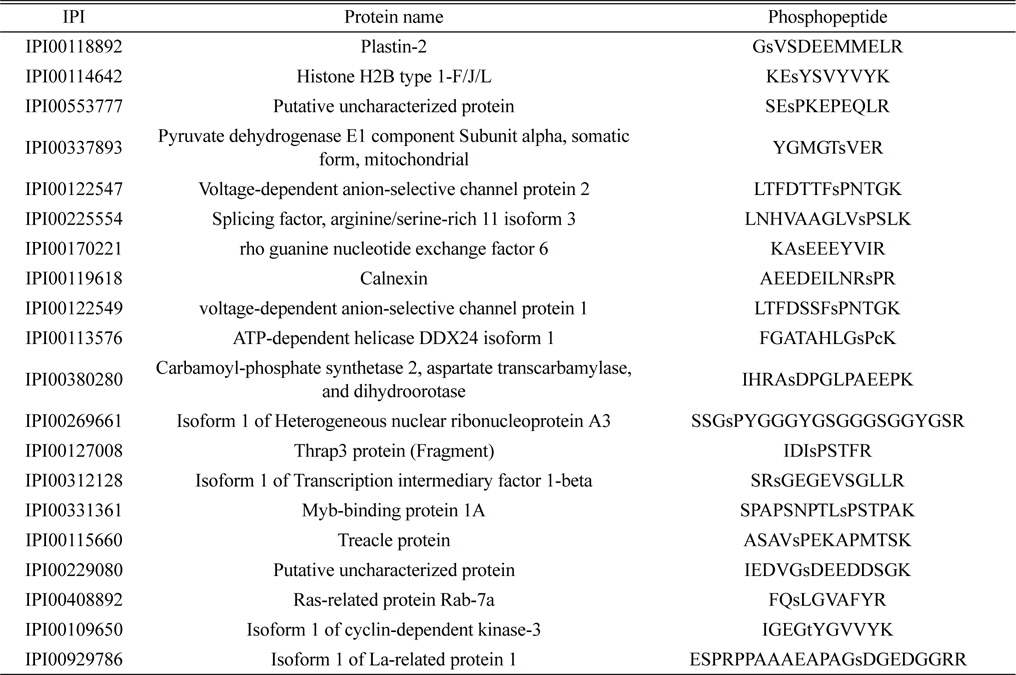
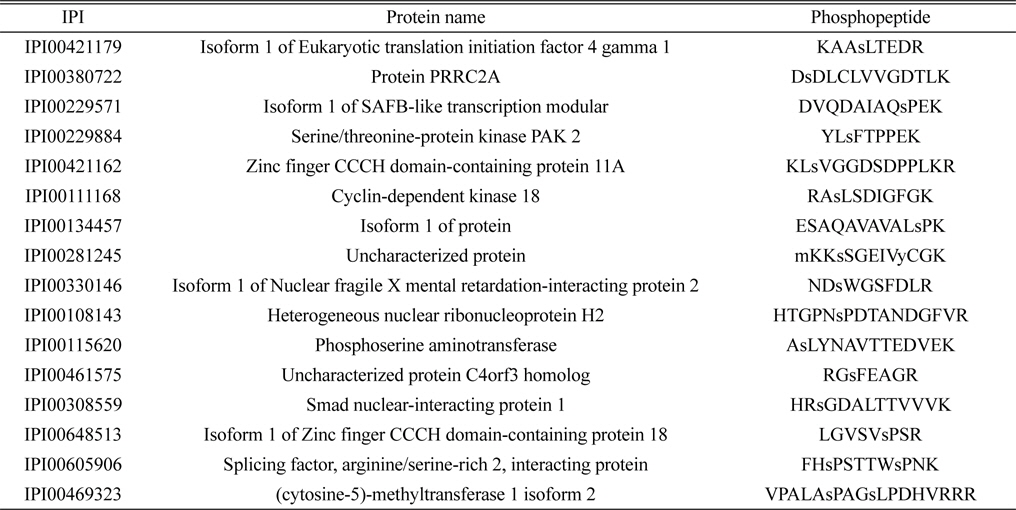
Phosphoproteomic analysis of extracted phosphopeptides from control and LPS-treated BV-2 cell lines identified 36 and 56 phosphoproteins in the control and LPS treatment groups, respectively. Among the proteins identified, 20 are common to both the control and LPS-treated samples, 16 are unique to the control samples, and 36 are unique to the LPS-treated samples.
The lists of identified phosphoproteins are summarized in Table 1, 2, and 3. In table 1, most of phosphoproteins are relating to cellular maintenance, such as proliferation, cell cycle regulation, cellular metabolism. We found several interesting phosphopeptides, which were originating from uncharacterized proteins. In table 2, phosphopeptides from several kinases were identified in control group, which could be relating to cell cycle signaling. In addition, we found two uncharacterized proteins’ phosphopeptides, which could be firstly identified. In table 3, several proteins relating to LPS signaling, such as receptor-type tyrosine protein phosphatase C, cyclin-dependent kinase 3, and inositol-3-phosphate synthase were identified. We also found several novel phosphopeptides originated from uncharacterized proteins. We plan to investigate functional roles of these phosphorylations in BV-2 cell line maintenance and activation.

Identified 20 phosphorylated proteins in both the control and LPS treatment groups. Lower case s and t represent phosphorylated serine and threonine

Identified 16 unique phosphorylated proteins in the control group. Lower case s and t represent phosphorylated serine and threonine
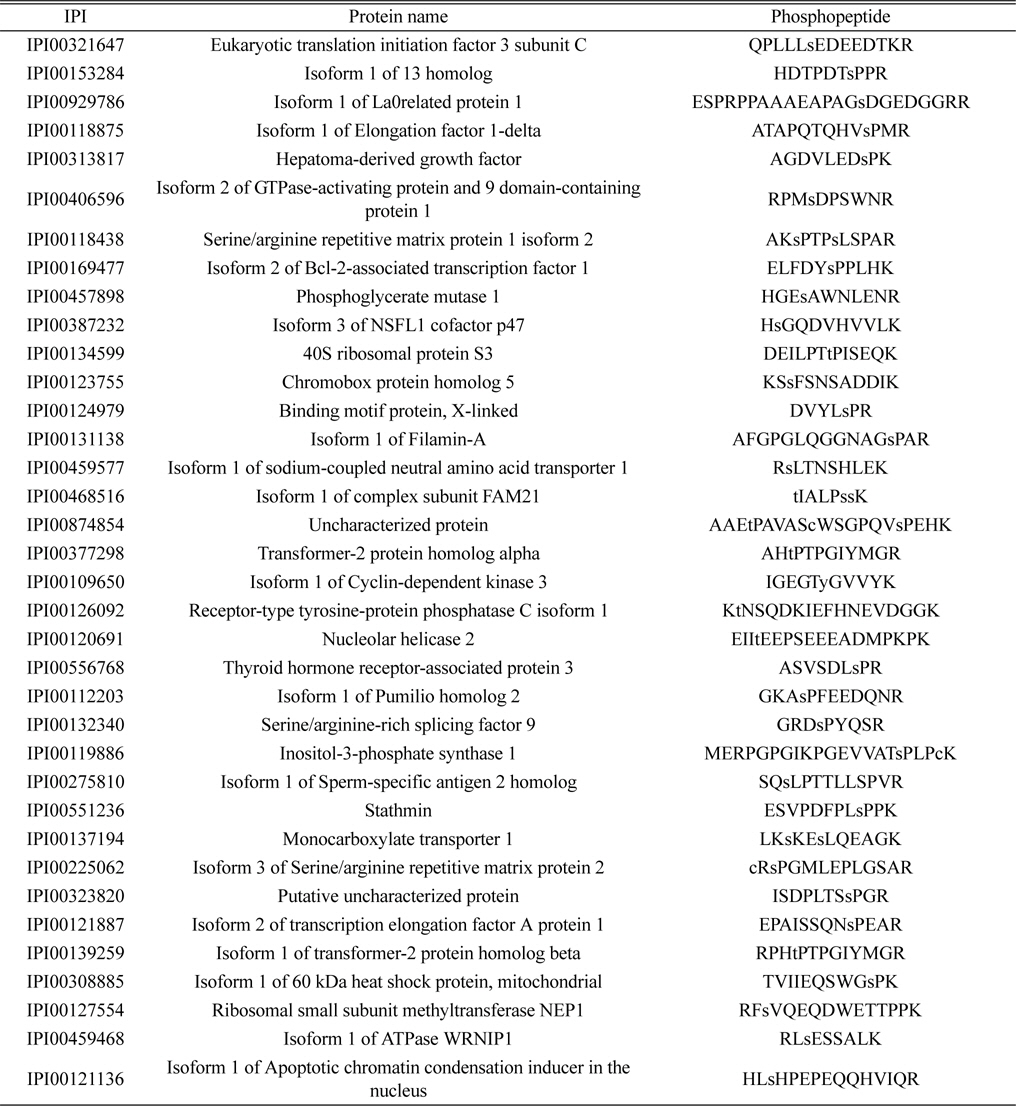
Identified 36 unique phosphorylated proteins in the LPS treatment group. Lower case s and t represent phosphorylated serine and threonine
We acknowledge that the number of found phosphopeptides in this study is relatively small, compared to other phosphoproteomic investigations on different cell lines. This weakness could be coming from non-optimized cell lysis and enrichment condition of our study. The other weakness of this study is lack of quantitative information of phosphopeptides. In order to compare the identified phosphoproteins quantitatively from control and LPS-treated BV-2 cells, the analysis of phosphoproteins through western blotting or isotope-labeling method might be required. However, we are only presenting the difference of pattern of phosphoproteins between control and LPS activated BV-2 cells because this is an initial study. Therefore, we are planning to optimize cell lysis condition and phosphopeptide enrichment condition for BV-2 cell type, and to analyze the level of phosphoproteins through western blotting and quantitative phosphoproteomics in a further study.
>
Bioinformatics analysis of enriched phosphoproteins
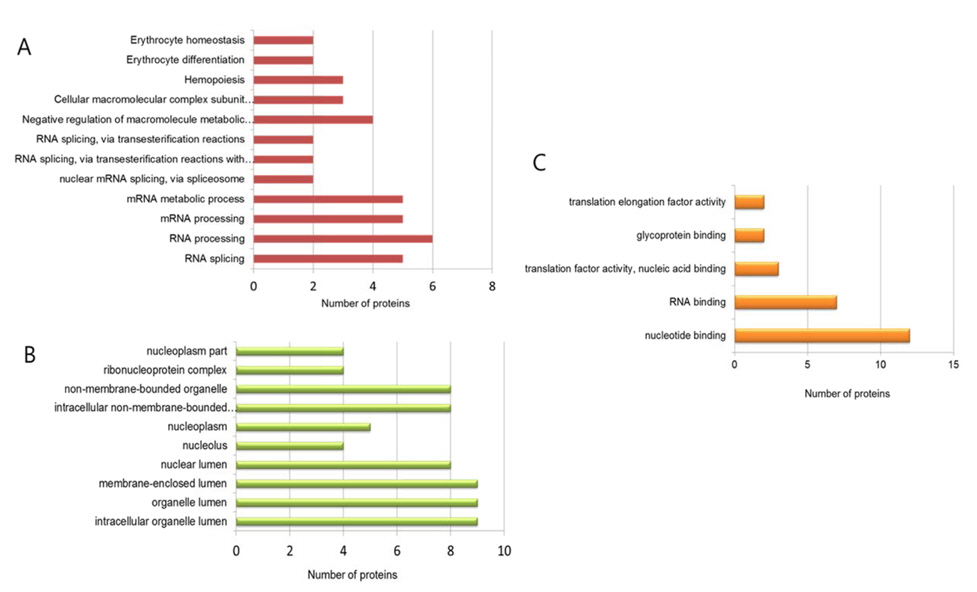
LC-ESI-MS/MS analysis identified 16 and 36 unique phosphoproteins in the control and LPS-treated samples, respectively. The phosphoproteins were functionally classified by biological process and molecular function according to Gene Ontology (GO) annotation using the DAVID Bioinformatics Resources 6.7 database (http:// david.abcc.ncifcrf.gov/).
For the control group, GO analysis revealed that the phosphoproteins identified are mostly involved in control processes such as cell proliferation, apoptosis and that a majority of the functions are related to RNA binding. In contrast, GO analysis of the LPS treatment group revealed that the identified phosphoproteins are involved in diverse biological processes such as RNA splicing and processing, metabolic regulation, and hemopoiesis and that a majority of the functions are related to nucleotide binding, glycoprotein binding, and translation factor activity (Figure 2). Interestingly, GO analysis in cellular component showed that the identified phosphoproteins are mostly located in nucleus and lumen. This means that our cell lysis and enrichment method for phosphopeptides has a limited sample preparation. Now, we are testing different conditions of sample preparation to extend numbers of enriched phosphopeptides from various cellular components.
>
Phosphoinositide lipidomics analysis
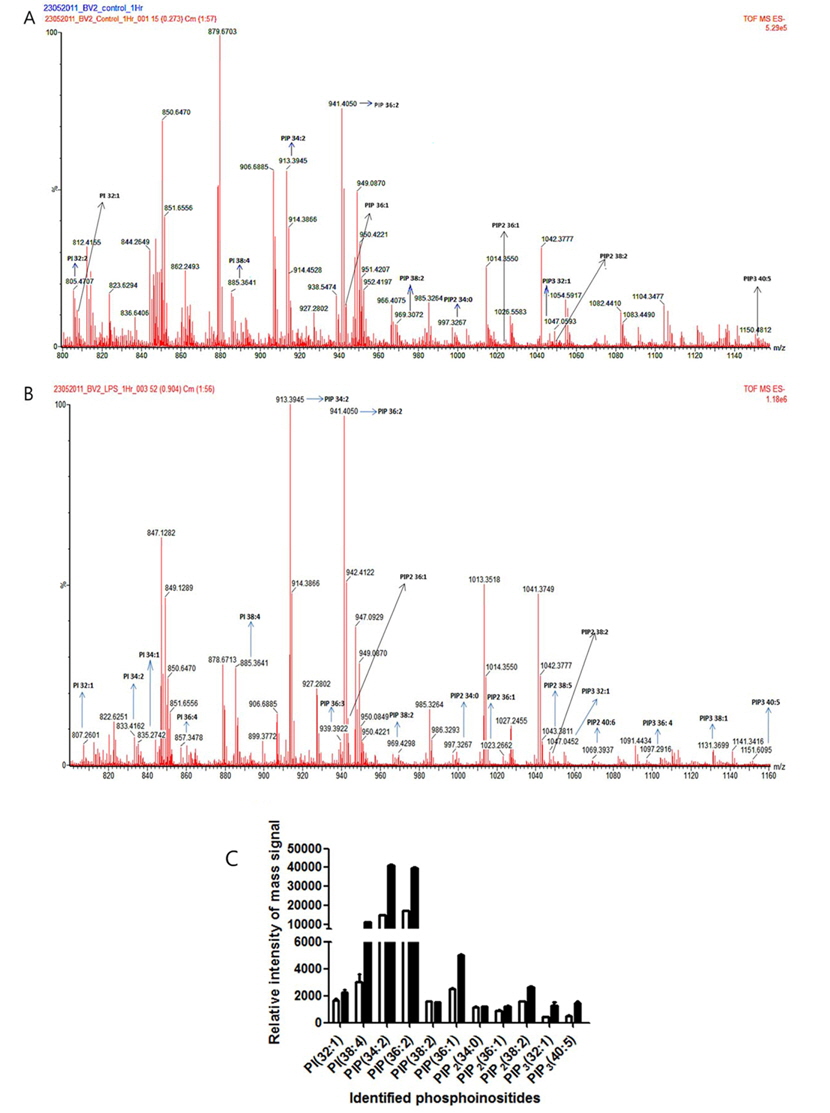
ESI-MS analysis identified several phosphoinositides from control and LPS treated BV-2 cells (Figure 3A and 3B). The identified phosphoinositides were marked next to their molecular mass in mass spectra. We identified several molecular species of phosphatidylinositol (PI) and phosphoinositides (PIP: phosphatidylinositol monophosphate; PIP2: phosphatidylinositol diphosphate; PIP3: phosphatidylinositol triphosphate) from control and LPS activated BV-2 cells. PI(32:1), PI(38:4), PIP(34:2), PIP(36:2), PIP(38:2), PIP(36:1), PIP2(34:0), PIP2(36:1), PIP2(38:2), PIP3(32:1), and PIP3(40:5) were identified in both control and LPS activated BV-2 cells. In addition, PI(32:2) was identified in only control BV-2 cells, but PI(34:2), PI(34:1), PI(36:4), PIP(36:3), PIP2(38:5), PIP2(40:6), PIP3(36:4), and PIP3(38:1) were identified in only LPS activated BV-2 cell.
Lipidomics analysis following ESI-MS revealed that levels of some molecular species of PI and phosphoinositides (PIP; PIP2; PIP3) in the LPS treatment group were remarkably elevated compared with those in the control group (Figure 3C). Quantitative information using the peak intensity of an internal standard was presented with the relative intensity of mass signal for the identified PI and phosphoinositides. Among the phosphatidylinositol species in the LPS-treated cells, PI(38:4) levels were considerably increased (~3 times) and PI(32:1) levels were moderately elevated (~1.4 times). In the case of phosphoinositide species, PIP(34:2) and PIP(36:2) levels were considerably upregulated (~2.7 times and ~2.4 times, respectively), and the level of PIP(36:1) was also upregulated (~2.0 times). Interestingly, PIP(38:2) was slightly downregulated (~0.98 times) in LPS-treated cells. However, PIP2(34:0), PIP2(36:1), PIP2(38:2), PIP3(32:1), and PIP3(40:5) were all upregulated after LPS treatment (~1.1 times, ~1.3 times, ~1.7 times, ~3.1 times, and 2.9 times, respectively). The greatest positive effects on PIP regulation were observed for PIP(34:2) and PIP(36:2), which suggests that kinases responsible for synthesizing PIP(34:2) and PIP(36:2) are highly active in activated microglia and may be involved in neurodegenerative pathways. In addition, this result suggests that the amount of upregulation of phosphoinositides is different species by species.
In the present experiment, a significant number of unique proteins were phosphorylated after LPS treatment when compared to control cells, and the identified phosphoproteins have several unique and important functions for the cell. Furthermore, we observed remarkable changes in the regulation of phosphoinositide species, especially with regard to PIP(34:2), PIP(36:2), PIP3(32:1), and PIP3(40:5), which were upregulated in the LPS treatment group. These findings suggest that several PI kinase pathways are upregulated during microglial activation, a process known to lead to neurodegeneration. Although some important alterations of nucleus signaling pathway were observed herein, future experiments examining the time dependence of LPS treatment are desirable to determine the exact features of signal transduction pathways in neuroinflammation and develop appropriate therapeutic approaches for neurodegenerative diseases.
Collectively, we firstly performed phosphoproteomics and phosphoinositide lipidomics analysis of LPS activated microglia and reported identification of phosphoproteins and upregulation of phosphoinositides induced by LPS activation with murine BV-2 cell line. This investigation could provide understanding of cellular kinases’ signaling in activated microglia. In addition, we are able to search for a novel way of therapeutic treatment for microgliamediated neurodegenerative diseases with this omics data.