Zinc oxide varistors are highly non-ohmic resistors that can sense and limit transient overvoltage. Unlike a potentiometer that must be manually adjusted, the resistance of a varistor changes automatically in response to a change in the voltage across it. When subjected to a voltage above a certain threshold, varistors serve as a conductor, passing the overvoltage to ground. When the voltage returns to a normal state, they again return to their highly resistive state. As a result, zinc oxide varistors are devices that switch from a highly insulating state to a highly conducting state, and they can do so repeatedly without being destroyed. The non-ohmic characteristics of zinc oxide varistors are attributed to the grain boundary effect formed by sintering zinc oxide powder doped with various minor additives [1,2]. The sintering process produces a distinctive microstructure that consists of semiconducting n-type zinc oxide grains surrounded by very thin insulating intergranular layers. As a result, the junctions of the semiconductor are formed at the grain boundaries and yield Schottky barriers on both sides of the zinc oxide grains, and the zinc oxide varistors can be considered to be multi-junction devices composed of many connections of grain boundaries in series and in parallel [2,3]. As a result of their high non-ohmicity, zinc oxide varistors are effectively used to protect systems from an overvoltage produced in the electronic circuits of electric power systems [1].
It is practically impossible to utilize silver as an inner-electrode (m.p. 961℃) for the manufacture of multilayer varistors (MLVs) with bismuth-doped zinc oxide ceramics and praseodymiumdoped zinc oxide ceramics [4,5]. Rather, platinum or palladium, which are expensive, are used for the internal electrodes of commercial MLVs. Vanadium-doped zinc oxide ceramics are a new candidate material that may allow to use a silver inner-electrode [6,7], and this system has a big advantage in that it can be sintered at a relatively low temperature of ~900℃ [8-12].
It is difficult to apply these at this point for surge protection because vanadium-doped zinc oxide ceramics are in an early stage in terms of the development of the ceramic composition and sintering processes [13,14]. In order to improve the diverse varistor properties of vanadium-doped zinc oxide ceramics, it is very important to investigate the effects that various additives can have on the varistor properties [15-19]. Additives such as Co, La, and Dy are commonly added to bismuth-doped zinc oxide ceramics or to praseodymium-doped zinc oxide ceramics in order to improve the properties of the varistors. In this paper, the effects of Nb, Bi and Cr additives on the properites of the varistors and the aging behavior of V/Mn/Co/La/Dy co-doped zinc oxide ceramics were systematically examined.
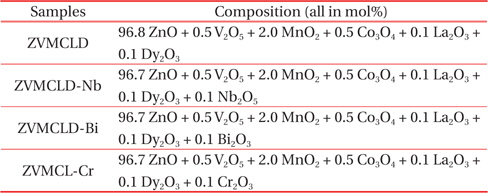
Reagent-grade raw materials were utilized in the proportion of ZVMCLD [(96.8-x) mol% ZnO + 0.5 mol% V2O5 + 2.0 mol% MnO2 + 0.5 mol% Co3O4 + 0.1 mol% La2O3 + 0.1 mol% Dy2O3] + (x mol% Nb2O5, x mol% Bi2O3, and x mol% Cr2O3 additives added to the ZVMCLD composition, x=0.1). The detailed composition of the samples is shown in Table 1. The raw materials were mixed with zirconia balls and acetone in a polypropylene bottle for 24 h using a ball mill. The mixture was dried at 120℃ for 12 h, and the dried mixture was then mixed with acetone and polyvinyl butyral binder (0.8 wt% based on powder weight) in a beaker using a magnetic stirring bar. After drying at 120℃ for 24 h, the starting powder was produced by granulating the mixture by sieving through a 100-mesh screen. A pressure of 100 MPa was applied to press the powder into disk-shaped pellets of 10 mm in diameter and 1.3 mm in thickness. The pellets were set on a MgO plate in an alumina sagger, were sintered at 900℃ in air for 3 h, and were then cooled to room temperature in the furnace. The heating and cooling rates were of 4℃/min, and the final pellets were of ~8 mm in diameter and 1.0 mm in thickness. A conductive silver paste was coated on both faces of the pellets by using screen-printing techniques, and electrodes of 5 mm in diameter were formed by heating at 550℃ for 10 min. Finally, the lead wire was soldered on both electrodes, and the samples were packaged by dipping them into a thermoplastic resin powder.
[Table 1.] Composition of the samples.

Composition of the samples.
2.2 Microstructure examination
One side of the samples was lapped and ground with SiC paper and was then polished with 0.3 μm-Al2O3 powder into a mirror- like surface. The polished samples were chemically etched with an HClO4-H2O solution (1:1,000, v/v) for 25 s at 25℃, and the microstructure of the surface was examined via field emission scanning electron microscopy (FESEM, Quanta 200, FEI, Brno, Czech). The average grain size (d) was determined through the lineal intercept method using the expression d = 1.56 L/MN, where L is the random line length on the micrograph, M is the magnification of the micrograph, and N is the number of grain boundaries intercepted by the lines [20]. A compositional analysis was carried out for the minor phases via energy dispersion X-ray spectroscopy (EDS) attached to a SEM unit. The crystalline phases were identified using an X-ray diffractometer (XRD, X'pert-PRO MPD, the Netherlands) with Ni-filtered CuKα radiation. The density (ρ) of the sintered pellet was measured by using a density determination kit (238490) attached to a balance (AG 245, Mettler Toledo International Inc., Greifensee, Switzerland).
The characteristics of the electric field-current density (E-J) were measured using a high-voltage source unit (Keithley 237, Keithley Instruments Inc., Cleveland, OH, USA). The breakdown field (EB) was measured to be 1.0 mA/cm2, and the leakage current density (JL) was measured to be 0.8 EB. The non-ohmic coefficient (α) was defined using the empirical law, J = C·Eα, where J is the current density, E is the electric field that is applied, and C is a constant. α was calculated by using the expression, α = (log J2 - log J1)/(log E2 - log E1), where J1 = 1.0 mA/cm2, J2 = 10 mA/cm2, and E1 and E2 are the electric fields corresponding to J1 and J2, respectively.
2.4 DC-accelerated aging characteristic measurement
The DC-accelerated aging test was performed for a stress state of 0.85 EB/85℃/24 h. The leakage current was simultaneously monitored at 1 min intervals during stressing using a high voltage source unit (Keithley 237), and the degradation rate coefficient (KT) was calculated by using the expression IL = ILo + KT t1/2 [21], where IL is the leakage current at stress time (t), and ILo is IL at t = 0. The E-J characteristics were then measured at room temperature after the stress had been applied.
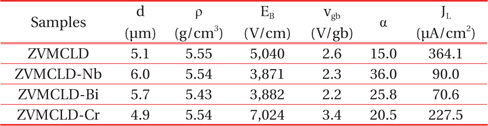
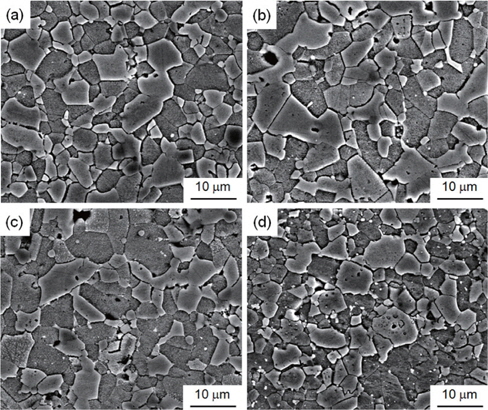
The SEM micrographs of the surface of the samples modified with various additives are shown in Figure 1. The grain structure has a relatively homogeneous distribution throughout the entirety of the samples. The average grain size (d) increased in the order of ZVMCLD-Cr (4.9 μm) < ZVMCLD (5.1 μm) < ZVMCLDBi (5.7 μm) < ZVMCLD-Nb (6.0 μm). The Nb and Bi additives increased the grain size of the zinc oxide to a small extent whereas the Cr2O3 additive restricted the grain growth to a small extent. The grain growth in the Bi2O3-modified samples is assumed to be a result of the liquid phase sintering by Bi2O3. On the other hand, the Nb2O5 additive seems to prompt the movement of grain boundaries to a small extent due to the increase in the interface energy at the grain boundaries. In contrast, it seems that the Cr2O3 additive hinders the movement of the grain boundaries to a small extent due to the decrease in the interface energy at the grain boundaries. The densities (ρ) of the sintered pellets were of 5.55 g/cm3 for ZVMCLD, 5.54 g/cm3 for ZVMCLD-Nb, 5.43 g/cm3 for ZVMCLD-Bi, and 5.54 g/cm3 for ZVMCLD-Cr. Other additives, except for Bi2O3, did not affect the densities (ρ) of the sintered pellets. The low sintered density of the Bi2O3-modified sample is assumed to be a result of the volatility of the V and Bi species that function as aids during liquid phase sintering. The details of the sintered density and of the average grain size of the samples are summarized in Table 2.
[Table 2.] Microstructure and E-J characteristic parameters of the samples with various additives.

Microstructure and E-J characteristic parameters of the samples with various additives.
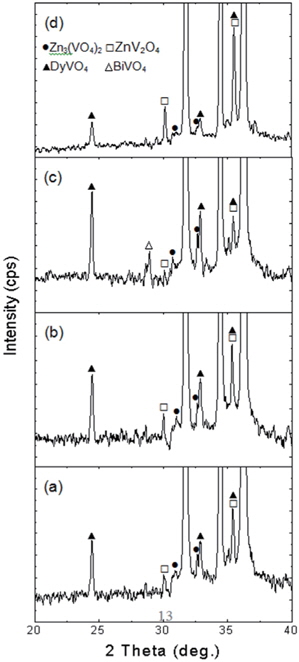
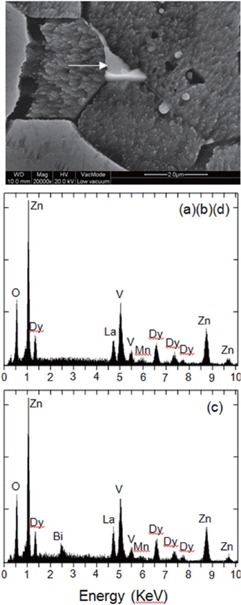
Figure 2 shows the XRD patterns of the samples modified with various additives. All samples revealed the presence of secondary phases, such as Zn3(VO4)2, ZnV2O4, and DyVO4, which play a role as a liquid-phase sintering aid during the sintering process [8]. The Bi2O3-modified sample yielded additional BiVO4 as the secondary phase. The peak for DyVO4 (2° =24.919°, 33.471°) decreased abruptly in the Cr2O3-modified sample, and therefore, the lack of sintering aid will restrict the grain growth when compared to that in samples with other additives. Consequently, the Cr2O3-modified sample revealed the smallest grain size. The EDS analysis revealed, as indicated in Figure 3, that the additives were not detected at the grain and at the grain boundaries within the detection limit, but were detected at the secondary phases due to a larger ionic radius than that of Zn. Also co-doped V, Mn, La, and Dy were detected at the secondary phases.
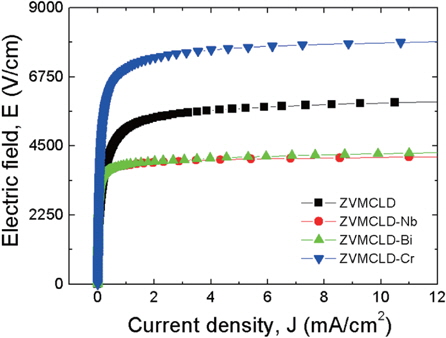
Figure 4 shows the electric field-current density (E-J) characteristics of the samples modified with various additives. The curves show noticeable varistor properties that show a nonohmic character in the E-J measurements. The characteristics of the varistors consisted of two piecewise linear regions near the knee. A sharper knee between the two regions will result in better non-ohmic properties. In addition, the knee can be seen to be sharper in the order of additive-free followed by Cr2O3-, Bi2O3- , and Nb2O5-modified samples. Therefore, the additives selected obviously enhance the varistor properties. The Nb2O5 and Bi2O3 additives decreased the breakdown field (EB) up to about 3,880 V/cm, and the Cr2O3 additive increased the breakdown field (EB) up to about 7,000 V/cm. EB is expressed as EB = VB/D = (vb .n)/D = vb/d, where VB is the breakdown voltage, D is the thickness of the sample, vb is the breakdown voltage per grain boundary, and n is the number of grain boundaries. Thus, EB is predominantly controlled by d and is slightly influenced by vb. As a result, the behavior for EB is directly related to the number of grain boundaries or to the average value for d. The experimental results showed that the change in the tendency of the breakdown field (EB) is associated with the average grain size (d). All of the additives enhanced the non-ohmic properties, and in particular, the Nb2O5 additive significantly enhanced the non-ohmic coefficient (α) beyond 35. The non-ohmic coefficient (α) decreased in the order of ZVMCLD- Nb2O5 (30) > ZVMCLD-Bi2O3 (25.8) > ZVMCLD-Cr2O3 (20.5) > ZVMCLD (915). The non-ohmic coefficient (α) depends on the barrier height caused by the electronic states at the active grain boundary, and each additive will produce a different change in the electronic states at the active grain boundaries. The leakage current (IL) shows an opposite relation to the non-ohmic coefficient (α), for which the Bi2O3 and Nb2O5 additives can greatly reduce the leakage current (IL). However, on the whole, the IL value is much higher than expected in the light of the value of the nonohmic coefficient (α). The high leakage current of the samples is presumed to be due to the recombination of the electrons and holes at the grain boundary. The detailed E-J characteristic parameters of the samples are summarized in Table 2.
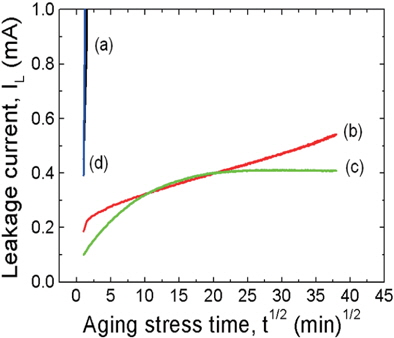
Figure 5 shows the variation in the leakage current during the DC-accelerated aging stress of the samples modified with various additives. This figure shows that the additives can have a significant effect on the aging behavior of the samples. The samples, such as the ZVMCLD and ZVMCLD-Cr2O3, exhibited thermal runaway within a short amount of time (approximately 1 min) under the specific DC-accelerated aging stress of 0.85 EB/85℃/24 h. The Cr2O3 additive did not improve the stability of the sample, but the Bi2O3 and Nb2O5 additives improved the stability of the samples against DC-accelerated aging stress. The Nb2O5-modified sample exhibited a positive creep of leakage current (PCLC) phenomena, in which linear increases without thermal runaway are observed when the stress time increases. The sample modified with the Bi2O3 additive exhibited PCLC phenomena until the stress time was of 7 h, and then the leakage current remained constant when the stress time exceeded 7 h. Therefore, the sample modified with Bi2O3 was found to exhibit the highest stability under a specific stress state. The density of the sintered ceramics, their secondary phases, and the leakage current have a strong effect on the stability against DC stress. In general, the low sintered density, the high distribution of the secondary phases, and the high leakage current will deteriorate the stability of the samples. The low sintered density and the high distribution of the secondary phases decrease the number of parallel conduction paths, and these eventually lead to the concentration of the current. The high leakage current gradually increases carrier generation due to the presence of joule heat, and this leads to a repetition of the cycle between joule heating and leakage current. This is the core of the aging mechanism from a macroscopic point of view. Therefore, the thermal runaway in the additive-free samples and in the Cr2O3-modified samples is attributed to an extremely high leakage current. In contrast, the Nb2O5- and Bi2O3-modified samples exhibited a relatively high stability due to the low leakage current. The electrical stability of the samples can be estimated through the degradation rate coefficient (KT), indicating the degree of aging from the slope of the IL-t1/2 curve. The low degradation rate coefficient (KT) will lead to a high stability, and the degradation rate coefficient (KT) for the Nb2O5- modified sample was of +59.8 μA·h-1/2, and that of the Bi2O3-modified sample was of +28.7 μA·h-1/2. However, considering a stress time of only 7 h, the degradation rate coefficient (KT) for the Bi2O3-modified sample was of only +1.57 μA·h-1/2.
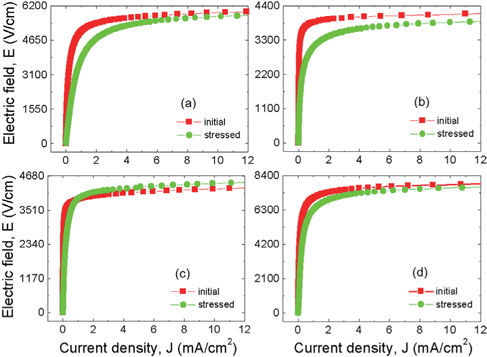
Figure 6 shows the behavior of the E-J characteristics after application of a stress to the samples modified with various additives. The additives can be seen to have a strong effect on the E-J characteristics after application of a stress. The additive-free samples and the Nb2O5-modified samples exhibited a very large variation in the E-J characteristics after application of a stress, and in particular, they showed a severe degradation near the knee region. In contrast, the samples modified with Bi2O3 and Cr2O3 exhibited a small variation in their E-J curves after application of a stress. In this case, the stability of the Cr2O3-modified samples was peculiar in that thermal runaway was observed, as known from the IL-t1/2 curve. In general, thermal runaway indicates that stability is very poor. Nevertheless, the Cr2O3-modified samples deviated greatly from the generality between thermal runaway and stability in the E-J characteristics. This is obviously a very extraordinary phenomenon. This observation for this sample may be the result from the capability for quick recovery against DC stress.
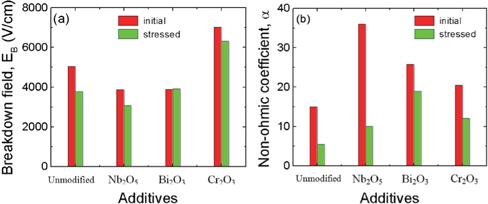
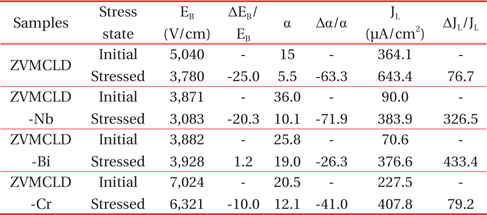
Figure 7 shows the variation in the breakdown field (EB) and in the non-ohmic coefficient (α) after stress is applied to the samples modified with various additives. All of the samples can be seen to improve in terms of the stability for the breakdown field after application of a stress. In particular, the Bi2O3-modified sample exhibited a very high stability where ΔEB/EB is only 1.2%. Also, the Cr2O3- modified sample exhibited a small variation for the breakdown field, despite having a thermal runaway against expectations. However, the Nb2O5-modified sample presented a large variation in the breakdown field, when compared with the Cr2O3-modified sample, despite no thermal runaway being present. Therefore, it is obvious that Nb2O5 is an additive that improves the non-ohmic properties of the sample, whereas it is difficult to conclude that the Nb2O5 additive improves the stability against DC stress the least for ZVMCLD-based ceramics. On the other hand, the changing tendency of the non-ohmic coefficient (α) after application of a stress is similar to that presented by the breakdown field for all samples. However, the extent to which it changed was larger than that of the breakdown field after application of a stress. Of the samples, the Bi2O3-modified sample exhibited the lowest variation in the non-ohmic coefficient (α), Δα/α = -26.3%. The detailed variation of the E-J characteristic parameters after application of a stress is summarized in Table 3.

E-J characteristic parameters before and after application of a stress of the samples with various additives.
In terms of the stability with various additives, the ZVMCLD-Nb2O3 sample can be seen to have a low leakage current, and it exhibited a low stability without thermal runaway. The ZVMCLDCr2O3 sample has a high leakage current, and it exhibited a high stability with thermal runaway, as compared to the ZVMCLD-Nb2O3. In addition, the ZVMCLD-Bi2O3 sample has a low sintered density and a low leakage current, and consequently, it exhibited a high stability. Overall, it is difficult to assert that only macroscopic factors, such as sintered density and leakage current, affect the stability. Microscopically, this may be deeply related to the migration of the zinc interstitials (Zni) within the depletion layer [22]. The reason why the ZVMCL-Bi2O3 sample exhibits good stability is guessed to be a result of the Bi spatially restricting the migration of ions within the depletion layer.
The varistor properties and the aging behavior of V/Mn/Co/La/Dy co-doped zinc oxide ceramics were investigated with various Nb, Bi, and Cr additives. The Bi2O3 additive decreased the density of the sintered pellets to a small extent, and the Cr2O3 additive decreased the average grain size to a small extent. The Cr2O3-modified sample exhibited the highest breakdown field, and the Nb2O3- and Bi2O3-modified samples exhibited the lowest breakdown field. All of the additives improved the properties of the varistor in terms of the non-ohmic coefficient (α) and the leakage current density. The sample modified with Nb2O5 exhibited a relatively high non-ohmic coefficient (α=36), but it exhibited the lowest stability against DC stress. In contrast, the sample modified with Bi2O3 exhibited a strong stability in the breakdown field. Considering both the varistor properties and the stability, it is assumed that the Bi2O3 additive can be effectively applied to V/Mn/Co/La/Dy co-doped zinc oxide ceramics.