Polyethylene is extensively used as groundwall insulation in high and medium voltage electric cables due to its good electrical insulating properties. However, many of its physical properties need to be improved in order to broaden its engineering application. It has been observed that adding a small amount of nanoclay (layered silicates) to some thermoplastics as reinforcing fillers to form nanocomposites material leads not only to an improvement of the mechanical and thermal properties[1-4], but also to an enhancement of the dielectric properties of these materials [5-12].
There are three typical different processing procedures for preparing nanocomposites: (1) in-situ polymerization, (2) solution blending, and (3) melt compounding. The latter is considered to be the most convenient and effective technique for producing nanocomposites, and uses twin-screw extruder. The procedure offers economic benefits and ecological advantages.
The morphology of polymer clay nanocomposites can be classified into three different structures: (1) unmixed nanocomposites, in which polymer chains do not penetrate between silicate layers; (2) intercalated nanocomposites, in which polymer chains are intercalated between silicate layers, and (3) exfoliated nanocomposites, in which the organoclay plates are separated by an average distance that depends on the organoclay plates concentration, and the individual silicate layers are randomly distributed in the polymer matrix. In this case, X-ray diffraction does not show any 001 diffraction peak. The main problem in the fabrication of nanocomposites is the dispersion of the individual clay platelets into the polyethylene matrices due to the incompatibility of hydrophobic polyolefin with hydrophilic nanoclay [13]. To render clay platelets compatible with the polymer matrix, a surface treatment, which uses quaternary alkyl ammonium cations [14], is completed via ion-exchange reactions with cationic surfactants.
The purpose of this paper is to examine the effect of nanoclay dispersion and to understand the relationship between the structure and dielectric properties of LLDPE/O-MMT nanocomposites.
Linear low density polyethylene (LLDPE, FPs117, NOVA Chemicals), with a melt flow index (MFI) of 1 g/10 min and a density of 0.917 g/cm3, was used as matrix. A commercial masterbatch of LLDPE/O-MMT (NanoMax) containing 50 wt% of organo-modified Montmorillonite (O-MMT) was supplied by Nanocor. Maleic anhydride grafted linear low density polyethylene (LLDPE-g-MA, Fusabond M603, DuPont), having a density of 0.940 g/cm3 and MFI of 25 g/10 min, was used as a compatibilizer.
The LLDPE, M603 and commercial master-batch of LLDPE/O-MMT were dried at 40℃ in a vacuum oven for a minimum of 48 hrs prior to extrusion. Nanocomposites were prepared by an extrusion process using a co-rotating twin screw extruder (Haake Polylab Rheomex OS PTW16, D = 16 mm, L/D = 40), coupled with a Haake Metering Feeder in order to control the feed rate. The temperature profile from hopper to die used in this study was 140~180℃, the feed rate was fixed at 1 kg/h, and the screw speed was set at 140 rpm. All materials were manually pre-mixed, before introduction into the twin-screw extruder.
The pellets obtained after extrusion were press-molded to form thin plates (590 μm thickness) using an electrically heated hydraulic press. The molding temperature and pressure were 178℃ and 5 MPa, respectively. A summary of the compositions of the LLDPE/clay nanocomposites used is provided in Table 1.
[Table 1.] Sample formulation and designation.

Sample formulation and designation.
3. CHARACTERIZATION AND MEASUREMENTS
The characterization of nanocomposite structure was performed using an X-ray diffractometer (PANanalytical X’Pert Pro) with Kα radiation (λ = 1.5418 Å), at an accelerating voltage of 40 kV and an electrical current of 45 mA. The scanning was conducted from 2° to 9° with a step size of 0.0334° and the counting time was 200 ms per step. The intercalate spacing between the planes in the atomic lattice d001 was calculated by using Bragg’s law [15]:

3.2 Transmission electron microscopy (TEM)
The degree of dispersion of the nanoclays in the polymer matrix was examined by Transmission Electron Microscopy (TEM). Ultra-thin sections of 50-80 nm in thickness were cut from the molded plaque of LLDPE/O-MMT nanocomposites at -120℃, using an ultramicrotome equipped with a diamond knife. These samples were then examined by high-resolution JEOL JEM-2100F TEM with an accelerating voltage of 200 kV.
3.3 Atomic force microscopy (AFM)
Morphological investigations of the LLDPE/clay nanocomposites were carried out by Atomic Force Microscopy (DiNanoScope, Vecco, USA) in tapping mode. Images of the surface topography were then analyzed using the Nanoscope (R) III software, Version 5.30r.sr3. Samples with a thickness of 560 μm were used, and all measurements were carried out at ambient conditions.
3.4 Scanning electron microscope (SEM)
The sample micro-structure was examined by Hitachi Scanning Electron Microscopy (SEM). Samples were first embrittled in liquid nitrogen and then snapped off by hand and coated with a 2 nm platinum layer in order to avoid electrostatic charging during the microscopic observations.
3.5 Differential scanning calorimetry (DSC)
The thermal behavior of pure LLDPE and LLDPE/O-MMT nanocomposites was observed using a Perkin-Elmer Differential Scanning Calorimeter Pyris 1 instrument. The temperature calibration of the DSC was performed using indium. During each run, the LLDPE and its nanocomposites were heated from 30℃ to 180℃, at a heating rate of 10℃/min, in nitrogen atmosphere.
3.6 Fourier transform infrared spectroscopy (FTIR)
Fourier transform infrared (FTIR) spectra were obtained using a Thermo Electron Nicolet 6700 FT-IR spectrometer instrument. Thin film samples were cut from the compression-molded sheet films. The measurements were carried out at a spectral resolution of 4 cm-1 in the 400~4,000 cm-1 wavenumber range, with accumulations of 32 scans at room temperature. Spectra were collected in transmittance mode.
3.7 Dielectric relaxation spectroscopy
Dielectric relaxation spectroscopy experiments were carried out using a Novocontrol alpha-N Analyzer in the 10-2 to 105 Hz frequency domain at temperatures of 40℃. The temperature was controlled using a Novotherm system, with a stability of 0.5℃.
The samples were sandwiched between two gold-plated electrodes measuring 40 mm in diameter to form a parallel-plate geometry capacitor.
The obtained complex dielectric permittivity is given by:

where ε'(ω) represents the real part, ε"(ω) represents the imaginary part, and ω=2 πf is the angular frequency.
3.8 Dielectric breakdown strength
The dielectric breakdown field was measured according to the ASTM D 149 standard. The specimens were placed between two 12.5 mm hemispherical electrodes and held by a small applied pressure. The whole setup was immerged in mineral oil (Voltesso 35, ESSO Imperial Oil). The rate-of-rise was set to 2 kV/s and a 60 Hz voltage was raised until the sample failed.
The two-parameter Weibull statistical distribution [16] was used to treat the dielectric strength data. The Weibull statistical distribution in the case of two-parameters can be written as follows:

where P(E) denotes the cumulative distributive function of dielectric strength, E is the experimental dielectric strength, α is the scale parameter which represents the breakdown strength at P(α)=0.632, and finally, β is a shape parameter related to the data scattering. According to the IEEE 930-2004 standard, the experimental probability of failure P (i,n) associated with the Ei data can be approximated by:

where i is the ith result when the breakdown values are sorted in ascending order and n is the number of data points. In this paper, n=20.
The commonly used 90% confidence intervals have been used to compare sets of data by verifying the overlapping of the confidence limits at the 63.2th percentile.
4.1 X-ray diffraction (XRD) technique
Figure 1 shows the X-ray diffraction spectra of the O-MMT masterbatch (MB), LLDPE+3% O-MMT and LLDPE+3% O-MMT + 10% M603 nanocomposites. The d001 diffraction peak for the O-MMT masterbatch is about 2 θ = 3.13°, corresponding to a basal spacing d001 of 2.82 nm. When the O-MMT masterbatch was diluted with pure LLDPE, the diffraction peak was found to shift to a smaller angle, indicating the increase in d001 spacing of the galleries of the organoclay. For the ternary nanocomposites LLDPE+3% O-MMT+10% M603, the reduction in the diffraction intensity and the disappearance of the basal peak suggested that O-MMT is exfoliated in the polymer matrix.
4.2 Microstructure of nanocomposites
Transmission electron microscopy was employed in order to directly visualize the nanocomposites’ structure and to confirm XRD information about the quality of dispersion for silicate platelets in the polymer matrix. TEM micrographs of LLDPE+3%O-MMT and LLDPE+3% O-MMT+10% M603 are shown in Fig. 2. It can be seen that clay is presented as tactoids in the LLDPE+3% O-MMT nanocomposites (Fig. 2(a)). Obviously, when the compatibilizer is added, the microstructure of the nanocomposites is significantly improved, and this is presented as a combination of intercalated and exfoliated nanoclay layers (Fig. 2(b)).
AFM height images of LLDPE+3% O-MMT and LLDPE+3% O-MMT+ 10% M603 were used in order to study the dispersion of nanoclay in the polymer matrix. The surface properties of these two nanocomposites in 3D height image are shown in Figs. 3(a) and 3(b). From the images, the nanoclay appears brighter than the polyethylene matrix. It is obvious that in the compatibilized nanocomposites, the agglomerates are broken into small tactoids and the nanoclays are more homogeneously distributed in the polymer matrix. This leads to a reasonably good dispersion of nanoclay in LLDPE+3% O-MMT+10% M603 nanocomposites [17]. These obtained results are also well corroborated by XRD and TEM measurements.
Differential Scanning Calorimetry (DSC) was used to measure the melting temperature and the fusion enthalpy ΔHF. The degree of crystallinity was calculated as

where ΔHF is the heat of fusion (J/g), is the theoretical heat of fusion of 100% crystalline LLDPE (293 J/g) and φ is the weight fraction of O-MMT.
DSC numerical data of LLDPE and its nanocomposites are reported in Table 2. It can be seen that the addition of nanoclay to the LLDPE matrix had no significant impact on the melting temperature for all the samples. However, the crystallinity of LLDPE/O-MMT samples was found to increase at concentrations of nanoclay of 1 wt%. This observation could be explained by the fact that nanoclay layers acted as nucleating agents and facilitated the crystal growth. On the other hand, the degree of crystallinity was found to slightly decrease with further increases of nanoclay concentration (5 wt%). A possible explanation for this could be that intercalated nanoclay layers of O-MMT limit the growth of the polymer spherulites.
[Table 2.] DSC results for pure LLDPE and LLDPE/O-MMT nanocomposites.

DSC results for pure LLDPE and LLDPE/O-MMT nanocomposites.
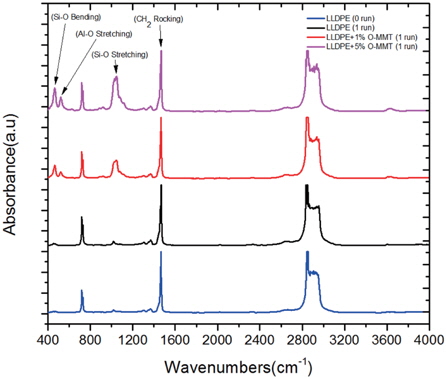
Transmittance Fourier Transform Infrared Spectroscopy was used to quantify the possible thermal degradation and monitor the motion of molecular chain of pure LLDPE and LLDPE/O-MMT nanocomposites.
Figure 4 shows the infrared spectra of LLDPE (0 run), LLDPE (1 run) and LLDPE/O-MMT (1 run) nanocomposites with different O-MMT contents. Comparing the infrared spectra of LLDPE (0 run) with that of LLDPE (1 run) indicates the absence of any oxidation phenomena during the one-run extrusion process. The binary nanocomposites LLDPE/O-MMT show only the characteristic peaks for both pure LLDPE and O-MMT. The absence of any new peaks indicates the absence of any oxidation or chemical reactions between the nanoclay and polymer matrix.
O-MMT has characteristic peaks at 464 cm-1, 521 cm-1 and 1,047 cm-1; these bands are related to Si-O bending, Al-O stretching and Si-O stretching, respectively [18]. It can be seen that the intensity of the Si-O stretching band increased as the nanoclay content increased. Vaia et al. [19] showed that around 1,469 cm-1, the CH2 rocking band is related to the polymer chain motion, and the shift of this peak to the higher wave number indicates a decrease in the polymer chain mobility. The fact that the characteristic peak of the CH2 rocking band in LLDPE/O-MMT nanocomposites with 5%wt of nanoclay content was shifted to higher wavenumber (1,471 cm-1) compared to that in pure LLDPE (1,469 cm-1) can be explained by the fact that the additional 5 wt% of nanoclay slows down the chain motion, and therefore decreases the crystallinity. This is in agreement with DSC results.
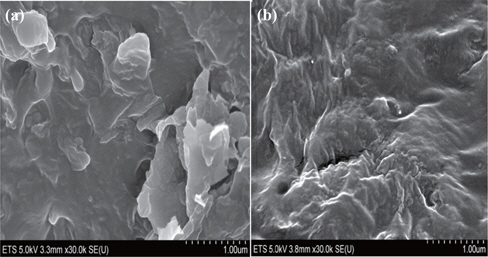
4.6 Effect of screw speed on morphological characterization
To study the effect of screw speed on clay dispersion of nanoclay layers in the polymer matrix, two different speeds (50 rpm and 350 rpm) were selected. The nanoclay content was 3 wt% and the compatibilizer M603 concentration was set at 10% wt. Figure 5 shows the morphology of the ternary nanocomposite LLDPE+3% O-MMT+10% M603 on a nanometric scale, using scanning electron microscopy (SEM). A comparison between the morphology of the nanocomposite extruded at low speed (Fig. 5(a)) and that at high speed (Fig. 5(b)) shows that the density and size of aggregates decreased as the screw speed increased. The screw speed led to an improvement in the nanoclay dispersion and to more exfoliated layers.
4.7 Broadband dielectric spectroscopy
Figure 6 shows the dielectric response of LLDPE, LLDPE+1%O-MMT, LLDPE+3% O-MMT, LLDPE+3% O-MMT+ 10% M603 and LLDPE+5% O-MMT nanocomposites obtained using Frequency-Domain dielectric spectroscopy at 40℃ in the 10-2 to 105 Hz frequency range. Figure 6(a) shows that the relative permittivity ε' of the 1, 3 and 5 wt% LLDPE/O-MMT nanocomposites sharply decreases. The corresponding dielectric loss ε" shows a relaxation peak at around 102 Hz, as shown in Fig. 6(b). It is also observed that both real and imaginary permittivity increase with decreasing frequency. It is evident that the ε" peak observed in the nanocomposites is due to the addition of nanoclay, because there are no dielectric relaxation peaks for pure LLDPE in this frequency range. The peak of the relaxation processes presented in the nanocomposites is attributable to a Maxwell-Wagner-Sillars polarization associated with the blocking of charges at the interfaces between two inhomogeneous phases of different permittivities and conductivities, namely the polymer matrix and the silicates filler [20-22]. Furthermore, when 10% wt of compatibilizer was used to improve the dispersion of the clay platelets, this relaxation peak was found to shift towards low frequencies.
4.8 Dielectric breakdown measurements
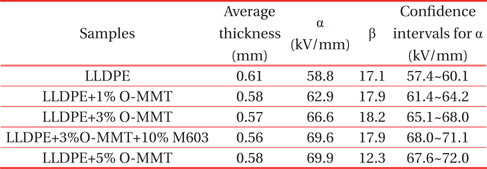
Figure 7 shows the Weibull cumulative failure probability plot for the dielectric strength of pure LLDPE and its nanocomposites (without confidence bounds, for clarity). As reported in Table 3, for LLDPE, LLDPE+1% O-MMT, LLDPE+3% O-MMT, LLDPE+3% O-MMT+10% M603 and LLDPE+5% O-MMT, the scale parameters α were 58.8, 62.9, 66.6, 69.6 and 69.9 kV/mm, respectively, and the shape parameters β were 17.1, 17.9, 18.2, 17.9 and 12.3, respectively. It can clearly be seen from the scale parameter values α and from the confidence intervals that increasing the O-MMT concentration in a binary nanocomposite leads to a noticeable increase in the material dielectric strength. This could be explained by the major role played by the interface between the LLDPE matrix and the nanoclay particles which could impact the space charge distribution and charge densities. In turn, this probably led to a better distribution of the electrical stress [23]. When the compatibilizer was added to LLDPE+3% O-MMT nanocomposites, further improvements of the breakdown strength were noticed. A possible explanation for this is related to the change of microstructure that occurred with the addition of compatibilizer into LLDPE+3% O-MMT nanocomposites. This change of microstructure was already underlined by the microscopic observation results discussed above.
[Table 3.] Weibull parameters for dielectric breakdown strength of LLDPE and its nanocomposites.

Weibull parameters for dielectric breakdown strength of LLDPE and its nanocomposites.
A commercial nanoclay masterbatch was used in this study to prepare LLDPE/O-MMT nanocomposites. Microstructural characterizations revealed that the degree of dispersion was improved by the incorporation of a compatibilizer. No relaxation peaks were observed in the pure LLDPE, but one was found in the nanocomposites and was attributed to an interfacial process. When a compatibilizer was added, this peak was found to shift towards low frequencies.
Dielectric strength measurements showed that in LLDPE/OMMT nanocomposites, significant improvements in dielectric breakdown strength can be achieved, in comparison with pure LLDPE. It was also shown that the improvement of the quality of dispersion leads to a further improvement in dielectric breakdown strength. This may suggest a correlation between nanocomposite structure and dielectric breakdown strength.