검색 전체 메뉴
PDF
맨 위로
OA 학술지
Diffusion Coefficients of CdSe/CdS Quantum Rods in Water Measured Using Polarized Fluorescence Correlation Spectroscopy
  • 비영리 CC BY-NC
  • 비영리 CC BY-NC
ABSTRACT
Diffusion Coefficients of CdSe/CdS Quantum Rods in Water Measured Using Polarized Fluorescence Correlation Spectroscopy
KEYWORD
Fluorescence correlation spectroscopy , Quantum rod , Photon counting
  • I. INTRODUCTION

    Fluorescence correlation spectroscopy (FCS) was developed to study molecular diffusion dynamics and the photochemical properties of various fluorescent probes. FCS is based on the analysis of time-dependent fluorescence fluctuations from diffusing fluorescent probes. Since the late 1990s FCS has progressed due to advances in confocal systems and correlators, and due to the development of detectors with high quantum efficiency. It is well known that the diffusivity of a small particle in solution depends on the size of the particle and the viscosity of the solution. In most studies employing FCS, the relative size of the particle and viscosity of the sample solution have been determined using the Stokes-Einstein equation, based on the diffusion coefficient of a well-known probe in water [1-5]. These studies were unable to confirm particle shape, but the translational diffusion of fluorescent probes has often been investigated assuming that particles are spherical [6, 7].

    The timescale of rotational diffusion for nanometer-sized probes introduces technical challenges, because the detectable time ranges of the correlator become expanded. However, photon antibunching and triplet formation occur on a timescale similar to that of rotational diffusion [8]. Fortunately, larger fluorescent probes (nanometer- or submicrometer-sized fluorescent particles such as quantum dots (Q-dots) and Q-rods) have different time scales for antibunching and lifetime, and they have no triplet state to complicate the analysis. Quantum particles are useful as probes due to their broad absorption bands, narrow emission bands, and high quantum yields [9, 10]. In particular, Q-rods of well-defined size and shape can be used as a standard to verify experimentally the diffusion properties of various rodlike molecules and particles.

    In this study we built a simple confocal-microscope-based polarization FCS system using CW-laser excitation to investigate the rotational and translational diffusion of CdSe/CdS quantum rods. By autocorrelation analyses of various combinations of polarization and viscosity, we characterized the dependence of the rotational and translational diffusion of Q-rods on polarization by using the amplitude and characteristic time of the correlation function [11].

    II. THEORY

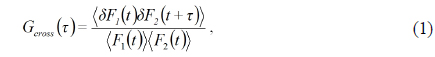
    In a confocal microscope system, the movements of fluorescent particles into and out of the focal volume cause the detected fluorescence to vary in intensity, and this intensity variation inherently contains information about the size, number, shape, and speed of the particles. It is difficult to confirm a large number of total-time series data varying over less than a few milliseconds, so instead these data may be analyzed via the following correlation function:

    image

    where δF1(t) is the fluctuation deviation in fluorescence intensity on one detector at time t, δF2(t+τ) is the fluctuation deviation in fluorescence intensity on the other detector at time (t+τ), and <F1(t)> and <F2(t)> are the average fluorescence intensities of the time series signals at each detector. In general the correlation function obtained from experimental measurements shows several exponential decays, including those due to antibunching, triplet state, and translational and rotational diffusions [8]. The well-known correlation model equation includes three terms representing translational diffusion (GD(τ)), triplet state (GT(τ)), and rotational diffusion (GR (τ)):

    image

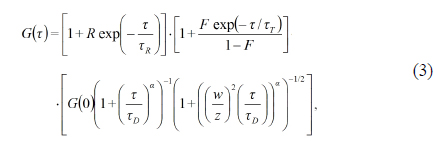
    This equation can be expanded as follows:

    image

    where R is the rotational fraction, τR is the rotational diffusion time, F is the fraction of the triplet state, τT is the triplet state lifetime, G(0) is the initial amplitude of translational diffusion, and τD is the translational diffusion time. The terms τR, τT, and τD are characteristic times corresponding to the FWHM of each region. The beam waist w and axial length z are related to the form of the confocal volume [12].

    The third term of Eq. (3) has been well established by various experiments showing that the parameters of the translational diffusion term carry quantitative information about the average particle number contained in the focal volume during τD, the diffusion coefficient, the hydrodynamic radius of the particles, and the viscosity of the solvent as determined by the Stokes-Einstein equation. The average particle number is simply the reciprocal of G(0). The second term indicating the triplet-state differs according to the presence or absence of each fluorophore. For fluorescent molecules such as rhodamine, this term varies according to background conditions [13], and this term is not present for semiconductors such as Q-dots. The first term shows a rotational diffusion; in the rotational diffusion, the rotational fraction R varies according to the polarization state of the FCS system [14,15]. In FCS the rotational diffusion coefficient DR and translational diffusion coefficient DT are often used to compare the dynamical properties of particles, given by Eq. (4) [16].

    image

    III. EXPERIMENT

       3.1. Optical Setup

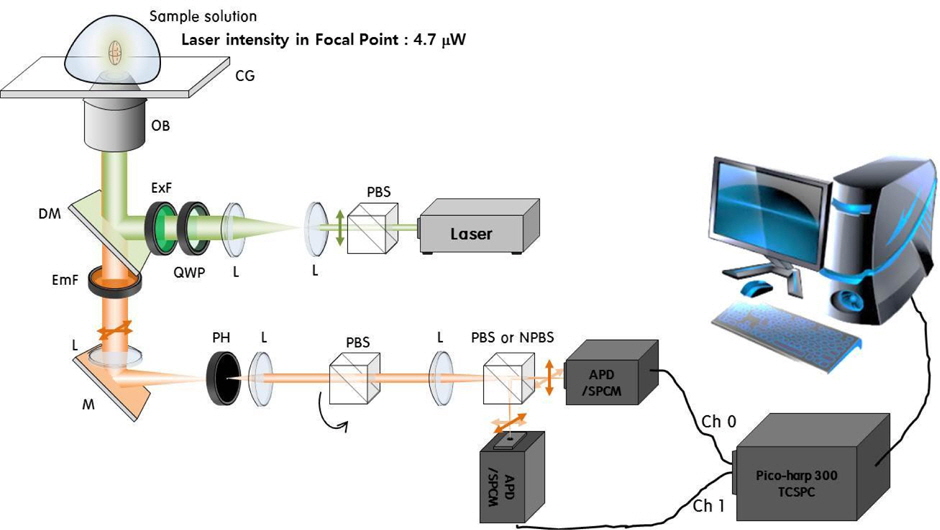
    The FCS setup is illustrated schematically in Fig. 1. A 532-nm DPSS laser (Cobolt, Samba; 25 mW) and a single-photon counting module (SPCM; Id Quantique, id100-50) were used as the excitation source and detector respectively. Alignment of the optical components was accomplished using a commercial optical microscope (Olympus IX71). The optical components in the FCS setup were a polarization beam splitter (PBS), nonpolarized beam splitter (NPBS), excitation filter (ExF), dichroic mirror (DM), objective lens (OB), cover glass (CG), emission filter (EmF), lens (L), mirror (M), and pinhole (PH).

    In this setup, the laser beam from the light source passes through the PBS and enters the optical microscope. The beam then passes through the ExF (Semrock, FF01-531/40-25) and reflects off the DM (Semrock, FF545/650-Di02). The reflected beam passes through the OB (Olympus, 60×, 1.2 NA), the immersion water, and the CG, and then focuses on a very small volume of a few fL inside the solution. The fluorescent particles in the focal volume are excited by the laser beam and then emit fluorescent light; a portion of this light enters the OB. After the light passes through the DM, EmF, and L, it escapes the microscope by the inner mirror. The light emerging from the microscope passes the PH, which is 30 μm in diameter, and the PBS. The PH and PBS are used to make a confocal conjugate point for the confocal volume, and to pass only the polarized fluorescence light, respectively. The light is split into two beams by the NPBS, and these beams are detected by two SPCMs. The fluorescent light detected at the SPCMs is converted into TTL signals, which are then converted into a correlation function by using a time-correlated single-photon counting system (PicoQuant, Picoharp300). The correlation function is monitored as the cross-correlation function of the responses of the two SPCSMs, using the FluoFit program (PicoQuant) [16], the delay time of the correlation being limited to the range from 0.15 μs to 0.1 s.

       3.2. Preparation of Probe Sample

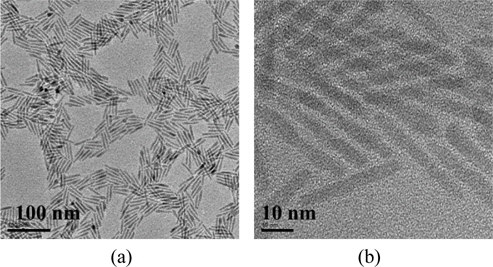
    To investigate the rotational diffusion of rodlike particles, we used Q-rods (Q-rod591) of length 35 nm and width 5 nm (aspect ratio of 7) as the fluorescent particles. SEM analysis showed that the Q-rods were of uniform high quality, and TEM analysis showed that they were of uniform size (Fig. 2). The Q-rods were of a core/shell configuration, with CdSe cores and CdS shells. Q-rod growth is described in detail in Ref. [17]. The Q-rods had a maximum emission peak at 591 nm and could be sufficiently excited by the 532-nm laser beam.

    To characterize the rotational diffusion of the Q-rod591 particles, we diluted them to a concentration of a few nM. At this concentration the number of Q-rods in the effective focal volume of our system would be less than 10. Therefore, we prepared samples of two different concentrations such that the average particle number in the focal volume would be approximately 4 (the “high-concentration” solution) or 0.5 (the “low-concentration” solution). In addition, Q-rod solutions with various viscosities were prepared, to study the dependence of rotational diffusion on viscosity, and to allow a comparison of that result to the effect of translational diffusion on viscosity. Glycerin was used to adjust the viscosity of the solutions with volume percentages of 0, 10, 20, 30, 40, and 50%; the corresponding viscosities of these solutions at 23 ℃ were 0.9, 1.2, 1.7, 2.6, 4.0, and 6.9 cP, as calculated using a formula for the viscosity of a glycerin-water mixture [18].

       3.3. Combination of Polarization States

    To examine the dependence of excitation and fluorescence on polarization states, two linear polarizers were used, one near the laser and one between the PH and the NPBS. The fluorescent light was split into two beams for cross correlation. The fluorescent light split by the NPBS was polarized into two states, XXX and XYY, in which the first letter X refers to the excitation light, and the last two letters denote the polarization states parallel to the excitation light (XX) and perpendicular to the light (YY), respectively.

       3.4. Effective Focal Volume of FCS System

    Before analyzing the diffusion of Q-rods, we confirmed the effective focal volume of the FCS system based on polarization states using a rhodamine 6G (R6G) solution of about 10 nM concentration. At our laser intensity the correlation curve of the R6G solution revealed a triplet state and a translational diffusion state. Thus, the curve was fitted by Eq. (3) assuming the triplet state and linear translational diffusion (a=1). The fitting parameters was obtained via Eq. (3); for all polarization states the structure parameter s=z/w, triplet state time τT, and initial amplitude of translational diffusion G(0) were found to be 4.0±0.2, 1.4±0.22 μs, and 0.57±0.03 respectively, and the translational diffusion time τD was 43±4.7 μs for the XXX state and 43±5.0 μs for the XYY state. This result indicates that the effective focal volume (Veff) of our FCS system does not depend on the polarization state. The beam waist was calculated to be 0.266 μm by Eq. (4), using the translational diffusion coefficient of R6G [19]. Veff was calculated from this result, using the equation Veff = π3/2 w2 z, yielding a value of 0.42 fL [1]. Additionally, to verify the performance of our FCS system we calculated the concentration of the R6G solution used in the measurements. The calculated concentration was 6 nM, which agreed fairly well with the expected value of 10 nM, with a difference of 4 nM; this indicated that the performance of the system was suitable to determine the concentration of the Q-rod solution. Therefore we determined the concentrations of both the low-concentration and high-concentration samples used in this study to be 2 and 16 nM respectively.

    IV. RESULTS & DISCUSSION

    To investigate the polarization dependence of the rotational diffusion of Q-rods, we built the polarization FCS system and measured correlation functions of the Q-rods’ fluorescence responses. Measured functions were fitted by Eq. (3) to determine parameters related to the rotational and translational diffusion of the Q-rods. In Eq. (3) we neglected the triplet state because it does not appear in semiconductors such as Q-dots and Q-rods [19]. However, because the diffusion of Q-rods cannot be expected to be linear like that of Rhodamine 6G, due to the small differences in particle sizes and the irregular blinking in the full duration of the experiments, the anomalous diffusion exponent α was fitted by Eq. (3) using other parameters.

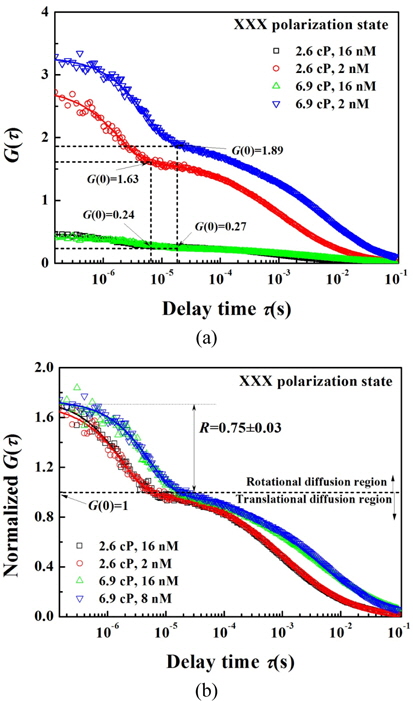
    Before analyzing the influence of polarization, we examined the change in correlation function caused by varying the Q-rod concentration. Figure 3 shows the correlation functions obtained from Q-rod solutions of two different concentrations and the two solvent viscosities of 2.6 and 6.9 cP, in the XXX polarization state. The correlation functions varied greatly with viscosity and sample concentration (Fig. 3(a)). In samples of viscosity 2.6 cP, the amplitude of the correlation function G(τ) increased as the sample concentration decreased. This result was also observed in samples of viscosity 6.9 cP, indicating that G(τ) is inversely proportional to the concentration of the solution. In general, the initial value of the translational diffusion G(0) is proportional to the reciprocal of the number of particles in the effective focal volume. In the 2-nM samples, G(τ) increased as the viscosity of the sample was increased from 2.6 to 6.9 Q-rods’ fluorescence response, but the variation in G(τ) was less than the concentration variation. A similar result was also obtained for the 16-nM samples, but the increase in G(τ) with viscosity was very small compared to that for the 2 nM samples. This means that G(τ) depends more strongly on concentration than on viscosity. Although G(τ) showed a weaker dependence on viscosity than on concentration, the variation of G(τ) with viscosity cannot be neglected at the 2-nM concentration level.

    As shown in Fig. 3(a), in samples of concentration 2 nM the G(0) values of the correlation functions for viscosities of 2.6 and 6.9 cP were 1.63 and 1.89 respectively. This result indicates that the effective focal volume was reduced as the viscosity of the solvent was increased. In both 2-nM samples the concentration of Q-rods was the same; therefore, the difference in viscosity was responsible for the variation in G(0). The samples of viscosity 6.9 cP used in this study included more glycerin than those of viscosity 2.6 cP; this increment of glycerin concentration increases the refractive index of the solution [20], thereby reducing the focal volume, and consequently decreasing the number of Q-rods passing through the reduced focal volume. This can be regarded as a reduction of the concentration of the solution.

    According to the results in Fig. 3(a), the correlation functions obtained based on measurements of the Q-rod solutions were affected by the solutions’ concentration and viscosity. As mentioned previously, the goal in this study is to investigate the rotational diffusion of Q-rods in combination with their polarization states. To carry this out, the influences of the concentration and the viscosity in the translational diffusion of the correlation function were eliminated by using a normalized correlation function. The normalization was achieved by dividing G(τ) by G(0), which yielded the same normalized results for the two concentrations; the normalized functions differed only between the 2.6- and 6.9-cP viscosity groups (Fig. 3(b)). The function for the 6.9-cP group was time-delayed relative to that for the 2.6-cP group, but the normalized functions had the same amplitude in the rotational and translational diffusion regions, respectively. The functions were separated into regions corresponding to rotational and translational diffusion, described by two decay functions before and after approximately 10-5 s. For translational diffusion the amplitude G(0) was 1, and the amplitude of rotational diffusion was 1.75±0.05. The difference of the amplitudes of rotational diffusion and translational diffusion is the rotational fraction; in this case, the rotational fraction was 0.75±0.05. This fraction has same value as the parameter R obtained by fitting. At a viscosity of 2.6 cP, the initial value of the function was lower than the rotational fraction. This means that the rotational region begins before 0.15 μs.

    To analyze the rotational diffusion of Q-rods in combination with the polarization state, we measured and normalized the correlation function using viscosities of 0.9, 1.2, 1.73, 2.57, 4.06, and 6.9 cP and the polarization states XXX and XYY, and the normalized functions were fitted by Eq. (3) to obtain the parameters R, τR, τD, and α. For all polarization states the translational and rotational diffusion times increased as the viscosity increased. For the XXX state, the rotational diffusion time increased from 0.58±0.055 μs to 5.17±0.50 μs as the viscosity of the solvent increased from 0.9 to 6.9 cP; the diffusion time for the XYY state showed a similar trend, with the rotational diffusion time increasing from 0.42±0.074 μs to 3.27±0.22 μs as the viscosity increased in the same range. For the lowest viscosity of 0.9 cP, the diffusion times of the XXX and XYY states differed slightly, by 0.16 μs, but for the viscosity of 6.9 cP the difference was 1.90 μs. This result for the 6.9 cP viscosity may be due to nonlinear diffusion caused by irregular blinking and the small differences in size of the Q-rods in the high-viscosity solvent. Furthermore, the anomalous diffusion exponent α, quantifying the nonlinear diffusion of the Q-rods, decreases from 0.75 to 0.61 with increasing solvent viscosity [21]. This result also may indicate that the difference in diffusion times under high-viscosity conditions is due not to the polarization state but to nonlinear diffusion [22].

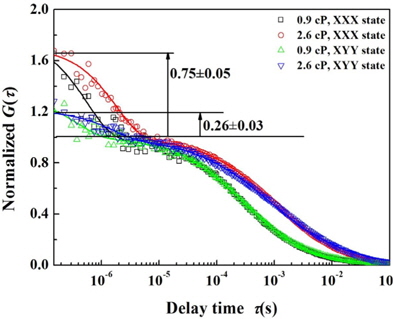
    Figure 4 illustrates the normalized G(τ) for viscosities of 0.9 and 2.6 cP and the two polarization states studied; as shown in the figure, the rotational fractions were 0.75±0.05 in the XXX state and 0.26±0.03 in the XYY state. The fractions in the XYY state were smaller than those in the XXX state, which might an artifact of our FCS system. The system used in this study may be regarded as having three polarizers: a linear polarizer, a rotating linear polarizer, and an analyzer. The linear polarizer is in front of the light source, the rotating linear polarizer is the Q-rods in solution, and the linear analyzer is in front of the detector. The angle between the first polarizer and the last analyzer is 0° in the XXX state and 90° in the XYY state. The intensity of light passing through the three polarizers can be described by Malus’ law [23]: At 0° the maximum intensity ratio of input to output is 1, and at 90° the ratio is 0.25. According to this assumption the fraction for the XXX state would be 4 times as large as the value for the XYY state, but the observed difference was about 3 times as large, indicating that the Q-rods do not act as an ideal linear polarizer. If the Q-rods were rotating linear polarizers then the rotational diffusion time would also be expected to change with polarization state, but the rotational axis in Brownian rotation of the rod like particles is random at the full duration of the experiments.

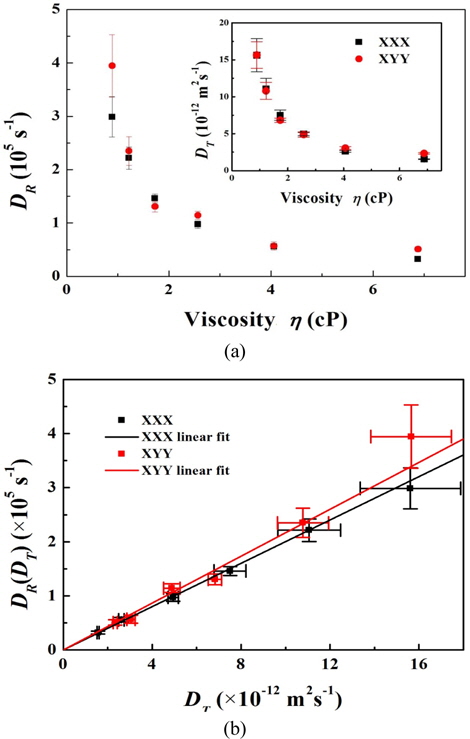
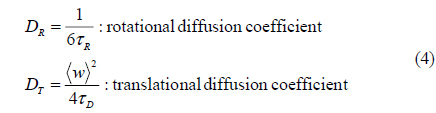
    The rotational and translational diffusion coefficients were calculated by Eq. (4) using the diffusion time; the results are shown in Fig. 5(a) and Table 1. The results agree with the trend in diffusion time. As shown in Fig. 5a, the translational and rotational diffusion coefficients in 0.9-cP samples were (1.6±0.2)×10-11 m2 s-1 and (2.9±0.4)×105 s-1 for the XXX state, and (1.5±0.2)×10-11 m2 s-1 and (3.9±0.6)×105 s-1 for the XYY state, respectively.

    [TABLE 1.] Translational and rotational diffusion coefficients for various viscosities

    label

    Translational and rotational diffusion coefficients for various viscosities

    The relationship between DR and DT was fairly linear in all polarization states (Fig. 5(b)); the linear-fit values of the slope DR/DT were 2.0×10¹⁶ m-2 for the XXX state and 2.2×10¹⁶ m-2 for the XYY state. According to previously published theories on the diffusion coefficient [22], DR/DT has a constant value determined by the particle’s aspect ratio and the square of the particle’s length. In the results herein, the linear fit with DR=0 and DT=0 gave a better result for the XXX state than for the XYY state.

    V. CONCLUSIONS

    We built a polarized fluorescence correlation spectroscopy system based on a confocal microscope, and measured and analyzed the correlation functions of CdSe/CdS Q-rods in solution for various concentrations and viscosities, and for two polarization states. In our analysis of the correlation functions with respect to polarization states, translational diffusion did not depend on the polarization state, whereas rotational diffusion depended strongly on polarization. The rotational fraction was 0.75±0.05 in the XXX state and 0.26±0.03 in the XYY state, and the rotational diffusion time in the XXX state was similar to that in the XYY state. We determined the diffusion coefficients based on the relation between the rotational and translational diffusion coefficients. The translational and rotational diffusion coefficients respectively ranged from 1.5×10⁻¹¹ m2 s-1 to 2.6×10⁻¹² m2 s-1 and from 2.9×10⁵ s-1 to 5.6×10⁴ s-1. Our results can be used to determine the size of rodlike particles, or to determine the rotational diffusion coefficients of particles of other sizes [25].

참고문헌
  • 1. Lakowicz J. R. 2006 Principles of Fluorescence Spectroscopy google
  • 2. Magde D., Elson E., Webb W. W. 1972 “Thermodynamic fluctuations in a reacting system-measurement by fluorescence correlation spectroscopy,” [Phys. Rev. Lett.] Vol.29 P.705-708 google cross ref
  • 3. Elson E. L., Magde D. 1974 “Fluorescence correlation spectroscopy. I. Conceptual basis and theory,” [Biopolymers] Vol.13 P.1-27 google cross ref
  • 4. Magde D., Elson E., Webb W. W. 1974 “Fluorescence correlation spectroscopy. II. An experimental realization,” [Biopolymers] Vol.13 P.29-61 google cross ref
  • 5. Rigler R., Mets U., Widengen J., Kask P. 1993 “Fluorescence correlation spectroscopy with high count rate and low background: analysis of translational diffusion,” [Eur. Biophys. J.] Vol.22 P.169-175 google
  • 6. Brazda P., Szekeres T., Bravics B., Toth K., Vamosi G., Nagy L. 2011 “Live-cell fluorescence correlation spectroscopy dissects the role of coregulator exchange and chromatin binding in retinoic acid receptor mobility,” [J. Cell Sci.] Vol.124 P.3631-3642 google cross ref
  • 7. Pack C., Saito K., Tamura M., Kinjo M. 2006 “Microenvironment and effect of energy depletion in the nucleus analyzed by mobility of multiple oligomeric EGFPs,” [Biophys. J.] Vol.91 P.3921 google cross ref
  • 8. Fitzpatrick J. A. J., Lillemeier B. F. 2011 “Fluorescence correlation spectroscopy: Linking moleculear dynamics to biological function in vitro and situ,” [Current Opinion in Structural Biology] Vol.21 P.1-11 google cross ref
  • 9. Alivisatos A. P. 1996 “Semiconductor clusters, nanocrystals, and quantum dots,” [Science] Vol.271 P.933-937 google cross ref
  • 10. Michalet X., Finaud F. F., Bentolia L. A., Tsay J. M., Doose S., Li J. J., Sundaresan G., Wi A. M., Gambhir S. S., Weiss S. 2005 “Quantum dot for live cells, in vivo imaging, and diagnostics,” [Science] Vol.307 P.538-544 google cross ref
  • 11. Ehrenberg M., Rigler R. 1974 “Rotational Brownian motion and fluorescence intensity fluctuations,” [Chem. Phys.] Vol.4 P.390-401 google cross ref
  • 12. Mets U. 2001 Fluorescence Correlation Sepctroscopy google
  • 13. Shin H. S., Okamoto A., Sako Y., Kim S. Y., Kim S. W., Pack C. G. 2013 “Characterization of the triplet state of hybridization-sensitive DNA probe by using fluorescence correlation spectroscopy,” [J. Phys. Chem. A] Vol.117 P.27-33 google cross ref
  • 14. Kask P., Piksarv P., Pooga M., Mets “., Lippmaa E. 1989 “Separation of the rotational contribution in fluorescence correlation experiments,” [Biophys. J.] Vol.55 P.213-220 google cross ref
  • 15. Ehrenberg M., Rigler R. 1976 “Fluorescence correlation spectroscopy applied to rotational diffusion of macromolecules,” [Q. Rev. Biophys.] Vol.9 P.69-81 google cross ref
  • 16. Zhao M., Jin L., Chen B., Ding Y., Ma H., Chen D. 2003 “Afterpulsing and its correction in fluorescence correlation spectroscopy experiments,” [Appl. Opt.] Vol.42 P.4031-4036 google cross ref
  • 17. Deka S., Quarta A., Lupo M. G., Falqui A., Boninelli S., Giannini C., Morello G., Giorgi M. D., Lanzni G., Spinella C., Cinglani R., Pellegrino T., Manna L. 2009 “CdSe/CdS/ZnS double shell nanorods with high photoluminescence efficiency and their exploitation as biolabeling probes,” [J. Am. Chem. Soc.] Vol.131 P.2948-2958 google cross ref
  • 18. Cheng N. S. 2008 “Formula for the viscosity of glycerol-water mixture,” [Ind. Eng. Chem. Res.] Vol.47 P.3285-3288 google cross ref
  • 19. Dorfschmid M., Mullen K., Zumbusch A., Woll D. 2010 Translational and rotational diffusion during radical bulk polymerization: A comparative investigation by full correlation fluorescence correlation spectroscopy (fcFCS) [Macromolecules] Vol.43 P.6174-6179 google cross ref
  • 20. Muller M. 2006 Indroduction to Confocal Fluorescence Microscopy google
  • 21. Banks D. S., Fradin C. 2005 “Anomalous diffusion of proteins due to molecular crowding,” [Biophys. J.] Vol.89 P.2060-2971 google
  • 22. Tsay J. M., Doose S., Weiss S. 2006 “Rotational and translational diffusion of peptide-coated CdSe/CdS/ZnS nanorods studied by fluorescence correlation spectroscopy,” [J. Am. Chem. Soc.] Vol.128 P.1639-1647 google cross ref
  • 23. Hecht E. 1987 Optics google
  • 24. Cooper A. 2005 Biophysical Chemistry google
  • 25. Pack C., Yukii H., Toh-e A., Kudo T., Tsuchiya H., Kaiho A., Sakata E., Murata S., Yokosawa H., Sako Y., Baumeister W., Tanaka K., Saeki Y. 2014 “Quantitative live-cell imaging reveals spatio-temporal dynamics and cytoplasmic assembly of the 26S proteasome,” [Nat. Commun.] Vol.5 P.1-10 google
OAK XML 통계
이미지 / 테이블
  • [ ] 
  • [ ] 
  • [ ] 
  • [ ] 
  • [ FIG. 1. ]  The polarization FCS setup, based on an optical microscope.
    The polarization FCS setup, based on an optical microscope.
  • [ FIG. 2. ]  (a) SEM and (b) TEM micrographs of 5 nm × 35 nm (aspect ratio: 7) CdSe/CdS Q-rods.
    (a) SEM and (b) TEM micrographs of 5 nm × 35 nm (aspect ratio: 7) CdSe/CdS Q-rods.
  • [ FIG. 3. ]  (a) Fluorescence correlation functions for two viscosities and two particle concentrations; (b) normalized function of (a).
    (a) Fluorescence correlation functions for two viscosities and two particle concentrations; (b) normalized function of (a).
  • [ FIG. 4. ]  Normalized fluorescence correlation functions for two viscosities and both the XXX and XYY states. Symbols and solid lines respectively denote measured and fitted data.
    Normalized fluorescence correlation functions for two viscosities and both the XXX and XYY states. Symbols and solid lines respectively denote measured and fitted data.
  • [ TABLE 1. ]  Translational and rotational diffusion coefficients for various viscosities
    Translational and rotational diffusion coefficients for various viscosities
  • [ FIG. 5. ]  (a) Effects of viscosity on translational and rotational diffusion coefficients. (b) Rotational diffusion coefficient versus translational diffusion coefficient for the XXX and XYY states.
    (a) Effects of viscosity on translational and rotational diffusion coefficients. (b) Rotational diffusion coefficient versus translational diffusion coefficient for the XXX and XYY states.
(우)06579 서울시 서초구 반포대로 201(반포동)
Tel. 02-537-6389 | Fax. 02-590-0571 | 문의 : oak2014@korea.kr
Copyright(c) National Library of Korea. All rights reserved.