검색 전체 메뉴
PDF
맨 위로
OA 학술지
저산소 노출에 따른 감성돔(Acanthopagrus schlegelii)의 생리학적 스트레스 반응 Physiological Stress Responses in Black Seabream Acanthopagrus schlegelii Subjected to Acute Hypoxia
  • 비영리 CC BY-NC
  • 비영리 CC BY-NC
ABSTRACT
저산소 노출에 따른 감성돔(Acanthopagrus schlegelii)의 생리학적 스트레스 반응

The black seabream Acanthopagrus schlegelii is an important species for aquaculture in Korea. There are, however, no reports on the physiological responses to hypoxia in this species. The objective of this study was to evaluate the effects of acute hypoxia on the physiological stress responses (plasma cortisol as the primary response, and plasma glucose, hematocrit (Ht), hemoglobin (Hb), sodium, chloride, osmolality, AST, ALT and total protein as the secondary responses) of the fish. The experimental fish were exposed to 0.5 ppm dissolved oxygen (DO) in the seawater via two methods (progressive stepwise decline (Exp.Ⅰ), and direct decline (Exp.Ⅱ)). A highly significant increase was detected in plasma cortisol levels due to the hypoxia treatments, and fish in Exp.Ⅰ had hormone levels that were significantly higher than the fish in Exp.Ⅱ. For plasma glucose, there was no significant difference between the Exp.Ⅰ fish and the control fish, whereas Exp.Ⅱ fish showed significantly higher plasma glucose levels than Exp.Ⅰ fish and control fish. Ht values increased in both hypoxia treatments; however, Hb concentrations increased only in Exp.Ⅰ. Although plasma chloride levels were unaffected by acute hypoxia, plasma sodium and osmolality levels increased in Exp.Ⅰ. Progressive hypoxia (Exp.Ⅰ fish) increased plasma AST, ALT and total protein. These results suggest that the value and direction of changes to the investigated parameters can be used to determine the resistance of black seabream to acute hypoxia.

KEYWORD
Black seabream (Acanthopagrus schlegelii) , Hypoxia , Stress response , Cortisol , Glucose
  • 서 론

      >  스트레스는 생물체의 항상성이 내인성 또는 외인성 자극에 의해 위협받는 상태이며, 스트레스 반응이란 개체가 이러한 자극을 극복하는 전략으로 알려져 있다(Chrousos and Gold, 1992). 양식 행위에서 스트레스 반응을 유발하는 요인으로는 수질악화(저산소 등), 핸들링, 수송, 감금, 선별, 화학약품 등이 있다(Barton and Iwama, 1991; Davis, 2006). 어류가 스트레스 유발요인에 노출되는 동안 3차의 반응으로 분류되는 생화학적 및 생리학적 변화를 연속적으로 겪게 된다(Wendelaar Bonga, 1997). 1차 반응은 신경내분비 반응으로 교감신경 활성, 카테콜아민 분비 그리고, 시상하부-뇌하수체-신장 축(hypothalamus?pituitary?interrenal axis) 활성에 따른 코티졸 분비가 이에 속한다. 2차 반응으로는 물-미네랄의 불균형과 글루코스와 같은 에너지 동원이 수반된다. 일반적으로 혈장 코티졸과 글루코스의 상승 수준은 스트레스 유발요인 노출에 따른 지표와 스트레스 유발요인 강도율 지수로 유용하게 사용된다. 3차 반응은 스트레스 유발요인이 오랫동안 지속적으로 발생할 경우와 어체가 항상성을 회복하지 못할 때 발생하며, 이러한 경우에는 면역시스템, 번식 기능, 성장에 부정적인 영향을 미친다(Barton and Iwama, 1991; Wendelaar Bonga, 1997; Iwama et al., 2006). 스트레스 유발요인에 따른 어체의 행동, 생리학적 반응은 실질적으로 어종과 스트레스 유발요인 형태에 따라 달라진다는 것이 여러 연구에서 보고된바 있다(Barton and Iwama, 1991; Iwama et al., 2006).

    빈산소는 정상적인 산소보다 현저하게 낮은 산소를 포함하는 있는 경우를 말하는 것으로, 빈산소의 수괴 형성은 조류소통이 원활하지 못하고, 연안이 부영양화되어 수중에 축적된 유기물이 많은 곳에서 여름철 수온이 상승할 때 발생할 수 있다(NFRDI, 2009). 자연 환경에서는 유영생물이 이러한 빈산소 수괴로부터 도피할 수 있으나, 가두리 및 수하식 양식방법에 따른 양식생물은 빈산소 수괴에 대한 피해가 불가피하다. 또한 어류의 육상 수조식 양식시 공급수 펌핑 및 산소공급장치에 문제가 발생될 경우 급격한 저산소 현상이 나타나며, 이는 양식 어류의 뇌, 간, 근육의 에너지 대사에 장애를 유발함으로써 어류폐사에 직접적으로 영향을 미친다(van Raaij et al., 1994; Lays et al., 2009). 급격한 저산소 노출에 따른 다양한 생리학적 변화는 여러 어종에서 밝혀져 있다(Caldwell and Hinshaw, 1994; Lays et al., 2009; Sun et al., 2012). 또한 저산소는 혈중 CO2, 글루코스, hematocrit (Ht), hemoglobin (Hb)의 상승(Smit and Hattingh, 1978)과, 나아가 먹이섭식, 성장, 사료효율의 감소를 초래한다(Chabot and Dutil, 1999).

    감성돔(Acanthopagrus schlegelii)은 부가가치가 높은 중요 해산 양식 대상종으로 알려져 있으며, 인공종묘생산 및 생산성 향상을 위한 기술개발, 수요증가 등으로 인해 최근에는 그 생산량이 해마다 급증하고 있는 실정이다. 또한 감성돔은 어업 자원 증대를 위한 방류품종으로 종묘생산을 통해 우리나라 전 연안에 대량 방류되고 있는 주요 어종 중 하나이다.

    본 연구의 목적은 상업적으로 중요한 감성돔을 대상으로 저산소 노출에 따른 스트레스의 1·2차 반응을 내분비학적, 생화학적 및 혈액학적 측면에서 조사하고자 하였다.

    재료 및 방법

      >  실험어

    본 실험에 사용된 감성돔은 경남 거제시에 소재한 가두리 양식장으로부터 300마리(평균 전장 17.0±1.7 cm, 체중 78.7±17.9g)를 구입하여 국립수산과학원(부산 기장군) 실내 사육실로 수송한 후 1톤 유수식 원형 FRP 수조에서 14일간 적응시켰다. 이 기간동안 수온은 21.2±0.8℃였으며, 염분은 34.0±0.2 psu였으며, DO는 7.8±0.4 mg/L 하루에 2회 상업용 배합사료를 공급하였고, 실험 24시간 전부터는 절식하였다. 실험 전까지 실험어의 폐사율은 5% 이하였다.

      >  실험조건

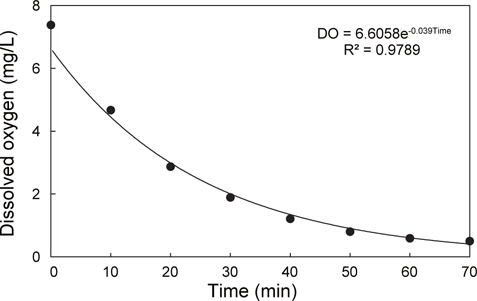
    1톤 수조에 적응시킨 실험어를 3개의 500 L 원형 FRP 수조(수용적 200 L)에 15마리를 즉시 옮겨 실험을 하였으며, 모든 수조의 수온은 19.8℃, 염분은 33.8 psu였다. 각 수조의 조건 및 실험방법은 다음과 같다. 첫 번째 수조는 대조구로, DO는 7.6 mg/ L였으며, 실험어 수조 이동 10분후에 모든 개체로부터 채혈하였다(Con.) 두 번째 수조는 실험어 수조 이동 10분후에 질소가스(N2)를 수중에 주입하여 DO를 감소시켰으며, 그 변화를 수질측정기(YSI-556NPS, USA)로 모니터링하였다. N2를 실험어가 비정상적인 유영(횡와)과 자의적인 유영이 불가능해질 때까지 일정하게 주입하였으며(1.2 L/min., 70분), 이때의 DO 농도는 0.55 mg/L로, N2주입에 따라 DO는 지수함수적으로 감소하였다(Fig. 1). N2주입이 완료되었을 때 이 수조의 실험어로부터 채혈하였다(Exp.Ⅰ: 점차적인 DO 감소). 세 번째 수조는 N2를 주입하여 DO의 농도가 0.55 mg/L로 설정한 다음, 실험어를 옮겨 10분후에 채혈하였다(Exp.Ⅱ: 급격한 DO 감소).

      >  혈액 채취 및 분석

    혈액 채취전 각 수조에 tricaine methan sulphonate (MS-222, Sigma, USA)를 150 ppm의 농도가 되도록 첨가하여 실험어를 마취하였다. heparin sodium 처리된 주사기(3 mL)를 사용하여 실험어의 미부혈관으로부터 혈액을 채취하여, 일부는 Ht 및 Hb을 측정에 사용하였으며, 나머지는 원심분리(4℃, 10,000 rpm, 15분)하여 혈장을 분리하여 분석전까지 -80℃의 초저온 냉동고에 보관하였다.

    Ht는 혈액을 모세유리관에 넣어 원심분리(10,000 rpm, 10분)하여 Ht 측정판(MICRO-HAEMATOCRIT READER, Hawksley Co, UK)으로, Hb은 Hb 자동생화학분석기(Fuji dry-chem 4000, Fujifilm Co., Japan)로 측정하였다. MCHt 및 Hb의 측정값을 바탕으로 평균적혈구혈색소농도(mean corpuscular Hb concentation, MCHC)를 다음과 같이 계산하였다.

    ·MCHC (%) = Hb (g/100 mL)/Ht (%) × 100

    혈장 코티졸은 cortisol EIA kit (Oxford, USA)를 사용하여 효소면역분석(enzyme immunoassay, EIA)로 측정하였으며, 간략히 설명하자면 다음과 같다: ethyl ether를 사용하여 혈장 100 μL로부터 cortisol을 추출한 후, 유기상(organic phase)을 분리하여 이를 N2 가스로 증발시켰다. 잔여물을 100 μL의 추출 buffer에 녹인뒤, 이중 10 μL를 다시 990 μL의 추출 buffer 에 더하여 100배로 희석시켜 이를 샘플로 사용하였다. 샘플 또는 표준용액 50 μL를 microplate에 2반복으로 넣은 후, 동량의 Cor-tisol-HRP Conjugate를 첨가하여 1시간 동안 상온에서 두었다. Microplate를 세척한 후, 150 μL TMB 기질을 각 well에 넣은후 30분 동안 반응시켜, microplate reader (ThermoScientific MultiskanSpectrum, Thermo, Finlan)로 650 nm에서 값을 측정하였다. 코티졸의 분석시 Inter-assay coefficients of variation(CV) 및 Intra-assay CV는 각각 2.8% (n=66) 및 10.5% (n=8)이었다. 혈장의 글루코스 및 AST (aspartate aminotransferase), ALT (alanine aminotransferase), 총단백질, Na+, Cl-은 자동생화학분석기로, 삼투질농도는 삼투압측정기(Vapro 5520, WESCOR Co., USA)로 측정하였다.

      >  통계분석

    실험결과의 자료값은 평균±표준오차로 나타내었으며, SPSS 통계프로그램(ver. 17.0)을 사용하여 one way-ANOVA 및 Duncan’s multiple range test 유의성을 검정하였다(P<0.05).

    결 과

      >  코티졸 및 글루코스

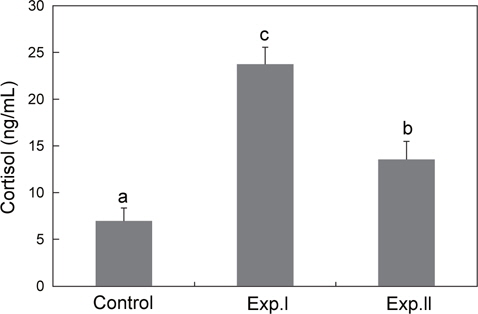
    혈장의 코티졸 농도는 대조구의 경우 6.9±1.4 ng/mL였으며, 저산소 노출은 코티졸의 농도를 유의하게 상승시켰다. 특히 점차적으로 DO를 감소한 Exp.Ⅰ은 23.7±1.8 ng/mL로 단계적으로 DO를 감소한 Exp.Ⅱ의 13±1.9 ng/mL보다 높았다(Fig. 2).

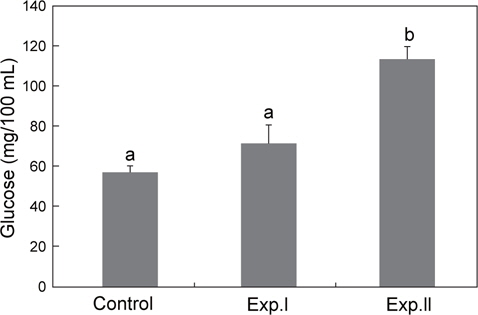
    글루코스 농도는 대조구의 경우 57.2±3.2 mg/100 mL였으며, Exp.Ⅰ 및 Ⅱ는 각각 71.5 mg/100 mL, 및 113.6 mg/100 mL로 Exp.Ⅰ은 대조구와 차이를 보이지 않았으나, Exp.Ⅱ은 대조구보다 유의하게 높았다(Fig. 3).

      >  Ht, Hb 및 MCHC

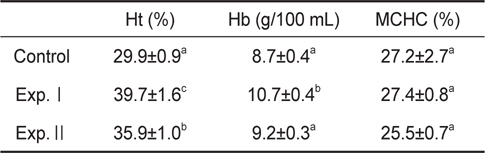
    감성돔의 저산소 노출에 따른 Ht의 변화는 Table 1에 나타내었다. 대조구의 Ht는 29.9±0.9%였으나 Exp.Ⅰ및 Ⅱ는 각각 39.7±1.6% 및 35.9±1.0%로 대조구보다 유의하게 높았으며, 또한 Exp.Ⅰ은 Exp.Ⅱ보다 높았다. Exp.Ⅰ의 Hb의 농도는 10.7±0.4 g/100 mL로 대조구의 8.7±0.4 g/100 mL로 높았으나, Exp.Ⅱ는 9.2±0.3 g/100 mL로 대조구와 차이를 보이지 않았다. 모든 실험구의 MCHC는 25.5±0.7-27.4±0.8로 그룹간 통계적인 차이가 없었다.

    [Table 1.] Levels of haematocrit (Ht), blood haemoglobin concentration (Hb) and mean corpuscular haemoglobin concentration (MCHC) in black seabram Acanthopagrus schlegelii in hypoxia

    label

    Levels of haematocrit (Ht), blood haemoglobin concentration (Hb) and mean corpuscular haemoglobin concentration (MCHC) in black seabram Acanthopagrus schlegelii in hypoxia

      >  Na+, Cl- 및 삼투질농도

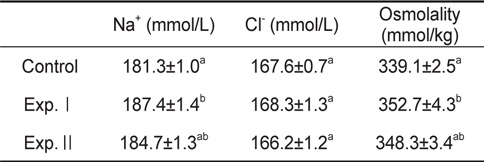
    저산소 노출에 따른 Exp.Ⅰ의 Na+는 187.4±1.4 mmol/L로 대조구의 181.3±1.0 mmol/L보다 유의하게 높았으나, Exp.Ⅱ은 184.7±1.3 mmol/L로 대조구와 차이가 없었다. 모든 실험구의 Cl-은 166.2±1.2-168.3±1.3 mmol/L 범위로 그룹간 유 의한 차이가 없었다. 삼투질농도는 Exp.Ⅰ만 대조구보다 높아 혈장 Na+와 같은 경향의 변화를 보였다(Table 2).

    [Table 2.] Levels of plasma Na+, Cl- and osmolality in black seabram Acanthopagrus schlegelii in hypoxia

    label

    Levels of plasma Na+, Cl- and osmolality in black seabram Acanthopagrus schlegelii in hypoxia

      >  AST 및 ALT

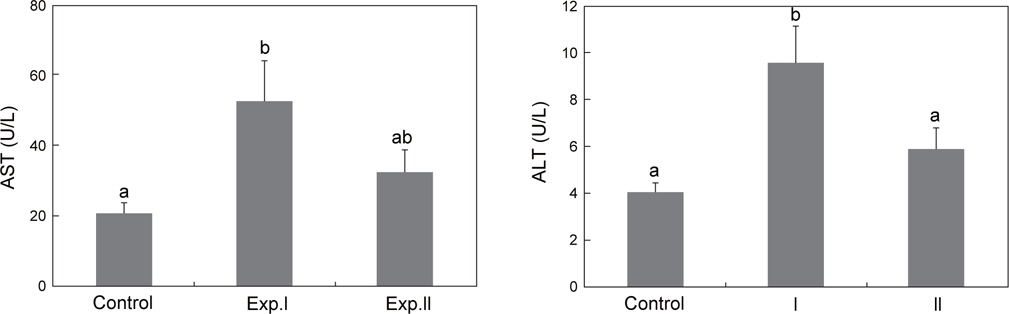
    저산소 노출에 따른 Exp.Ⅰ의 AST는 53.1±11.6 U/L로 대조구의 20.9±3.0 U/L보다 유의하게 높았지만, Exp.Ⅱ는 32.7±6.4 U/L로 대조구와 통계적인 차이는 보이지 않았다(Fig. 4A).

    Exp.Ⅰ의 ALT는 9.6±1.6 U/L로 대조구의 4.1±0.4 U/L와 Exp.Ⅱ의 5.9±0.9 U/L보다 유의하게 높았으나, Exp.Ⅱ는 대조구와 차이가 없었다(Fig. 4B).

      >  총단백질

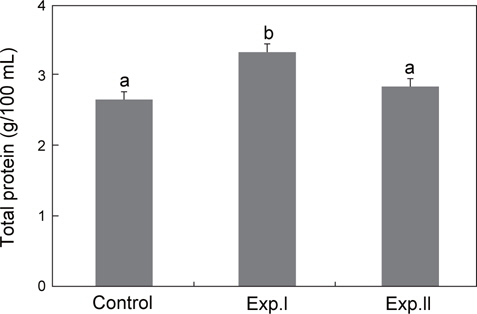
    대조구의 총단백질 농도는 2.7±0.1 g/100 mL였으며, Exp.Ⅰ은 3.4±0.1 g/100 mL로 대조구보다 높았으나, Exp.Ⅱ는 2.9±0.1 g/100 mL로 대조구와 차이가 없었다(Fig. 5).

    고 찰

    경골어류에서 코티졸은 주요 corticosteriod로 스트레스를 받는 동안 혈장의 코티졸 농도가 뚜렷하게 상승하므로, 코티졸은 주로 스트레스 지표로 이용된다(Mommsen et al., 1999). 일반적으로 안정시 또는 스트레스를 받지 않는 어류의 일반적인 코티졸 농도는 30-40 ng/mL 이지만(Wedemeyer et al., 1990), 이상적인 코티졸 농도는 5 ng/mL 이하로 나타나고 있다(Pickering and Pottinger, 1989). 감성돔의 경우, 안정시의 코티졸 농도가 10 ng/mL 이하로 밝혀져 있으며(Min et al., 2005; Chang et al., 2007; Choi et al., 2007, Park et al., 2012) 본 연구에서도 이와 비슷한 결과(대조구: 6.9 ng/mL)가 나타났다. 그러나 이러한 안정시 코티졸의 농도는 어종, 크기, 수온, 영양상태, 시간 등 많은 환경적 요인과 발달 단계에 따라 달라진다고 알려져 있다(Barton and Iwama, 1991). 본 연구에서는 저산소 노출이 실험어의 HPI 축을 활성화시켜 혈중 코티졸을 상승시킨 것으로 났으며, 특히 점차적으로 DO를 낮춘 Exp.Ⅰ에서는 23.7 ng/mL, 그리고 즉시 DO를 낮춘 Exp.Ⅱ에서는 13.5 ng/mL로 Exp.Ⅰ이 1.8배 정도 높았다. 이러한 이유는 Exp.Ⅱ는 저산소 (DO=0.55 mg/L, 포화도 7.4%) 노출후 10분 동안만 스트레스를 받았지만, Exp.Ⅰ은 DO의 어느 농도인지는 알 수가 없었나 채혈 시점 이전부터 계속해서 저산소에 따른 스트레스를 받아왔기 때문인 것으로 여겨진다. 저산소 노출에 따른 어체의 코티졸 상승은 많은 어종에서 보고되고 있다(Herbert and Steffensen, 2005; Lays et al., 2009; O'Connor et al., 2011). Lays et al. (2009)에 따르면 spotted wolffish (Anarhichas minor)의 코티졸의 농도가 저산소 노출전 5 ng/mL 정도였으며, 산소의 포화도가 40%까지는 유의한 차이를 보이지 않았으나 그 포화도가 20%에서는 약 35 ng/mL로 7배정도 증가한 반면, 본 연구의 Exp.Ⅰ에서는 산소 포화도가 7.4%일 때 코티졸 농도가 3배정도 증가한 것으로 나타난 것으로 볼 때 저산소 스트레스 유발요인에 대한 코티졸 반응이 어종에 따라 다르게 나타남을 알 수 있다. 스트레스 반응은 일반적으로 스트레스 유발요인의 종류 및 강도에 따라 다른데, 감성돔의 경우 담수로 이동하였을 때 코티졸의 농도가 약 30 ng/mL (Chang et al., 2007)였던 반면, 수온 상승시(20→30℃)에는 약 106 ng/mL (Choi et al., 2006)로 나타나 본 연구에서보다 높은 것으로 나타났다. 또한 스트레스 반응은 어종에 따라 다르며 이들의 생태형과 생활방식에 좌우된 다고 알려져 있다(Silkin and Silkina, 2005). 연안 정착성 어종인 감성돔은 본 연구를 비롯하여 여러 스트레스 유발요인 노출에 따른 코티졸 상승(Min, 2006)이 연어와 어류와 같은 유영성 어류보다 낮은 경향을 보이는데(Barton and Iwama, 1991), 정착성 어류에서 스트레스 유발요인에 대한 코티졸의 낮은 반응은 스트레스 유발요인 인지에 대하여 HPI축 내의 신경내분비 조절 때문인 것으로 보여진다(Vijayan and Moon, 1994).

    글루코스는 화학적 에너지(ATP)로 전환되어 최종적으로 기계적 에너지가 되므로 동물의 생체에너지 대사에서 주요한 역할을 한다(Lucas, 1996). 경골어류의 안정시 혈장 글루코스 농도는 어종에 따라 다양한데, 잉어, 대구 및 연어과 어류와 같이 활동성이 강한 어종에서는 54-180 mg/100 mL (West et al.,1994; Blasco et al., 2001)로 활동성이 거의 없는 rock perch (Scorpaena porcus L.) (Silkin and Silkina, 2005) 및 넙치(Paralichthys olivaceus) (Hur et al., 2007)의 경우 20 mg/100 mL 이하로 보고되고 있어 안정시 혈장 글루코스는 어종의 행동습성에 따라 구분되는 것으로 여겨진다. 본 연구 및 여러 연구(Min et al., 2006; Choi et al., 2006)에서 감성돔의 안정시 글루코스농도는 46-57 mg/100 mL로 나타나 글루코스와 행동과의 관점 에서 볼 때 감성돔은 다소 활동성이 있는 어종으로 보여지며, 활동성 어류의 혈장의 글루코스 농도가 높은 이유는 이들 뇌의 대사 요구량 충족에 필요하기 때문이다(Silkin and Silkina, 2005). 경골어류는 일반적으로 스트레스 유발요인에 노출되면 혈장 글루코스는 코티졸과 더불어 상승하며(Barton and Iwama, 1991; Nolan et al., 1999), 본 연구에서도 이러한 현상이 나타났다. 코티졸과 카테콜아민은 스트레스와 관련하여 각각 당신생합성(gluconeogenesis)과 고혈당(hyperglycemia)을 중재하는 역할을 하며(Vijayan et al., 1997; Fabbri et al., 1998), 고혈당은 스트레스로 인해 증가된 에너지 요구를 충족시키는 것으로 알려져 있다(Vijayan et al., 1997). 저산소 스트레스 유발요인에 의한 혈장 글루코스의 증가는 틸라피아(Oreochromis niloticus) (Delaney and Klesius, 2004), 시베리안 철갑상어(Acipenser baeri) (Maxime et al., 1995), 시클리드(Astronotus Ocellatus) (Muusze et al., 1998) 등 여러 어종에서 나타나고 있으며, 본 연구에서도 저산소 노출은 혈장의 글루코스(Exp.Ⅰ: 71.5 mg/100 mL, Exp.Ⅱ: 113.6 mg/100 mL) 상승을 유도하였다. 본 연구에서는 Exp.Ⅰ이 Exp.Ⅱ보다 저산소 노출시간이 많았고 이로 인해 혈장 코티졸은 Exp.Ⅰ이 Exp.Ⅱ보다 높았음에도 불구하고, 오히려 Exp.Ⅱ의 글루코스 농도가 더 높게 나타났다. 이처럼 스트레스 유발요인 노출에 대하여 글루코스의 상승이 경미하거나(Davis and McEntire 2006), 변화가 없거나 (Rotllant and Tort 1997, Jentoft et al. 2005), 감소하는 현상 (Wood et al., 1990)이 여러 연구자에 의해 보고되고 있다. 이와 같은 현상은 앞서 설명한 것처럼 어류가 스트레스 상태에서는 중추신경계의 항상성 유지를 위해 빠른 에너지 소비가 필요하기 때문에 코티졸에 의한 당신생합성보다 글루코스가 에너지원으로의 사용이 많았기 때문으로 해석되며(Martínez-Porchas et al., 2009), 이러한 이유로 Exp.Ⅰ은 Exp.Ⅱ보다 글루코스의 사용이 많았기 때문에 농도가 낮은 것으로 사료된다.

    일반적으로 혈액학적 parameters (Ht, Hb 및 백혈구수 등)의 변화는 스트레스의 2차적 반응으로 나타난다(Barton and Iwama, 1991). Ht는 혈중의 적혈구 용적을 나타내며 어종에 따라 매우 다르게 나타나는데, 글루코스와 마찬가지로 활동성이 강한 어종(sea carp, Diplodus annularis L.: 약 40%, 전갱이, Trachurus mediterraneus ponticus L.: 약 34%) (Silkin and Silkina, 2005)일수록 그 값이 높고, 활동성이 적은 어종(넙치: 약 20%, 강도다리, Platichthys stellatus: 약 16%) (Hur et al., 2007; Kim et al., 2009)에서 낮은 경향을 보인다. 본 연구에서 감성돔의 안정시 Ht는 약 30%로 활동이 적은 어종보다 상당히 많은 양의 적혈구를 가지는 것으로 확인되었고, 이것은 그 만큼 활동에 필요한 혈액의 산소수용력이 높다는 것을 의미한다. 급 성 또는 만성적 저산소 노출에 따른 Ht의 상승은 여러 경골어류에서 많이 보고되고 있다(Yamamoto et al., 1985; Wells et al., 1989; Muusze et al., 1998). Peterson (1990)에 따르면 Ht의 상승은 적혈구수의 증가를 비롯하여 적혈구 팽창, 혈장 감소 또는 이러한 요인들의 조합에 따라 나타난다고 하였다. 본 연구에서 MCHC의 결과를 보면 저산소 노출에 따른 차이가 없었는데, 이것은 Ht 상승이 적혈구의 팽창이 아닌 적혈구수 증가에 기인한다고 보여진다. 이와 관련하여 급성과 만성적 산소 노출에 따른 Ht의 상승 메카니즘은 다소 차이를 보이는데 본 연구처럼 급성 노출의 경우, 카테콜아민이 비장의 수용체를 활성화 시켜 적혈구를 혈중으로 방출시킨다(Lai et al., 2006). Ht의 증가는 혈액내 산소량을 증가시키므로, 저산소 상태 동안 Ht의 증가는 생리적으로 어체에 장점으로 작용하지만, 높은 Ht는 혈액의 점도를 높여 순환계 혈액 펌핑에 필요한 심장의 에너지량을 높이는 단점(본 연구에서 Exp.Ⅰ이 Exp.Ⅱ보다 글루코스의 낮은 이유중 하나로 보임)도 있다(Perry et al., 2009). 본 연구에서는 Exp.Ⅰ및 Ⅱ의 Ht이 대조구에 비해 각각 약 40%와 23%가 증가하였는데, 이 결과로 볼 때, 역시 Exp.Ⅰ은 Exp.Ⅱ보다 저산소에 따른 스트레스 반응이 더 컸음을 알 수 있다.

    또한 생리학적 스트레스의 2차 반응으로 물-미네랄 균형에 변화가 나타난다(Barton and Iwama, 1991). 일반적으로 척추 동물은 체내에 일정한 염분을 유지함으로써 세포 내외의 이온경사를 유지한다. 이러한 이유로 어류는 끊임없이 삼투압 조절작용을 하는데, 어류는 해수와 담수에서 그 차이를 보인다. 해수어류의 경우 체내의 일정한 삼투질 농도를 유지하기 위하여 이온은 방출하고, 물은 흡수하는 저삼투압조절 능력을 가진다(Min et al., 2009). 따라서 어류에 있어 수온상승, 감금 등 스트레스 유발요인 노출은 이러한 삼투압조절에 혼란을 야기 시켜 혈장의 Na+, Cl- 및 삼투질농도의 변화를 초래한다(Nolan et al., 1999; Choi et al., 2007). 본 연구에서 Exp.Ⅰ은 혈장 Cl-에는 영향을 미치지 않았으나 혈장 Na+ 및 삼투질농도를 상승시켜 지속적인 저산소 노출은 어체의 삼투압조절 장애를 유발하였다. 척추동물에서 AST 및 ALT는 아미노전이효소로 이들의 혈중농도는 일반적으로 간기능 지수이며, 또한 수온변화, 저산소, pH, 암모니아, 중금속에 의한 스트레스 반응으로도 사용된다(Pan et al., 2003). 본 연구의 Exp.Ⅰ에서는 AST 및 ALT의 상승은 간세포에 손상이 나타났음을 의미하나, Exp.Ⅱ에서는 대조구와 비교해 변화가 없었다. 이것은 Exp.Ⅰ이 Exp.Ⅱ보다 간세포 손상에 영향을 미칠 만큼 저산소 노출이 길었으며, 또한 Exp.Ⅱ에서 같이 급격한 저산소 노출후 적어도 10분 이내에는 간세포 손상에 변화가 없다는 것을 의미한다.

    혈장의 총단백질 농도는 육상 및 수서생물의 건강, 스트레스 및 웰빙을 나타내는 광범위한 임상 지표로 이용되며(Riche, 2007), 스트레스 반응에 따른 혈장 단백질의 상승은 단백질 대사에 코티졸의 영향으로 나타난다(Van der Boon et al., 1991). 본 연구에서 지속적인 저산소 노출은 혈장 단백질 상승을 초래한 반면, 급격한 노출에서는 변화가 없었는데, 이 같은 결과는 AST 및 ALT의 변화와 같은 맥락으로 해석이 된다.

    이상의 결과를 종합해 보면, 감성돔의 급격한 저산소 노출은 스트레스의 1차적 반응으로 혈장 코티졸 상승을, 2차적 반응으로 글루코스, Ht, 이온, 삼투질 농도, AST, ALT 및 총단백질의 상승을 유발하였다. 본 연구와 관련하여 앞으로는 저산소 노출시 DO 농도에 따른 어체의 스트레스 반응을 어체의 크기를 비롯하여 다양한 환경조건(수온, 염분 등)에 따라 조사해야 할 것 으로 보인다.

참고문헌
  • 1. Barton BA, Iwama GK 1991 Physiological changes in fish fromstress in aquaculturewith emphasis on the response and effects of corticosteroids [Ann Rev Fish Dis] Vol.1 P.3-26 google cross ref
  • 2. Blasco J, Marimon I, Viaplana I, Fernandez-Borras J 2001 Fate of plasma glucose in tissues of brown trout in vivo: ef­fects of fasting and glucose loading [Fish Physiol Biochem] Vol.24 P.247-258 google cross ref
  • 3. Caldwell CA, Hinshaw J 1994 Physiological and haemato­logical responses in rainbow trout subjected to supplemental dissolved oxygen in fish culture [Aquaculture] Vol.126 P.183-193 google cross ref
  • 4. Chabot D, Dutil JD 1999 Reduced growth of Atlantic cod in non-lethal hypoxic conditions [J Fish Biol] Vol.55 P.472-491 google cross ref
  • 5. Chang YJ, Min BH, Choi CY 2007 Black porgy (Acan­thopagrus schlegeli) prolactin cDNA sequence: mRNA expression and blood physiological responses during fresh­water acclimation [Comp Biochem Physiol B] Vol.147 P.122-128 google cross ref
  • 6. Choi CY, Min BH, Kim NN, Cho SH, Chang YJ 2006 Ex­pression of HSP90 HSP70 mRNA and change of plasma cortisol and glucose during water temperature rising in freshwater adapted black porgy, Acanthopagrus schlegeli [J Aquac] Vol.19 P.315-322 google
  • 7. Choi CY, Min BH, Jo PG, Chang YJ 2007 Molecular clon­ing of PEPCK and stress response of black porgy (Acan­thopagrusschlegeli) to increased temperature in freshwater and seawater [Gen Comp Endocrinol] Vol.152 P.47-53 google cross ref
  • 8. Chrousos GP, Gold PW 1992 The concepts of stress and stress system disorders [J Am Med Assoc] Vol.267 P.1244-1252 google cross ref
  • 9. Davis KB 2006 Management of physiological stress in finfish aquaculture [North Am J Aquaculture] Vol.65 P.116-121 google
  • 10. Davis KB, McEntire ME 2006 Comparison of the cortisol and glucose stress response to acute confinement and rest­ing insulin-like growth factor-I concentrations among white bass, striped bass and sunshine bass. Aquaculture America Book of Abstracts P.79 google
  • 11. Delaney MA, Klesius PH 2004 Hypoxic conditions induce Hsp70 production in blood brain and head kidney of ju­venile Nile tilapia Oreochromis niloticus (L.) [Aquaculture] Vol.236 P.633-644 google cross ref
  • 12. Fabbri E, Capuzzo A, Moon TW 1998 The role of circulat­ing catecholamines in the regulation of fish metabolism: an overview [Comp Biochem Physiol C] Vol.120 P.177-192 google
  • 13. Herbert N, Steffensen J 2005 The response of Atlantic cod Gadus morhua to progressive hypoxia: fish swimming speed and physiological stress [Mar Biol] Vol.147 P.1403-1412 google cross ref
  • 14. Hur JW, Park IS, Chang YJ 2007 Physiological response of the olive flounder Paralichthys olivaceus to a series stress during the transportation process [Ichtyol Res] Vol.54 P.32-37 google cross ref
  • 15. Iwama GK, Afonso LOB, Vijayan MM., Evans DH, Claiborne JB 2006 The Physiology of Fishes P.319-342 google
  • 16. Jentoft S, Aastveit, AH, Torjesen PA, Andersen O 2005 Effects of stress on growth, cortisol and glucose levels in non-domesticated Eurasian perch (Perca fluviatilis) and domesticated rainbow trout (Oncorhynchus mykiss) [Comp Biochem Physiol A] Vol.141 P.353-358 google cross ref
  • 17. Kim YS, Do YH, Min BH, Lim HK, Lee BK, Chang YJ 2009 Physiological responses of starry flounder Platichthys stellatus during freshwater acclimation with different speeds in salinity change [J Aquac] Vol.22 P.28-33 google
  • 18. Lai JCC, Kakuta I, Mok HOL, Rummer JL, Randall D 2006 Effects of moderate and substantial hypoxia on eryth­ropoietin levels in rainbow trout kidney and spleen [J Exp Biol] Vol.209 P.2734-2738 google cross ref
  • 19. Lays N, Iversen MMT, Frantzen M, Jorgensen EH 2009 Physiological stress responses in spotted wolffish (Anarhi­chas minor) subjected to acute disturbance and progressive hypoxia [Aquaculture] Vol.295 P.126-133 google cross ref
  • 20. Lucas A., Lucas A 1996 Physical concepts of bioenergetics google
  • 21. Martinez-Porchas M, Martinez-Cordova LR, Ramos-En­riquez R 2009 Cortisol and glucose: Reliable indicators of stress? [Pan Am J Aquat Sci] Vol.4 P.158-178 google
  • 22. Maxime V, Nonnotte G, Peyraud C, Williot P, Truchot JP 1995 Circulatory and respiratory effects of an hypoxic stress in the Siberian sturgeon [Respir Physiol] Vol.100 P.203-212 google cross ref
  • 23. Min BH 2006 Blood Physiological and Molecular Endocrino­logical Studies on Osmoregulation of Black Porgy (Acan­thopagrus schlegeli; Teleostei) Acclimated in Freshwater. Ph.D. Thesis google
  • 24. Min BH, Choi CY, Chang YJ 2005 Comparison of physi­ological conditions on black porgy Acanthopagrus schlegeli acclimated and reared in freshwater and seawater [J Aquac] Vol.18 P.37-44 google
  • 25. Min BH, Lim HK, Chang YJ, Kim YS, Myeong JI 2009 Effects of 353'-triiodothyronine (T3) on osmoregulation following freshwater acclimation in starry flounder [Dev Reprod] Vol.13 P.313-320 google
  • 26. Min BH, Noh GA, Jeong MH, Kang DY, Choi CY, Bang IC, Chang YJ 2006 Effects of oral administration of thy­roid hormone on physiological activity and growth of black porgy reared in freshwater or seawater [J Aauac] Vol.19 P.149-156 google
  • 27. Mommsen TP, Vijayan MM, Moon TW 1999 Cortisol in teleosts: dynamic mechanisms of action and metabolic regulation [Rev Fish Biol Fish] Vol.9 P.211-268 google cross ref
  • 28. Muusze B, Marcon J, van den Thillart G, Almeida-Val V 1998 Hypoxia tolerance of Amazon fish Respirometry and energy metabolism of the cichlid Astronotus Ocellatus [Comp Biochem Physiol A] Vol.120 P.151-156 google cross ref
  • 29. Nolan DT, Op't Veld RLJM, Balm PHM, Wendelaar Bonga SE 1999 Ambient salinity modulates the response of the tilapia Oreochromis mossambicus (Peters) to net confine­ment [Aquaculture] Vol.177 P.297-309 google cross ref
  • 30. 2009 Handbook on Oceanography, Marine Environ­ment and Harmful Marine Organisms P.108-113 google
  • 31. O’Connor EA, Pottinger TG, Sneddon LU 2011 The effects of acute and chronic hypoxia on cortisol glucose and lactate concentrations in different populations of three-spined stick­leback [Fish Physiol Biochem] Vol.37 P.461-469 google cross ref
  • 32. Pan CH, Chien YH, Hunter B 2003 The resistance to am­monia stress of Penaeus monodon Fabricius juvenile fed diets supplemented with astaxanthin [J Exp Mar Biol Ecol] Vol.297 P.107-118 google cross ref
  • 33. Park MS, Min BH, Moon TS, Lim HK, Choi CY, Chang YJ, Kho KH 2012 Osmoregulatory ability and stress re­sponses during freshwater adaptation of black porgy (Ac­anthopagrus schlegeli) treated with exogenous prolactin [Aquac Res] Vol.43 P.1891-1899 google cross ref
  • 34. Perry SF, Esbaugh A, Braun M, Gilmour KM., Glass ML, Wood SC 2009 Gas Transport and Gill Function in Water Breathing Fish P.5-35 google
  • 35. Peterson MS. 1990 Hypoxia-induced physiological changes in two mangrove swamp fishes: sheepshead minnow Cyprin­odon variegatus lacepede and sailfin molly Poecilia latipin­na (Lesueur) [Comp Biochem Physiol A] Vol.97 P.17-21 google cross ref
  • 36. Pickering AD, Pottinger TG 1989 Stress responses and dis­ease resistance in salmonid fish: Effects of chronic elevation of plasma cortisol [Fish Physiol Biochem] Vol.7 P.253-258 google cross ref
  • 37. Riche M. 2007 Analysis of refractometry for determining total plasma protein in hybrid striped bass (Morone chrysops × M. saxatilis) at various salinities [Aquaculture] Vol.264 P.279-284 google cross ref
  • 38. Rotllant J, Tort L 1997 Cortisol and glucose responses after acute stress by net handling in the sparid red porgy previ­ously subjected to crowding stress [J Fish Biol] Vol.51 P.21-28 google cross ref
  • 39. Silkin YA, Silkina EN 2005 Effect of hypoxia on physio­logical-biochemical blood parameters in some marine fish [J Evolut Biochem Physiol] Vol.41 P.527-532 google cross ref
  • 40. Smit GL, Hattingh J 1978 The effect of respiratory stress on carp haemoglobin [Comp Biochem Physiol A] Vol.59 P.369-374 google cross ref
  • 41. Sun H, Li J, Tang L, Yang Z 2012 Responses of crucian carp Carassius auratus to long-term exposure to nitrite and low dissolved oxygen levels [Biochem Syst Ecol] Vol.44 P.224-232 google
  • 42. Van der Boon J, van den Thillart GEEJM, Addink ADF 1991 The effects of cortisol administration on intermediary metabolism in teleost fish [Comp Biochem Physiol A] Vol.100 P.47-53 google cross ref
  • 43. Van Raaij MTM, Bakker E, Nieveen MC, Zirkzee H, van den Thillart GEEJM 1994 Energy status and free fatty acid patterns in tissues of common carp (Cyprinus carpio L.) and rainbow trout (Oncorhynchus mykiss L.) during severe oxygen restriction [Comp Biochem Physiol A] Vol.109 P.755-767 google cross ref
  • 44. Vijayan MM, Moon TW 1994 The stress response and the plasma disappearance of corticosteroid and glucose in a ma­rine teleost the sea raven [Can J Zool] Vol.72 P.379-386 google cross ref
  • 45. Vijayan MM, Pereira CE, Grau G, Iwama GK 1997 Meta­bolic responses associated with confinement stress in tilapia: the role of cortisol [Comp Biochem Physiol C] Vol.116 P.89-95 google cross ref
  • 46. Wedemeyer GA, Barton BA, McLeay DJ., Schreck CB, Moyle PB 1990 Stress and acclimation P.451-489 google
  • 47. Wells RMG, Grigg GC, Beard LA, Summers G 1989 Hy­poxic responses in a fish from a stable environment: blood oxygen transport in the antarctic fish Pagothenia borch­grevinki [J Exp Biol] Vol.141 P.97-111 google
  • 48. Wendelaar Bonga SE 1997 The stress response in fish [Physiol Rev] Vol.77 P.591-625 google
  • 49. West TG, Brauner CJ, Hochachka PW 1994 Muscle glu­cose utilization during sustained swimming in the carp (Cyprinus carpio) [Am J Physiol] Vol.267 P.R1226-R1234 google
  • 50. Wood CM, Walsh PJ, Thomas S, Perry SF 1990 Control of red blood cell metabolism in rainbow trout after exhaustive exercise [J Exp Biol] Vol.154 P.491-507 google
  • 51. Yamamoto K, Itazawa Y, Kobayashi H 1985 Direct obser­vations offish spleen by an abdominal window method and its application to exercised and hypoxic yellowtail [Jap J Ich­thyol] Vol.31 P.427-433 google
OAK XML 통계
이미지 / 테이블
  • [ Fig. 1. ]  Profile of dissolved oxygen of hypoxia treatment (Exp. I) for black seabream Acanthopagrus schlegelii.
    Profile of dissolved oxygen of hypoxia treatment (Exp. I) for black seabream Acanthopagrus schlegelii.
  • [ Fig. 2. ]  Levels of plasma cortisol in black seabram Acanthopagrus schlegelii in hypoxia. Values are mean±S.E.M. (n=13-15). Exp. Ⅰ: progressive stepwise decline of DO, Exp. Ⅱ: directly decline of DO. Different letters denote significant difference (P<0.05) between groups.
    Levels of plasma cortisol in black seabram Acanthopagrus schlegelii in hypoxia. Values are mean±S.E.M. (n=13-15). Exp. Ⅰ: progressive stepwise decline of DO, Exp. Ⅱ: directly decline of DO. Different letters denote significant difference (P<0.05) between groups.
  • [ Fig. 3. ]  Levels of plasma glucose in black seabram Acanthopagrus schlegelii in hypoxia. Values are mean±S.E.M. (n=15). Exp.Ⅰ: progressive stepwise decline of DO, Exp.Ⅱ: directly decline of DO. Different letters denote significant difference (P<0.05) between groups.
    Levels of plasma glucose in black seabram Acanthopagrus schlegelii in hypoxia. Values are mean±S.E.M. (n=15). Exp.Ⅰ: progressive stepwise decline of DO, Exp.Ⅱ: directly decline of DO. Different letters denote significant difference (P<0.05) between groups.
  • [ Table 1. ]  Levels of haematocrit (Ht), blood haemoglobin concentration (Hb) and mean corpuscular haemoglobin concentration (MCHC) in black seabram Acanthopagrus schlegelii in hypoxia
    Levels of haematocrit (Ht), blood haemoglobin concentration (Hb) and mean corpuscular haemoglobin concentration (MCHC) in black seabram Acanthopagrus schlegelii in hypoxia
  • [ Table 2. ]  Levels of plasma Na+, Cl- and osmolality in black seabram Acanthopagrus schlegelii in hypoxia
    Levels of plasma Na+, Cl- and osmolality in black seabram Acanthopagrus schlegelii in hypoxia
  • [ Fig. 4. ]  Levels of plasma AST (A) and ALT (B) in black seabram Acanthopagrus schlegelii in hypoxia. Values are mean±S.E.M. (n=15). Exp.Ⅰ: progressive stepwise decline of DO, Exp.Ⅱ: directly decline of DO. Different letters denote significant difference (P<0.05) between groups. between groups.
    Levels of plasma AST (A) and ALT (B) in black seabram Acanthopagrus schlegelii in hypoxia. Values are mean±S.E.M. (n=15). Exp.Ⅰ: progressive stepwise decline of DO, Exp.Ⅱ: directly decline of DO. Different letters denote significant difference (P<0.05) between groups. between groups.
  • [ Fig. 5. ]  Levels of total protein in black seabram Acanthopagrus schlegelii in hypoxia. Values are mean±S.E.M. (n=15). Exp.Ⅰ: progressive stepwise decline of DO, Exp.Ⅱ: directly decline of DO. Different letters denote significant difference (P<0.05) between groups.
    Levels of total protein in black seabram Acanthopagrus schlegelii in hypoxia. Values are mean±S.E.M. (n=15). Exp.Ⅰ: progressive stepwise decline of DO, Exp.Ⅱ: directly decline of DO. Different letters denote significant difference (P<0.05) between groups.
(우)06579 서울시 서초구 반포대로 201(반포동)
Tel. 02-537-6389 | Fax. 02-590-0571 | 문의 : oak2014@korea.kr
Copyright(c) National Library of Korea. All rights reserved.