Amaranths (
Analyses of genetic diversity and population structure are important, not just for amaranths, but for many crops, and such studies have direct benefits in research on evolution and plant breeding (Chung and Park, 2010). Many molecular markers have been used to analyze diversity, such as restriction fragment length polymorphisms (RFLPs), amplified fragment length polymorphisms (AFLPs), simple sequence repeats (SSRs), and single nucleotide polymorphisms (SNPs; Bao et al., 2006; Cheng et al., 2011; Feltus et al., 2004; Jin et al., 2010; Li et al., 2012; Liang et al., 1994; Nagaraju et al., 2002; Zhao et al., 2009). Different marker systems have been used to investigate genetic diversity (Tam et al., 2005), and random amplified polymorphic DNA (RAPD) markers and SSRs have been applied to study the genetic diversity and phylogenetic relationships among
Amaranths have superior nutrition, drought tolerance, disease and pest resistance, and production yield, making these native Americian crops more attractive for cultivation in developing countries and increasing their rate of consumption in recent years (Ray and Roy, 2009). Varying amounts of outcrossing and frequent interspecific and intervarietal hybridization of amaranths have resulted in a large variety of amaranth genotypes (Ray and Roy, 2009). Due to their complex genetic background, amaranths show tremendous adaptability to different ecogeographic situations (Lee et al., 2008). and have evolved many characteristics adapted to different environments, such as cold, drought, and salinity resistance.
Understanding the genetic diversity and polymorphism of
Eighty two accessions belonging to 29 species were genotyped using 14 SSRs (Table 1). All plant materials including 74 accessions from the U.S. and 8 accessions from Australia were obtained from the National Genebank of the Rural Development Administration, Republic of Korea (RDA-Genebank).
[Table 1.] The 82 amaranth accessions used in this study
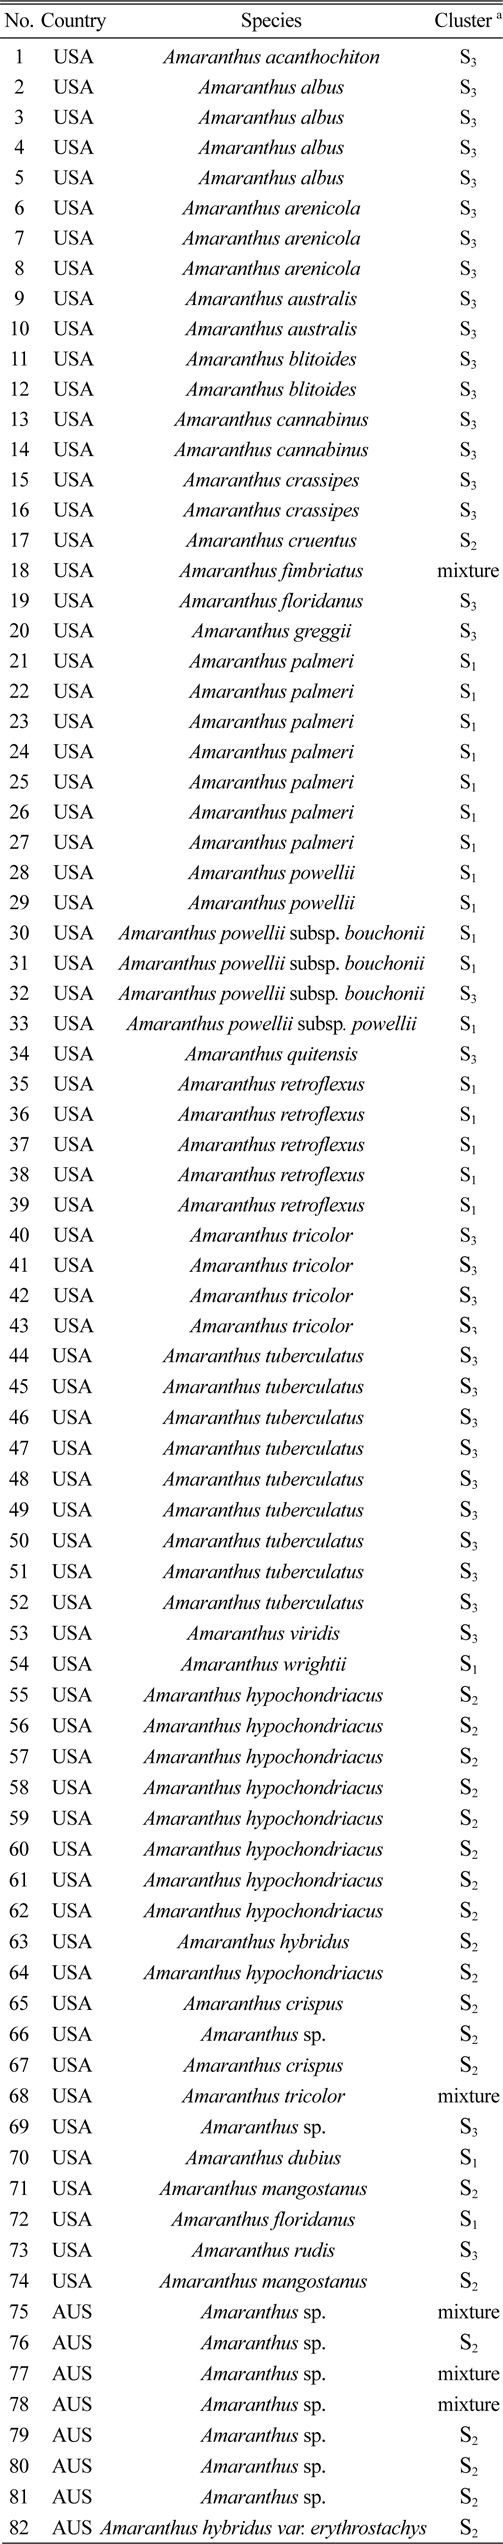
The 82 amaranth accessions used in this study
Total DNA was extracted from all accessions using a DNA extraction kit (Qiagen, Seoul, Republic of Korea). Fourteen polymorphic SSR markers developed by Lee et al. (2008) were used in this study. The M13-tail polymerase chain reaction (PCR) method (Schuelke, 2000) was used to measure the size of the PCR products, as described previously(Lee et al., 2008). Using GeneScan 3.7 (Applied Biosystems, Foster City, CA, USA ), the SSR alleles were resolved on an ABI Prism 3100 DNA sequencer (Applied Biosystems) and sized precisely using GeneScan 500 ROX (6-carbon-X-rhodamine) molecular size standards (35–500 bp; Applied Biosystems).
The data were analyzed statistically using the PowerMarker V3.23 genetic analysis package (Liu and Muse, 2005) to measure the diversity at each microsatellite locus, including the total number of alleles (NA), allele frequency, major allele (allele with the highest frequency), accession-specific alleles, and polymorphism information content (PIC). Genetic distances between each pair of accessions were determined by calculating the shared allele frequencies using PowerMarker V3.23. The unweighted pair group method with arithmetic mean (UPGMA) tree and neighbor joining method (NJ) were constructed from the shared allele frequencies using MEGA 4.0 embedded in PowerMarker.
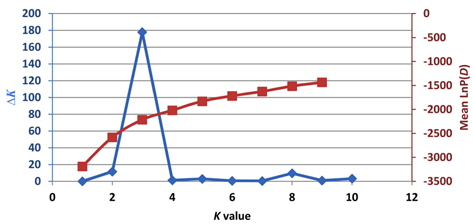
Population structure and the identification of admixed individuals were determined using the Structure modelbased software program (Pritchard et al., 2000). In this model, a number of populations (
All loci are assumed to be independent, and each
The value of
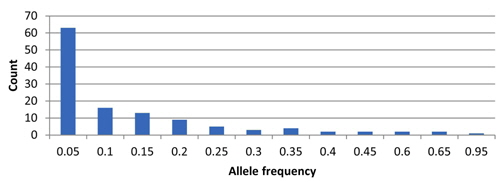
In total, 122 alleles were observed among the 82 amaranth accessions at 14 SSR loci, ranging from 4 (78N) to 14 (104H and 99N) alleles per accession, with an average of eight alleles per locus. The database of allele frequencies showed that rare alleles (frequency < 0.05) comprised 51.6% of all detected alleles, whereas intermediate (frequency 0.05–0.50) and abundant (frequency > 0.50) alleles comprised 44.3% and 4.1%, respectively (Table 2, Fig. 1). The average major allele frequency was 0.44, ranging from 0.16 in 99N to 0.93 in 78N, and the expected heterozygosity was 0.69, ranging from 0.11 in 78N to 0.90 in 99N. The average PIC was 0.65, which indicated that the 14 SSR markers exhibit good polymorphism across the accessions (Table 2).
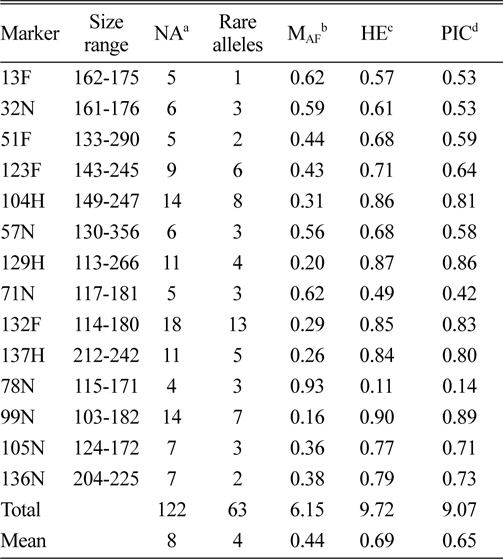
Size range, number of alleles, number of rare alleles, major allele frequency, expected heterozygosity, and polymorphism information content index for 14 simple sequence repeat loci in 82 accessions, including eight Australian accessions.
>
Genetic diversity and population structure analysis
Previously, Pritchard et al. (2000) used a model-based method to analyze the population structure and identify admixed individuals. Unfortunately, the estimated likelihood values do not indicate the exact value of
The genetic diversity analysis of the 82 amaranth accessions indicated an average of 8.64 alleles in accessions from the United States and 2.64 for Australia, with an overall average of 5.64. The major allele in the Australian accessions was more frequent than in U.S. accessions, while the opposite was true for the PIC.
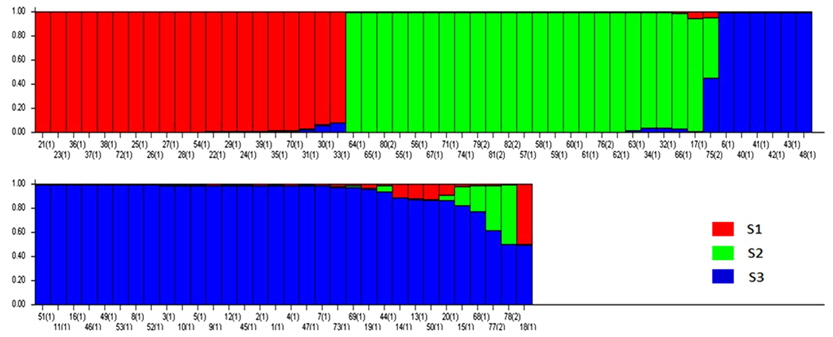
Based on the structure results, most of the 82 accessions were clearly classified into three subpopulations. Clusters 1–3 included 20, 23, and 34 accessions, respectively. Only five accessions were admixtures: three from Australia and two from the United States. Of the three subpopulations, Cluster 3 has the highest allele numbers and PIC values, while Cluster 2 had the lowest. The
[Table 3.] Characterization of polymorphism for each country.
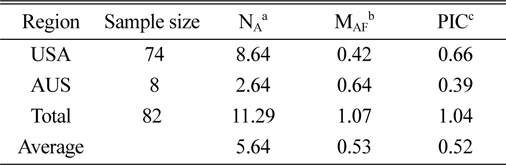
Characterization of polymorphism for each country.
[Table 4.] The diversity information and FST value of the three cluster.
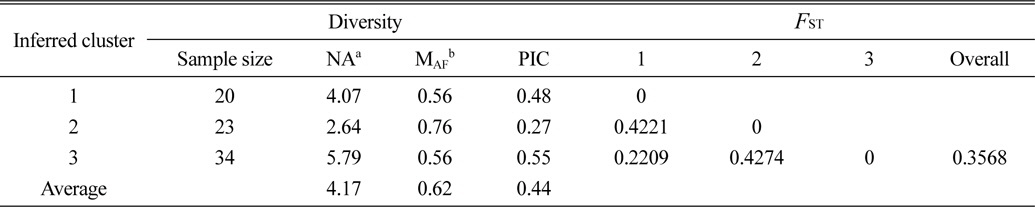
The diversity information and FST value of the three cluster.
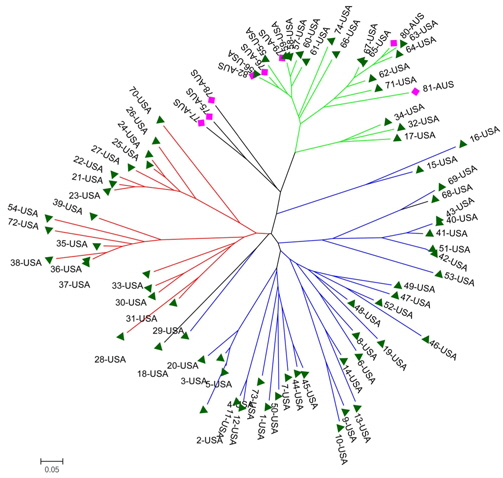
A genetic distance-based analysis was performed by calculating the shared allele frequencies among the 82 accessions. An unrooted phylogram was computed using MEGA 4 (Tamura et al., 2007) embedded in the PowerMarker program (Liu and Muse, 2005). The NJ tree clustered all accessions into three main groups with a few exceptions. As shown in Fig. 4, 82 amaranth accessions were distributed among the three groups which were consistent with the results of structure. Admixtures were marked with black color. Most of the accessions from the same species were clustered into the same group.
Generally, a narrow genetic base and low genetic diversity are detrimental to a breeding program (Wolfe, 1985). Although only 74 accessions from the United States were evaluated in this study, 122 alleles were detected and the PIC was high. Therefore, we concluded that the United States, which is near the center of origin of