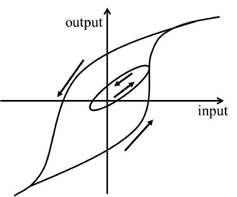
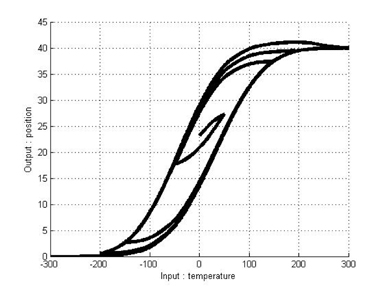
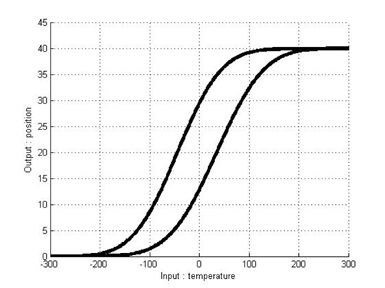
Hysteresis is a phenomenon that has long been observed in a wide variety of physical systems, including mechanical hysteresis, magnetic hysteresis, and material hysteresis. For instance, hysteresis displayed by shape memory alloy (SMA) during the process of a phase transition is an example of hysteresis in a mechanical system [1]. There is no precise agreement in the literature regarding the definition of hysteresis. In this paper, we follow the definition proposed by Mayergoyz [2]. According to this definition, a system is said to be hysteretic if its input-output relationship is a multi-branch nonlinearity. Figure 1 shows a typical hysteresis nonlinearity.
Modeling of hysteresis nonlinearity is an important goal of research in the field of hysteresis. For several decades, various models for hysteresis have been developed, such as the Preisach model [3] and Duhem model [4]. The Duhem model is a classical nonlinear dynamic model, whereas the Preisach model is not a dynamic model. Additionally, the Duhem model satisfies the properties of hysteresis, such as memory and rate-independence. Moreover, the Duhem model is able to tune the minor loop shapes independently from the major loop shapes. This increases the usefulness of the Duhem model in describing complicated minor loops. Hence, this model has been widely used to describe hysteretic systems, and many other models of hysteresis are related to the Duhem model [5]. For example, the Bouc-Wen model [6, 7] as well as the Coleman-Hodgdon model [8] are special cases of the Duhem model. The Chua-Stromsmoe model [9] is a generalization of the Duhem model.
The hysteresis phenomenon is a typical nonlinear system. Hence, it is impossible to apply various linear system theories, and it is difficult to analyze a hysteresis system, even though the Duhem model expresses the dynamics of hysteresis well. To solve this problem, we propose a dynamic hysteresis model based on a Takagi-Sugeno (T-S) fuzzy model to express the local dynamics of a Duhem model with a linear system model. The proposed T-S fuzzy Duhem model is achieved by fuzzy blending of the linear system model. By using the proposed model,wecanapplyvariouslinearsystemtheoriestoadynamic hysteresis model.
The remainder of this paper is organized as follows. In Section 2, we explain hysteresis and its properties. In Section 3, the dynamics of the Duhem model are introduced. Section 4 presents the proposed T-S fuzzy Duhem model. Simulated results verifying the applicability of the proposed model are provided in Section 5. Concluding remarks are presented in the final section.
2. Hysteresis and Its Properties
Hysteresis arises in diverse physical systems, including mechanical hysteresis, magnetic hysteresis, and material hysteresis. The word “hysteresis” has been derived from the Greek word “hysterein,” which connotes lag, and hysteretic systems are generally described as having memory. Although there is no precise definition of hysteresis, our work follows the definition proposed by Mayergoyz. According to Mayergoyz, a system is said to be hysteretic if its input-output relationship is a multi-branch nonlinearity for which transitions from a branch to another branch occur at input extrema.
Hysteresis has several properties. These properties are regarded as inherent to hysteresis or as necessary conditions for a system to display hysteresis. Two of the most important properties of hysteresis are memory and rate-independence.
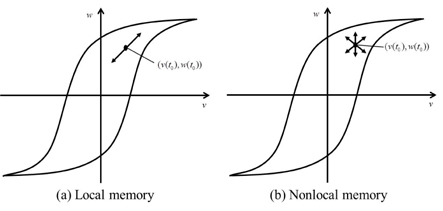
Mayergoyz has said that hysteresis can be regarded as nonlinearity with memory. Memory implies that the output may depend not only on the input but also on the previous evolution of the input. According to Mayergoyz, all hysteresis nonlinearities can be classified into two categories: hysteresis nonlinearities with local memories and hysteresis nonlinearities with nonlocal memories. For the hysteresis nonlinearities with local memories, the future output depends uniquely upon the future input for any given output. Figure 2(a) shows that the graph can follow only one path if the input increases and only one path if the input decreases. However, for the hysteresis nonlinearities with nonlocal memories, the future output depends not only upon the current output and future input but also on thepasthistoryofinputextremumvalues. Hence,thegraphcan trace any number of paths, depending on the previous evolution of input, as shown in Figure 2(b).
The decisive characteristic differentiating hysteretic nonlinearities from all other systems with memory is the rateindependence property. Hysteresis is said to be rate-independent if the rate of change of input has no influence on branching, while variation in the branches of the hysteresis nonlinearity are determined only by the past extremumof the input. These properties often determine whether a hysteresis model is suitable for representing a system or not [5].
Many different mathematical models have been developed to express hysteresis nonlinearity, such as the Preisach model, Duhem model, Bouc-Wen model, and Chua-Stromsmoe model. Considering the usefulness of the dynamics provided by models and the capability of satisfying the above-mentioned properties, we chose a classical Duhem model to design the hysteresis model based on T-S fuzzy models.
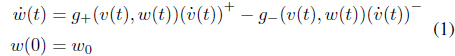
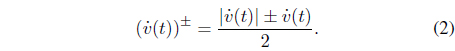
The Duhem model is a differential-equation-based hysteresis model. For any differentiable hysteresis input

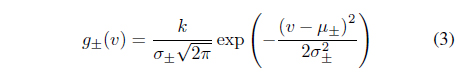
The slopes of the hysteresis curves can be determined by slope functions

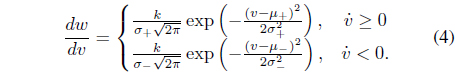
By using the Duhem model with the appropriate slope functions for both increasing and decreasing conditions, we can model the hysteresis. Consequently, how to choose suitable slope functions is key for successful modeling using the Duhem model. The literature [1] proposes the use of Gaussian probability density functions (PDFs) as slope functions for the Duhem model, which is given by

where

where
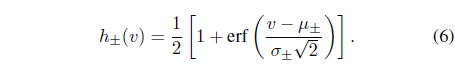
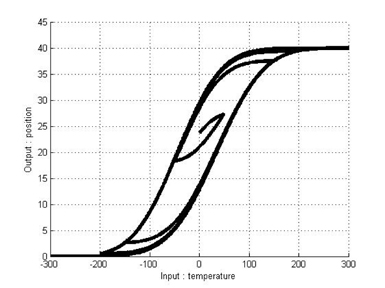
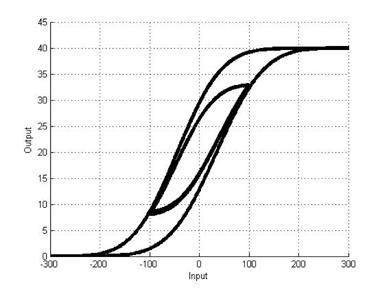
Figure 3 shows an example of hysteresis curves modeled by the Duhem model with Gaussian PDF slope functions. These curves consist of a major loop and a minor loop.
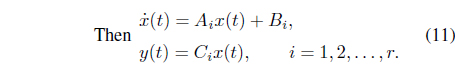
In Eqs. (5) and (6), the Duhem model is expressed in the form of differential dynamic equations. Because these dynamics consist of nonlinear functions, various linear system theories and analysis techniques cannot be applied to the hysteresis system. To solve this problem, we propose a T-S fuzzy Duhem model, which expresses the local dynamics of the Duhem model by a linear system model. As expressed in [10], the

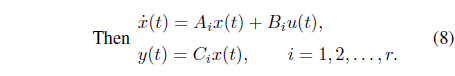
Here,
By modifying the differential equation of the Duhem model, we can apply a T-S fuzzy model to the Duhem model. Eq. (5) can be modified as
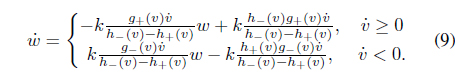
We define

where
There are two approaches for constructing a fuzzy model. The identification approach, which uses input-output data, is suitable for plants that are too difficult to be expressed as analytical models. On the other hand, when a nonlinear dynamic model is obtainable, a fuzzy model can be modeled by a derivation from the given nonlinear system equations. Indeed, if we know the nominal values of the parameters
By using the proposed T-S fuzzy Duhem model, we can express the hysteretic system with a sublinear dynamic system. In fact, it is proven that T-S fuzzy models are universal approximators and used for various application in [11–15].
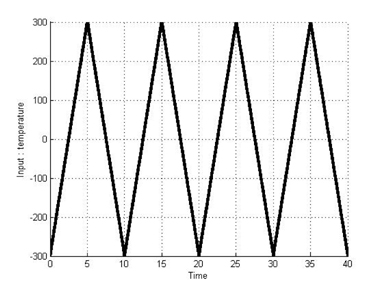
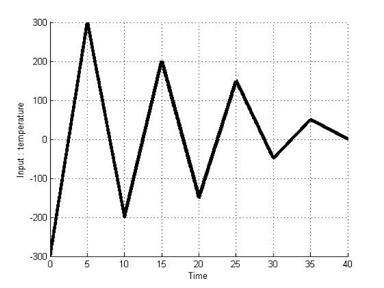
This section presents a simulation of the T-S fuzzy Duhem model with models of SMA actuators. SMAs are metallic alloys that display the shape memory effect. When SMAs are cooled or heated to a different temperature, phase transitions can occurred. During the process of the phase transition, SMAs exhibit a hysteretic transformation. To demonstrate the effectiveness of the proposed method, we compare the simulation results for modeling using the Duhem model with those using the T-S fuzzy Duhem model. Simulations for two cases were executed to verify the applicability of the T-S fuzzy Duhem model. The first case is that the hysteresis curve displays only a major loop. The second case is that the hysteresis curve displays both a major loop and minor loop. Figures 4 and 5 show the temperature input signal used in the simulations. The range of the input is [−300 300]. Table 1 shows the parameter values used in this modeling simulation. These parameters are obtained from the literature [16].
[Table 1.] Simulation parameters
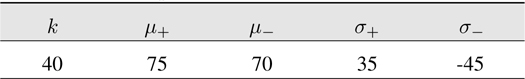
Simulation parameters
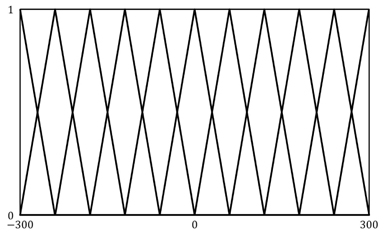
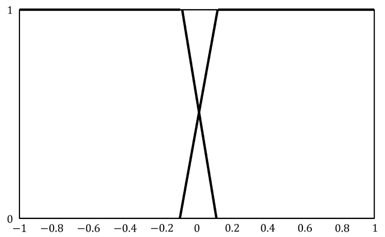
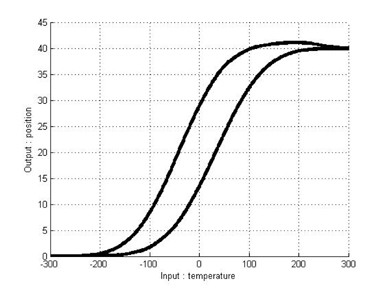
As mentioned above,we can model the hysteresis of an SMA actuator by using the classical Duhem model. Under the above parameters and equations, hysteresis curves modeled by the classical Duhem model are shown in Figures 6 and 7. Because an identification approach is chosen to construct T-S fuzzy systems, input-output pairs should be obtained. We can obtain input-output pairs from the simulation results for the classical Duhem model and construct a T-S fuzzy system with the data. Eleven fuzzy sets are defined as fuzzy sets of the first input
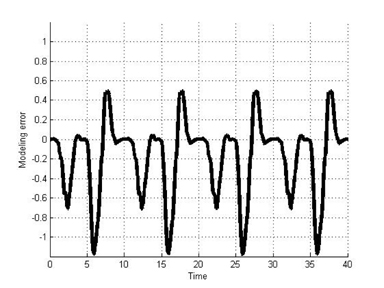
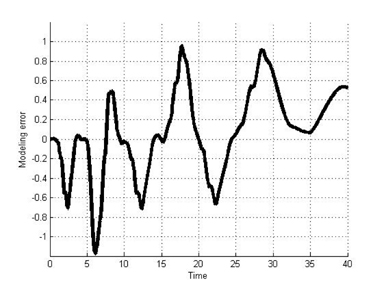
The results in Figures 10 and 11 exhibit the hysteresis nonlinearity well. More analytically, we computed modeling errors between the results for the classical Duhem model and the T-S fuzzy Duhem model. The modeling errors are shown in Figures 12 and 13. The simulation results show that the proposed model approximates the Duhem model within a bounded range of [−1.2 1]. Considering the scaling constant
Many hysteresis models have been proposed and studied. However, the existing hysteresis models include nonlinear functions. Hence, it is impossible to apply various linear system theories and difficult to analyze a hysteretic system. To solve this problem, we propose a system based on a T-S fuzzy model. To design the T-S fuzzy system, the Duhem model, which is expressed by dynamic equations, can be used. Unlike the previous model, the proposed model can express the local dynamics of hysteresis with a linear system. Additionally, the proposed model was verified to have applicability to simulations. Considering the wide range of hysteresis modeling, the proposed model is useful.
No potential conflict of interest relevant to this article was reported.