Traffic congestion is major issue that affects modern life in big cities throughout the world. It impedes our mobility, but also pollutes the air, wastes fuel, and hampers economic growth. For example, the total loss attributable to traffic problems in Tanzania is estimated to be TZS 655 billion per year [1], which is not economical, particularly in developing countries such as Tanzania that face other developmental challenges. It is considered that improving a country’s transportation system solely involves building new roads or repairing aging infrastructures, but the future of transportation lies not only in concrete and steel, because it also needs the application of information and communication technology (ICT). ICT allows transportation system elements (vehicles, roads, traffic lights, and message signs) to become intelligent by embedding them with microchips and sensors, which facilitate their communication via wireless technology [2, 3].
Real-time road information (RRI) is used to reduce congestion by helping road users to make decisions based on ground information. RRI changes the behavior of drivers, which is important for solving traffic congestion.
RRI provides alternative options to road users, which can be divided broadly into time, route, and mode of travel alternatives [4].
Several studies have implemented RRI systems. however collecting real-time road data for direct application by users remains a challenge[5, 6]. There are many methods for collecting real-time data but most are expensive in terms of installation and maintenance. In the present study, we established that the floating car data (FCD) method is cost effective and it would allow the full utilization of readily available technologies (especially mobile phones) in Tanzania. In FCD, the data are collected and processed by a centralized server, which distributes information to road users via several interfaces, including web, radio, television, and mobile phones.
The term intelligent transportation system (ITS) has emerged in the past decade to describe research into technologies that can improve the throughput of transportation systems. ITS provide new information-based services to guide transportation system users [7].
A previous study [8] reported that there are two general categories of information for road users: pre-trip information and en route road information. The availability of this information allows road users to save time, cost, and avoid congestion by making better informed transport choices. RRI services have been implemented in several countries and they are essential components of advanced traveler information systems (ATIS) [5]. ATIS use several techniques that allow road users to receive roadway, transport network, and other types of information, which are important for their trip. Moreover, RRI allows users to decide whether to travel and to select destinations, the timing of journeys, the transport mode, the route, or the transit line [9].
The general aim of the present study was to determine the optimal approach for managing RRI to mitigate traffic congestion. The specific objectives were:
1) to investigate and evaluate the available technologies for road information integration and management; and 2) to design a RRI system architecture using readily available technology.
Transportation systems apply several existing and evolving communications technologies for data collection and cleansing, data fusion, and integration, as well as data distribution. The raw data are collected from the roads, before they are filtered and analyzed in the back-end system, and then disseminated to road users. Road data collection techniques employ two data collection methods depending on their functionalities: intrusive and non-intrusive methods [10].
Intrusive methods basically utilize a data recorder and sensors placed in the road [10]. Some studies have used these methods for road data collection to estimate the traffic state. Intrusive methods collect road data using traffic control techniques, such as magnetic loop detectors buried in the road and infra-red and radar sensors at the roadside. These sensors provide limited traffic information and they require separate systems for traffic counting and traffic surveillance. Inductive loop detectors are a cost-effective solution, but they have a high failure rate if they are installed on poor road surfaces, while they can reduce the pavementlifeandobstructtrafficduringmaintenanceandrepair [11]. Infrared sensors are affected to a greater degree by fog compared with video cameras and the sensor does not respond if the vehicle position is not in alignment with the infrared rays [11, 12].
Non-intrusive methods are based on remote observations and they are used adjacent to roadways, where they have minimal interaction with the traffic flow [10]. These techniques use video cameras to record vehicle numbers, vehicle types, and the speed of vehicles with different video techniques, although these systems can be sensitive to meteorological conditions. Previous studies [10, 13] have also reported the use of microwave radar to count vehicle numbers, record speeds, and for simple vehicle classification, where this method is not affected by the weather conditions. Doppler and microwave radar systems transmit lowenergy radiation and they determine the time delay between transmission and reflection to calculate the distance to a vehicle. These methods are capable of measuring the presence and speed of vehicles but they are generally incapable of classification.
In this study, we selected the FCD technique, which is also known as fioating cellular data and it is defined in [14]. FCD is a traffic information gathering method, where cars act as mobile sensor nodes because they are equipped with global positioning system (GPS)-enabled mobile phones. Traffic information services based on FCD are already in use in Japan and the European Union (EU). In contrast to other traffic data collection techniques with high installation and maintenance costs (e.g., automated vehicle identification systems, video cameras, inductive loops, and radar-based sensors), FCD uses GPS, global system for mobile communication (GSM)/general packet radio service (GPRS), and universal mobile telecommunication system (UMTS) networks so there are no requirements for instrumentation set up on the roadway [15]. This facilitates the cost-effective implementation of the FCD by utilizing readily available mobile phones and the cellular network infrastructure. This pre-existing information is exchanged within the infrastructures of the GSM and UMTS networks, which solves the problem of a lack of resources [16].
Previous studies [10, 14] have noted that FCD aims to collect real-time traffic data by locating a vehicle via GPS-enabled mobile phones, which are carried in the vehicles throughout the entire road network. Thus, these mobile phones act as sensors in the road network. Data on the location, speed, and direction of travel of cars are sent anonymously to a central processing unit. After the collection and extraction of data, useful information is redistributed to road users as pre-trip or en route information.
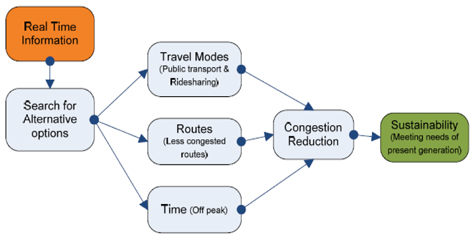
Thus, the FCD technique is the major component of the RRI services we selected to mitigate traffic congestion in Tanzania. RRI services will contribute to reducing the economic losses caused by traffic congestion by optimizing the use of readily availableelectronicdevices. Figure 1 illustrates the role of RRI, where the availability of information facilitates the search for alternativeoptions. These options include the selection of travel modes, routes, and timing, which lead to reduced congestion.
3. Proposed RRI System Architecture
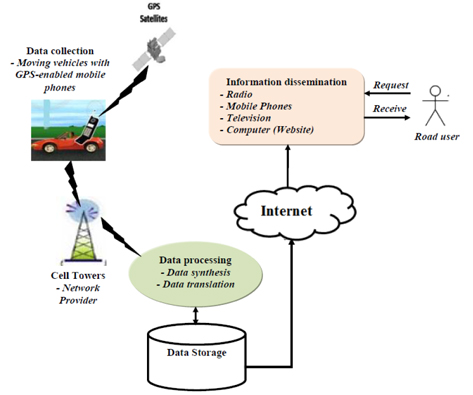
Our proposed RRI system architecture considers real-time road traffic data collection, processing, and dissemination. Readily available communication technologies and infrastructure are integrated to manage the RRI. GPS-enabled mobile phones are used as moving sensors, as explained in the previous section. Mobile phones are used for information dissemination, in addition to other techniques such as radio, television, and the Internet. As shown in Figure 2 the main components of the proposed architecture are:
1) data collection,2) data processing and storage, and3) information dissemination.
Road traffic data can be collected using GPS-enabled mobile phones, as explained previously [17]. Most GPS-enabled mobile phones are embedded with a GPS chip-set, which is capable of generating a time-stamped geo-position (latitude, longitude, and altitude). The in stantaneous speed can be determined based on the time and position data. For road traffic data collection, we decided to use active GPS tracking, which automatically sends information from the GPS device to a central tracking portal or system in real-time. This type of system is better for monitoring the road status, such as the presence of vehicles at a specific location, their speed, the number of vehicles, and the travelling time between points.
Thus, we developed software that transforms GPS-enabled mobile phones into mobile traffic probes, which provide real-time data on the traffic flow and travel times. The software was installed in all of the phones that participated as traffic probes. We employed the virtual trip lines (VTL) strategy for better data quality management and to ensure the privacy of the mobile phone users [18]. The VTL sets data collection points, which yield traffic information but do not detect a user’s personal information. As vehicles pass through the set VTL, the phones automatically send anonymous phone ID, time, and location readings to a data processing server. The collected data are then integrated and used as the input for the data processing module, which estimates the traffic flow.
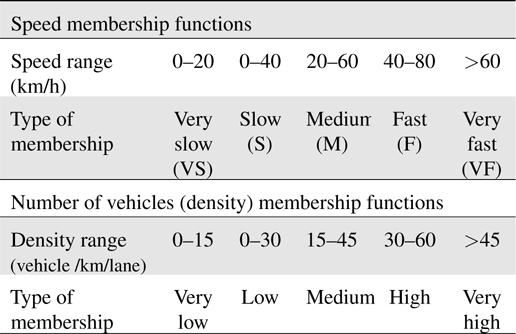
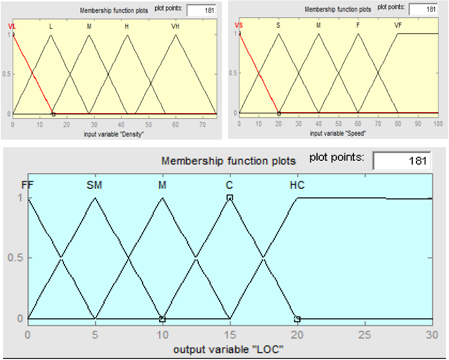
Fuzzy inference processing was used to formulate the mapping from a given input to an output using fuzzy logic, which was simulated to handle the traffic data processing. The test scenario was Morogoro road, which is the main highway that connects all of the feeder roads to Dar es Salaam city center. The inputs of the data processing module included the number of vehicles (density) and the vehicle speeds, which were recorded by the data collection module. The output from the data processing module was the level of congestion (LOC).The Mamdani fuzzy inference system was simulated using MATLAB R2007a to develop the fuzzy model. Two input variables, one output variable, and 25 fuzzy rules were set. The fuzzy subsets for the input and output variables were derived as shown in Tables 1 and 2.
[Table 1.] Input data fuzzy set

Input data fuzzy set
[Table 2.] Output data fuzzy set
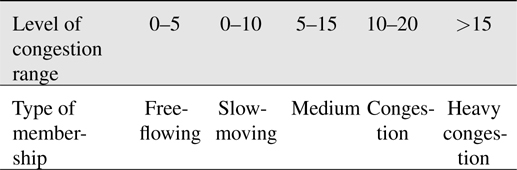
Output data fuzzy set
Figure 3 shows a graphical presentation of the variables in the simulation. The fuzzy sets overlap as a natural consequence of their elastic boundaries. These overlaps permit the implementation of a realistic and functional semantic mechanism to define the nature of a variable when various data values were assumed, and they also allow smooth and coherent transitions among states.
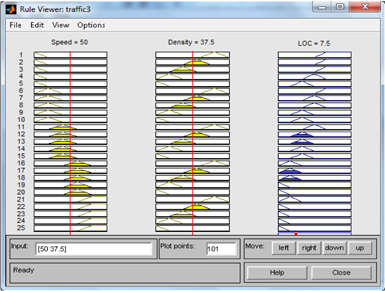
The rule viewer in Figure 4 shows an example of a calculation at a specific time in great detail, which represents a micro-view of the fuzzy inference system.
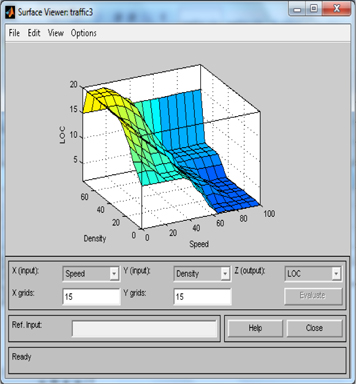
Based on the rules set for the membership functions, a threedimensional surface graphical representation is generated, as shown in Figure 5. The three graph axes combine the input and output variables for the general model setup, which indicate that the LOC increases as the density increases and the speed decreases.
The calculated LOC is then map-matched to determine the real situation on the road. These signals are processed and translated into road information, which is stored in the database.
Users access the RRI from a storage module, where various technologies such as mobile phones and the Internet are used to request and receive the information directly. Television and radio operators may also access the information and disseminate it as appropriate. This arrangement allows road users to dynamically access the RRI via any media capable of receiving information. To ensure that the system is flexible, the architecture requires that road users send a request before they receive the RRI for specific lanes.
4. Analysis of Road Traffic Management in the Cities
Our study was conducted in Dar es Salaam, Mwanza, and Arusha. These cities are affected the most severely by road traffic congestion [19]. Three organizations in each city are responsible for road traffic management: traffic police, municipal councils, and Tanzania National Roads Agency (TANROADS). Furthermore, drivers and non-drivers were included in the survey. Primary data were collected to identify the current traffic congestion situation and to understand the factors that affect the procedures implemented to alleviate congestion. Questionnaires were developed and sent to town planners, road engineers, traffic police officers, and road users (drivers and non-drivers). In total, 90 subjects were contacted at the three organizations and 86 responded. For the road users, the sample size was calculated using Eq. (1) [20]:

where
In the three cities, 1,200 road users were contacted but only 1,100 returned their questionnaires. The data were analyzed using SPSS (SPSS Inc., Chicago, IL, USA). Descriptive analyses were generated to identify the frequency of responses to the question items. Fisher’s exact test was used to determine the significant effects of road information dissemination on traffic congestion control. Significant differences between the dependent and independent variables were accepted at
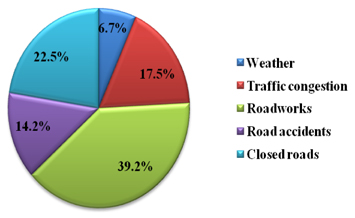
The results showed that the organizations manage road traffic flow by disseminating road traffic information to road users, but the information was static. The percentages of dissemi- nated road information are shown in Figure 6, i.e., information related to road construction work in progress (39.2%), closed/faulty roads (22.5%), traffic congestion (17.5%), road accidents (14.2%), and weather (6.7%).
The manually disseminated road information did not reduce the problem.
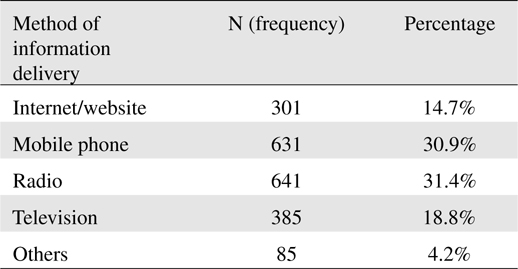
The results showed that road users would prefer to request and receive RRI, as shown in Table 3. The preferred methods for requesting/retrieving road information were radio = 31.4%, mobile phones = 30.9%, and <20% preferred other methods, including websites and television.
[Table 3.] Preferred methods for requesting/retrieving real-time road information

Preferred methods for requesting/retrieving real-time road information
The outcome variable “road traffic congestion” was affected by many factors. These factors included a large number of vehicles, low road capacity, poor traffic management, and poor road information dissemination. We calculated the
[Table 4.] Factors associated with road traffic congestion (N = 86)
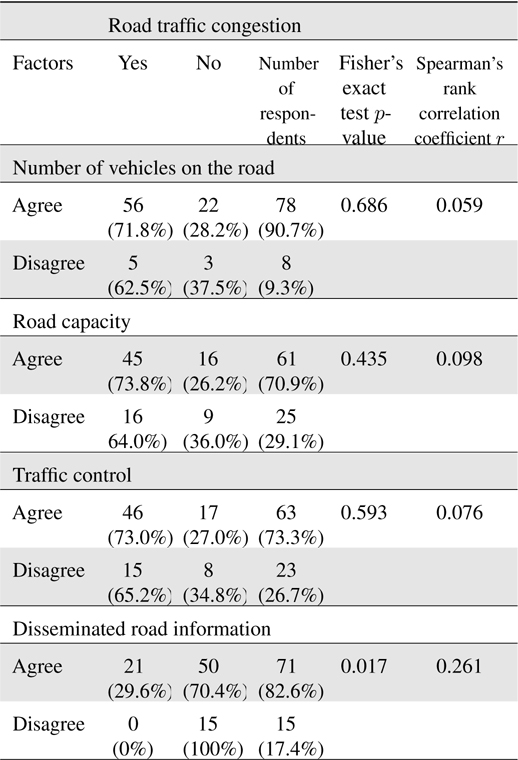
Factors associated with road traffic congestion (N = 86)
All of the factors had positive correlations with traffic congestion, but road information dissemination had the strongest correlation compared with the other factors (
Our traffic management findings show that there is a need for RRI dissemination. Static information provision is not capable of making an impact on the problem. We found that there was a positive correlation between information dissemination and congestion control. Congestion means that road users experience delays in reaching their home or workplace, and they may fail to reach their appointments on time [21]. One respondent stated, “we arrived late at home and failed to help our children in their homework.”
The government has implemented manual procedures to reduce the problem but these have proved unsuccessful [22]. The types of information disseminated to mitigate traffic congestion are shown in Figure 6. These efforts require additional support based on ICT. As shown in Table 3, most road users would prefer to request/retrieve road information using a radio or a mobile phone. This indicates the possibility of accessing mobile phones to implement the proposed FCD technique. These devices are readily available and used by most road users. A previous study [23] estimated that there were 27.4 million subscribers to mobile networks in Tanzania in December 2012.
At present, road information is disseminated manually, but it has contributed little to reducing traffic congestion. We found that the information disseminated in the three main cities of Tanzania was focused only on recurring congestion. This information was not automated and it was disseminated using static wooden signs. This approach fails to provide road users with RRI that might improve the congestion situation. Thus, the RRI management system should include recurring and non-recurring road problems. In this study, we considered these types of situations during the development of our proposed architecture because of their importance.
5. Conclusion and Future Works
In this study, we considered the application of RRI to congestion control. The FCD method was used for real-time road status data collection. This method is suitable for Tanzania because it is a developing country that lacks a traffic monitoring infrastructure, but the penetration of mobile phones is increasing rapidly in the population. Thus, we proposed a RRI system architecture, which considers the effective utilization of readily available communication technology in Tanzania to facilitate congestion control. We also considered the possible methods road users would prefer to use to access RRI. The implementation of the proposed architecture will contribute to congestion control in Tanzanian cities. In the future, we will implement the system by coding and interfacing the requisite modules.
No potential conflict of interest relevant to this article was reported.

![Role of real-time road information in road traffic management [4].](http://oak.go.kr/repository/journal/13865/E1FLA5_2013_v13n4_269_f001.jpg)