Light emitting diodes (LEDs) have become the main light sources for backlight applications in the field of liquid crystal displays (LCDs). There are many advantages in using LED backlights over the conventional fluorescent lamps, such as low power consumption, flexible form factors, environmentally friendly aspects, etc. [1]. The first application of LED backlights to large-size LCDs is based on edge-lit-type technology [2], which made it possible to realize ultrathin LCD TVs. However, edge-lit backlights for this application require large-size light guide plates, which are costly optical components.
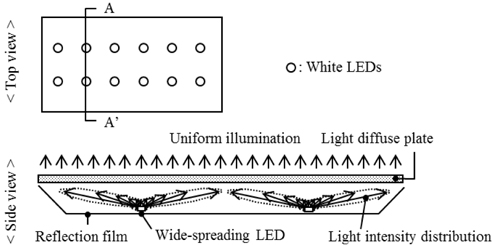
Very recently, new types of direct-lit LED backlights have been developed and applied to LCD TVs, where only a few tens of white, wide-spreading LEDs are adopted. Considering the fact that several thousands of white LEDs were required for direct-lit backlights adopted in LCD TVs sold in 2009, the number of white LEDs has been reduced remarkably. This drastic change is attributed to the development of special lenses which spread the light emitted from white LEDs according to a wide and peculiar intensity distribution. Figure 1 shows an example of the direct-lit LED backlight for 32-inch LCD TV. There are only 12 LED packages in a backlight, and each LED uniformly illuminates a circular area of at least about 200 mm in diameter.
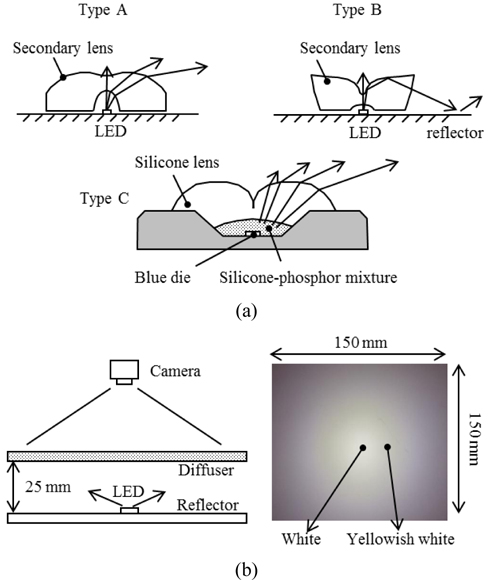
In order to reduce the number of white LEDs in the direct-lit backlight, it is very important to optimize the intensity distribution of the LED packages for appropriate luminance uniformity. Several wide-spreading LEDs with different optical structures have been proposed for direct-lit backlights, as shown in Fig. 2(a). The “type-A” LED package consists of a secondary lens and an LED [3, 4]. Light rays emitted from the LED are refracted at the inner and outer surfaces of the lens, so that the rays are widely spread out. The “type B” LED package also consists of a secondary lens and an LED [5]. Light rays emitted from the LED are internally reflected by the outer surface of the lens and then reflected back from the surface of the reflector. In the case of the “type C” package, a lens is directly formed upon the phosphor layer without any air gap [6]. It is known that the material cost of the type C-package is lower than those of the other two packages because the volume of the lens in the type-C package is smaller compared with other secondary lenses. However, its spreading function is known to be inferior to those of the other two packages.
One of the critical problems in using these wide-spreading LED packages is the color separation depending on the viewing angle. The left figure of Fig. 2(b) shows a schematic cross-section of part of the direct-lit LED backlight, where the type-C LED package illuminates an area of about 100 mm in diameter with a gap of 25 mm between the reflector and the diffuser. A typical phenomenon resulting from this structure is that non-uniform white color is formed at the center of the illuminating area around which a yellow ring is seen. The right figure of Fig. 2(b) displays one example of this color separation phenomenon. There are many possible origins of this non-uniformity, such as imbalance between the LED chip and phosphors, dispersion of materials, wavelength-dependence of absorption, etc. To find out the exact origin of the color separation and to optimize the optical structure of LED packages are of paramount importance in applying direct-lit backlight technology to large-size LCD TVs.
In this study, we focused on optimization of the type-C LED package. The color separation problem of this package, in particular, the color variation depending on the viewing angle was analyzed in terms of the ray-tracing simulation technique, and a potential approach for improving the color uniformity was proposed.
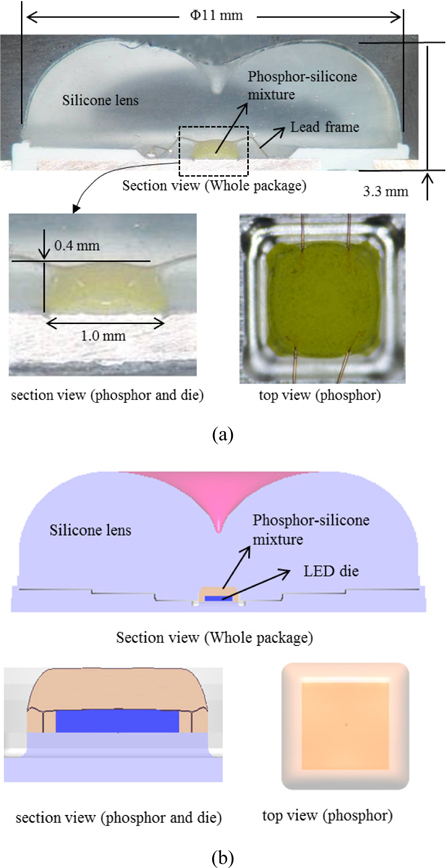
Figure 3(a) shows the real image of a wide-spreading LED package. The package is composed of an LED die, a lead frame, phosphor-silicon resin mixture, and a silicon lens. The outer diameter of the lens is 11 mm, and the total thickness of the package is 3.3 mm. The thickness of the phosphor layer is 0.4 mm, and the square-shaped phosphor area is 1 mm2. Figure 3(b) shows the simulation model for the wide-spreading LED package shown in Fig. 3(a). All dimensions of the model geometry were set to be the same to those of the real package. Commercially-available software (LightTools, ORA Co.) was used as the ray-tracing simulator [7].
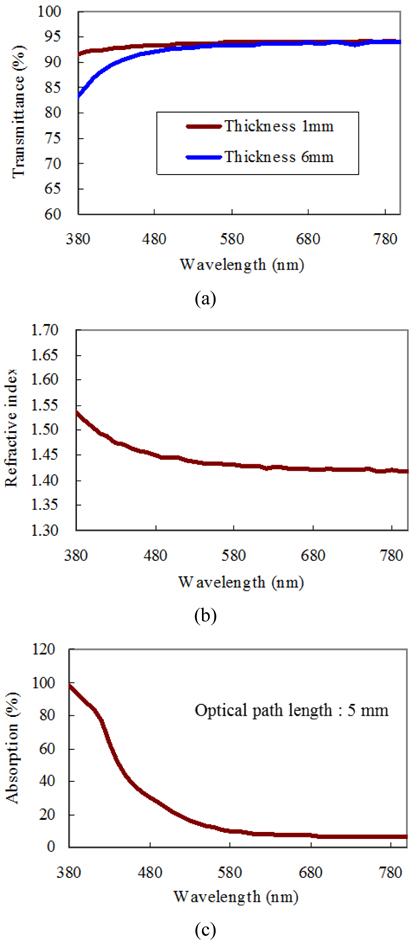
Silicone resin (OE-6652, Dow Corning) was used as the lens material and also encapsulant material for phosphor particles. In order to obtain the wavelength dependence of the refractive index and the absorption coefficient of the silicon material used, the transmittance of the silicon sheet was measured as a function of thickness. Figure 4(a) shows the experimental results for two thicknesses. The wavelength-dependent refractive index of the silicon material,
Based on Eq. (1),
In addition, the wavelength-dependence of the amount of the absorbed light in the silicone material at the optical path length of 5 mm ((
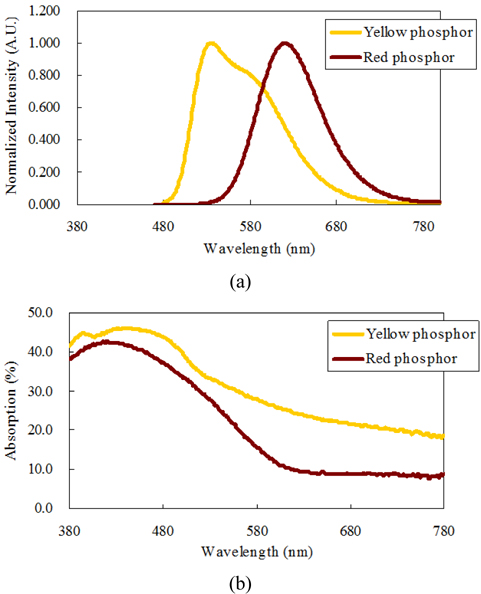
As for the phosphor materials, the yellow and red phosphors of Mitsubishi Chemical Corp. (BY201A and BR102D) were modeled in the simulation. Absorption and emission spectra supplied by the manufacturer, which are shown in Fig. 5, were used as the input data for phosphor particles dispersed in the silicon resin in the simulation model. The Stokes-shift loss was automatically calculated for the converted rays in the model [8], and the quantum yield was assumed to be 92%. The particle size distribution of phosphor particles, supplied by the manufacturer, was used as Mie scattering parameters for the phosphor materials. The mean diameters of yellow and red phosphors were 25 μm and 10 μm, respectively. The weight percent of phosphors to silicone resin was 5%, and the ratio of the weight percent of yellow and red phosphors was 95% to 5%.
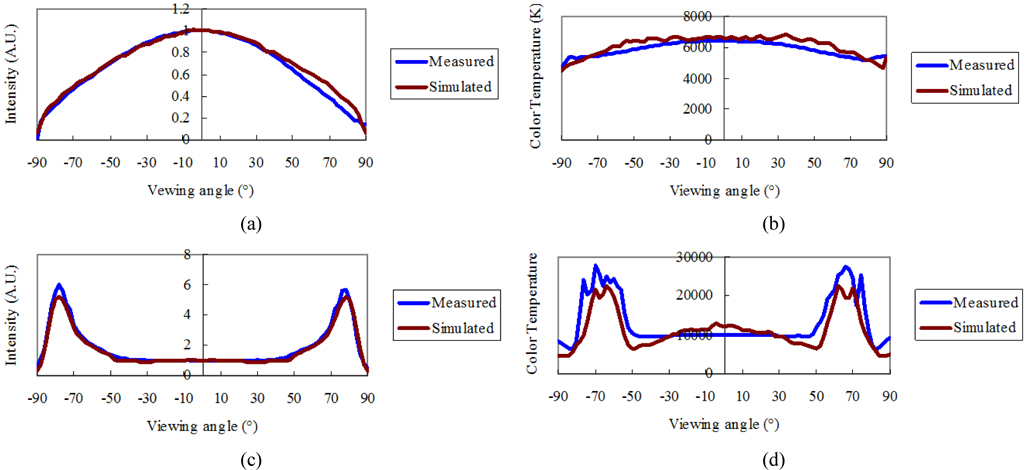
In order to check the reliability of the simulation model of the LED package, ray-tracing simulation was carried out on the package without and with the secondary lens. The angular distribution of the luminous intensity and the correlated color temperature was obtained from the simulation, which was compared with the experimental result as shown in Fig. 6(a)~(d). The intensity profile was normalized with respect to the center value, i.e., the value along the normal direction. These figures clearly show that the simulation results reproduce the intensity and color characteristics of the experimental LED package to a high accuracy, confirming that the present simulation model is reliable.
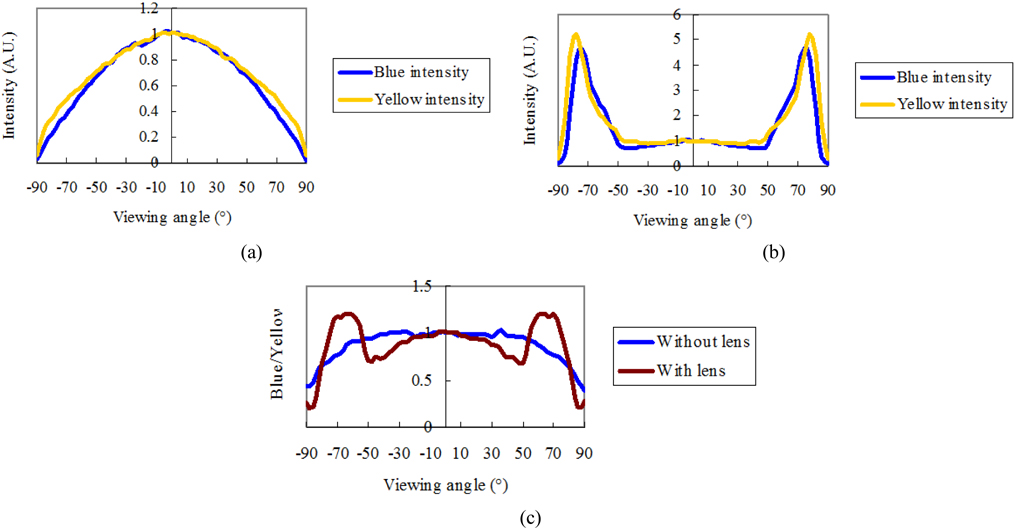
In order to investigate the color separation phenomenon of the LED package quantitatively, the emitted spectrum was divided into blue and yellow components, the wavelength of 500 nm being the boundary between these two spectral regions. If there is some difference in the angular distribution of the luminous intensity of these two spectral components, color will look different depending on the viewing angle. Figures 7(a) and (b) show the comparison of the intensity distribution of blue and yellow components without and with the lens, respectively. Figure 7(c) shows the intensity ratio of the blue component to the yellow component, designated as (
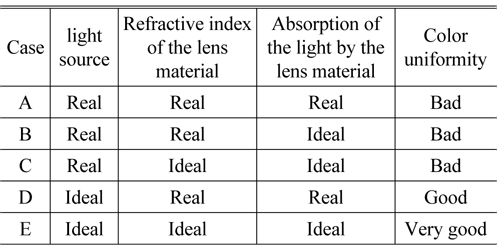
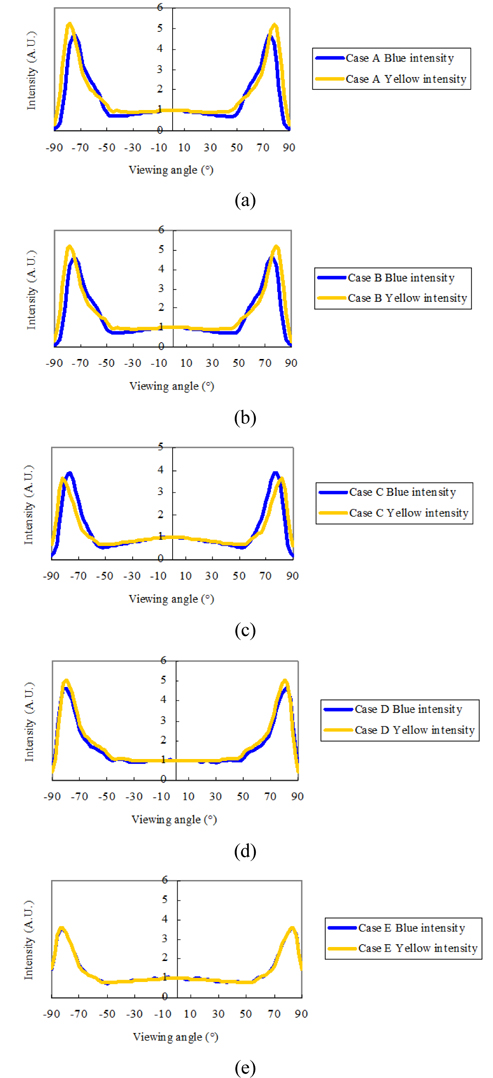
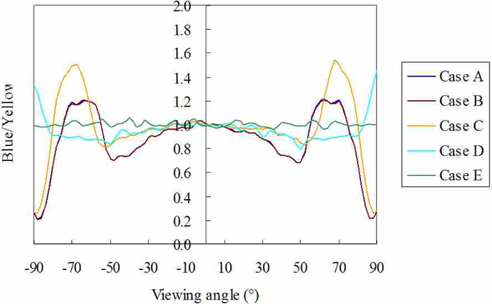
Regarding the main origin of the formation of the yellow ring in the intensity distribution of the LED package, several factors can be considered; different optical path length which blue emission experiences in the phosphor suspension, the wavelength dependence of the refractive index and the absorption of the lens material, etc. In order to find out the main factor affecting the color separation of the wide-spreading the LED package with the lens, five different cases were considered and simulated, as shown in Table 1. “Ideal” light source indicates an LED intentionally-made not to exhibit any color separation, while “real” light source is the model where the LED chip and the phosphor material are designed according to the experimental LED package. When there was no wavelength-dependence in the refractive index or the absorption, these cases were referred as “ideal” ones, while they were indicated as “real” when the dispersion effect shown in Fig. 4 was included in the simulation. Figure 8 shows the simulated angular dependence of the intensity of blue and yellow components of five cases as tabulated in Table 1. Figure 9 exhibits the corresponding intensity ratio of the blue component with respect to the yellow one. In “case E” where perfect ideal conditions were considered, there was no color separation. If the ideal light source was considered as in “case D”, the degree of color separation is small, indicating that the dispersion effect in the lens material on the color separation was not substantial. However, in three cases of A, B, and C where the real light source condition was used, the color separation was significant, in particular, at high angles. Therefore, it can be stated that the condition of the light source in the LED package is the most important factor which affects the degree of color separation of wide-spreading LED packages.

Simulation conditions for investigating the main factors affecting the color separation of wide-spreading LED packages. Regarding the meaning of “real” and “ideal” conditions, see the text
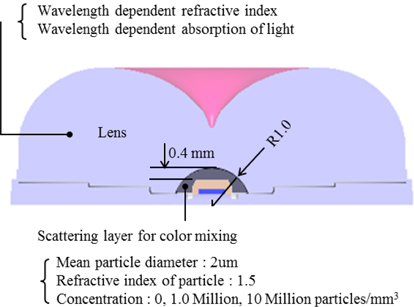
The improvement of the light source part, for example, by a conformal phosphor coating technique [9] may be desirable for resolving the color separation issue in the wide-spreading LED package. However, reabsorption of visible light emitted from phosphor particles by the LED chip is a significant loss in this conformal-coating structure. The next solution for the color separation might be the optimization of the thickness of the phosphor layer, i.e., the thickness distribution may be controlled and optimized to make the optical path lengths traversed by the blue photons in the phosphor layer be the same irrespective of the viewing angle. However, to realize the non-planar shape of the phosphor layer may be very difficult in the conventional manufacturing processes such as phosphor dispensing or printing process. As another potential approach for improving the color separation in the wide-spreading LED package, we considered a diffusing layer on top of the phosphor layer as schematically drawn in Fig. 10. This scattering layer included scattering beads, the diameter of which was set to be 2 μm, and the refractive index was assumed to be 1.5. The matrix material was set to be the same as the silicon lens material. The thickness of this scattering layer was 0.5 mm. This layer is expected to enhance color mixing for the visible light emitted from the LED chip and yellow phosphors. The concentration of beads were changed in the range of 0~107 particles/mm3.
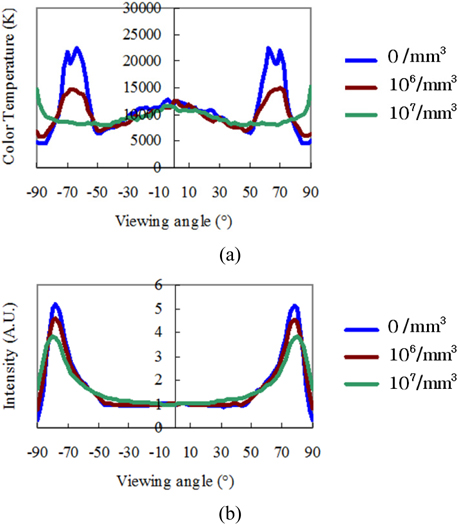
Figure 11 shows the angular dependence of the correlated color temperature and the luminous intensity for different bead densities in the scattering layer. As shown in Fig. 11(a), the dependence of the color temperature on the viewing angle was reduced significantly as the bead density increased. In particular, significant color separation at high angles nearly disappeared at the density of 107 particles/mm3. This result clearly indicates that the scattering layer mixes the two color components emitted from the LED chip and phosphor particles efficiently. However, high density of scattering beads may increase the number of rays which return back to the phosphor layer and the LED chip resulting in enhanced light loss. Indeed, Fig. 11(b) shows that the light power of the LED package becomes lower as the concentration of the scattering beads increases. Therefore, there should be some compromise between the lighting efficiency and the color separation issue in adopting the internal scattering layer in the LED package. If the thickness of the internal scattering layer is to be reduced, the difference in the refractive index between the scattering beads and the matrix material should be larger. On the other hand, the scattering layer may be put on the outer surface of the lens material. In this case, the color separation issue may easily be resolved, but it may be difficult to achieve accurate control of the intensity distribution of the LED package. From a practical point of view, we think it is feasible to apply the volume scattering layer on top of the phosphor layer in the present LED manufacturing process. In spite of the obvious expectation that the light-utilizing efficiency will decrease due to the diffusing layer, the percentage of the decrease in the light output is 96% and 90% for the particle density of 106 and 107/mm3, respectively, which may be compensated by using optimized optical components in the backlight.
The issue of the color separation of a wide-spreading LED package for direct-lit backlight applications was analyzed by ray-tracing simulation. We found that the main factor affecting the color separation most significantly was the different angular dependence of each spectral component of the phosphor-based white LED package. On the other hand, the effect of optical dispersion of both the refractive index and the absorption of the lens material on color separation was not substantial. The inclusion of a thin, internal scattering layer on top of the phosphor layer reduced the difference in the angular dependence of the intensity between the blue and yellow components, resulting in improved color uniformity. However, increased particle density in the scattering layer enhanced light loss due to the increased amount of light returning back to the phosphor and the LED chip. The present approach may be used to analyze the color nonuniformity problem of various LED packages and to seek out an appropriate optical solution for resolving this important technical issue.