Eye function is crucial to providing numerous and precise visual information, and accurate and easy diagnosis is required to prevent serious unrecoverable damage caused by ocular diseases, such as retinal diseases. Recently, various ophthalmic imaging methods, including fundus photography and optical coherence tomography, have been applied for effective diagnosis of ocular diseases [1-3]. However, although current emerging ocular imaging methods can be applied with high spatial resolution, most of them are limited by a shallow penetration depth and a narrow field of view [4, 5]. Also, many of those imaging modalities are optimized to provide anatomical information, so functional or cellular information is hardly offered by them [5].
Photoacoustic imaging has been widely reported to be capable of visualizing various biological tissues [6, 7]. Compared to other ocular imaging modalities, photoacoustic imaging can achieve relatively deep penetration depth and more functional and cellular information based on photoacoustic signal generation from endogenous contrast agents such as hemoglobin and melanin [8, 9]. Moreover, a photoacoustic imaging system, such as a transducer and a data acquisition unit, is similar to a conventional ophthalmic ultrasound imaging system and effectively combined with it so that it is feasible to offer mechanical and morphological information in addition to functional and cellular data [10, 11]. However, recent studies related to photoacoustic ophthalmic imaging have been mostly based on a single element detector and focused on assessment of microscopic structure, which is confined to limited field of view and far from fully utilizing potentials and advantages of photoacoustic imaging techniques [12-14].
Therefore, in this paper, we demonstrated array-based ultrasound and photoacoustic imaging to visualize pigmentation in the eye as well as overall ocular structure. Fresh porcine eyes were imaged using a real-time ultrasound microimaging system and an ultrasound transducer combined with an optical fiber bundle. 3D images are also reconstructed by volume-rendering of the acquired ultrasound and photoacoustic signals. In addition, to enhance the photoacoustic imaging field-of-view (FOV), the porcine eye was imaged with the imaging probe tilted at various angles, and the photoacoustic signals acquired at different angles were compensated and merged to show whole pigmentation in the retina.
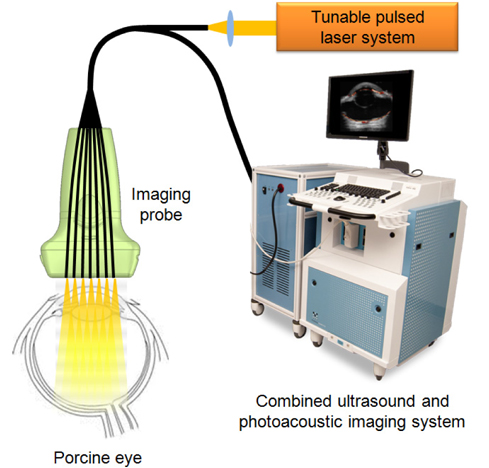
Fresh porcine eyes were obtained (Sierra Medical, Inc.) and carefully washed with water and submerged in PBS for combined ultrasound and photoacoustic imaging. Then, as shown in Fig. 1, ultrasound and photoacoustic signals were collected using a real-time ultrasound micro-imaging system (Vevo 2100, VisualSonics, Inc.) with a 20 MHz ultrasound array transducer (VisualSonics, Inc.). A laser pulse from a tunable laser system (Vevo LAZR, Visual Sonics, Inc.) was delivered through an optical fiber bundle (Ceramoptec, Inc.) connected to the ultrasound array transducer. For this study, laser pulses at a wavelength of 700 nm with fluences of 8-12 mJ/cm2 were applied. The ultrasound and photoacoustic signals were obtained using the transducer at the same cross sections and then were stored in the imaging system. For 3D images, the motion axis connected to the imaging probe scanned in the elevational direction.
Although the imaging system supports real-time visualization, the acquired ultrasound and photoacoustic RF signals were post-processed to improve image quality with laser fluence compensation and 3D volume-rendered reconstruction. Specifically, the ultrasound and photoacoustic signals were band pass filtered to reduce noise. The signal magnitudes were calculated by taking the absolute values of analytic signals obtained using the Hilbert transform. Then, the calculated signals were beamformed and interpolated to construct 2D ultrasound and photoacoustic images. For photoacoustic images, laser energy at each cross section was then compensated. Finally, the combined ultrasound and photoacoustic images were created by overlaying photoacoustic intensities higher than a user-defined threshold value on grayscale ultrasound images.
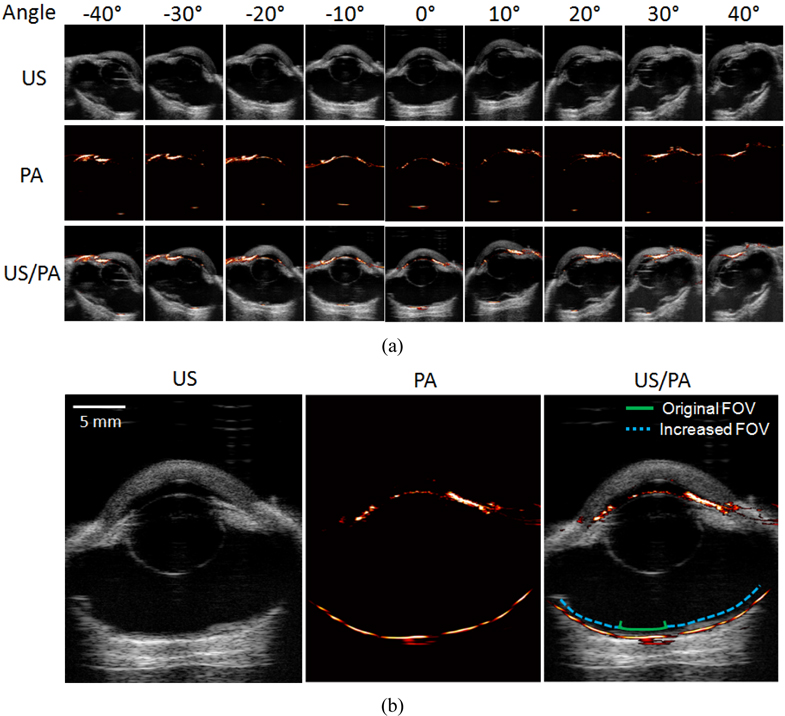
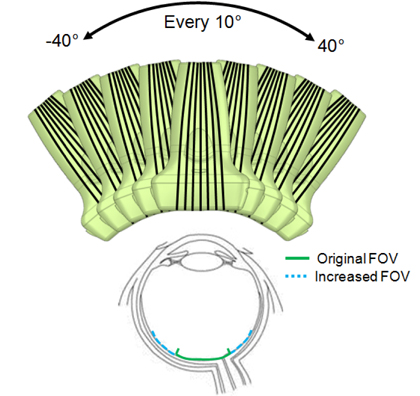
To enhance the photoacoustic imaging FOV, the array transducer was tilted by angles from -40 degrees to 40 degrees along the lateral direction using a motion axis (Fig. 4). Tilted angles were accurately measured and recorded by a gyro sensor. The transducer was tilted in 10 degree increments and both ultrasound and photoacoustic signals were captured to create 2D images as described above. During post processing, the photoacoustic images at all angles were merged after angular compensation of the images to present whole photoacoustic signals from the retina with the increased FOV.
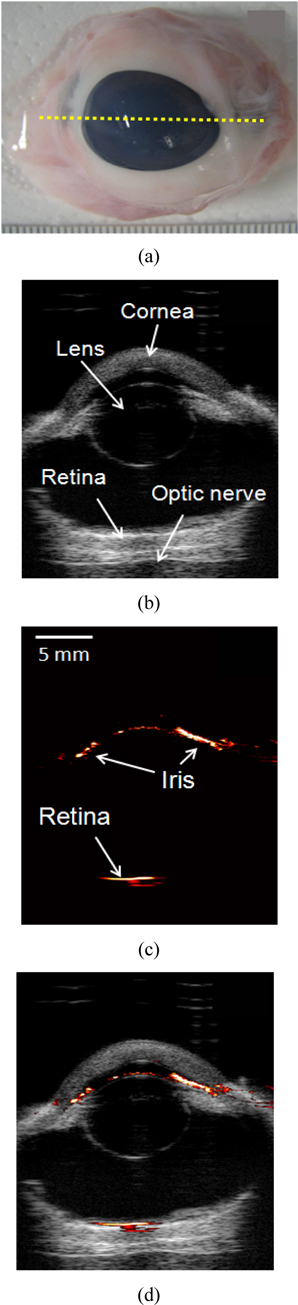
Two dimensional ultrasound, photoacoustic, and combined images were obtained using the 20 MHz array-based imaging probe and the real-time micro-imaging system, as shown in Fig. 2. The ultrasound image clearly shows the overall ocular structure, including the cornea, lens, and the optical nerve. In addition, visualization of overall anatomy is useful for photoacoustic ocular imaging to identify the location of photoacoustic signal generation. However, due to low acoustic contrast changes in soft tissue, it is difficult to distinguish the position of the iris and the retina with the ultrasound image alone. Yet, because melanin is a strong optical absorber in the iris and the retinal pigment epithelium between the retina and the choroid, significantly strong photoacoustic signals were detected at a wavelength of 700 nm as shown in Fig. 2(c). Both ultrasound and photoacoustic signals were acquired at the same position, so they are easily coregistered and overlaid to create the combined images. The combined ultrasound and photoacoustic image, Fig. 2(d), clearly represents an overview of ocular anatomy and specific position of the retinal pigment epithelium as well as the iris.
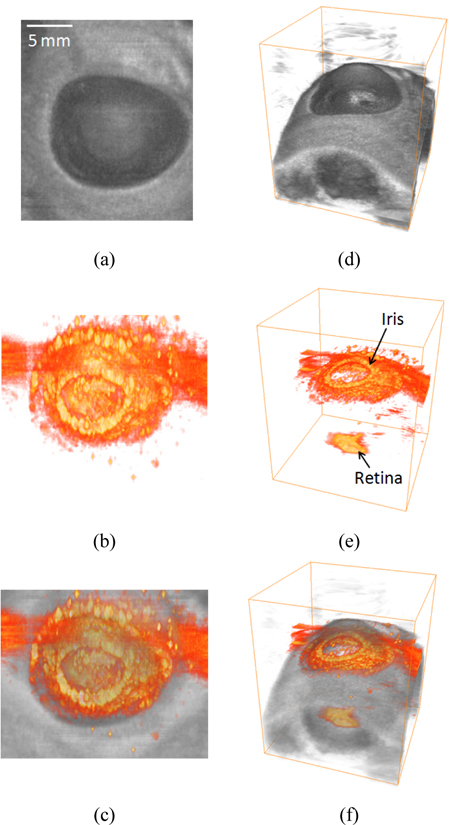
In addition to 2D cross-sectional images, ultrasound and photoacoustic signals were acquired in three dimensions by mechanical scanning of the array-based imaging probe. During post data processing, volume-rendered 3D ultrasound, photoacoustic, and combined images were reconstructed and are presented in Fig. 3. The 3D ultrasound images provide better anatomical overview for the porcine eye than the 2D ultrasound images. Also, the 3D top-view ultrasound image matched well with the picture of the eye displayed in Fig. 2(a), which indicates that accurate ophthalmic assessment with depth-resolved information is possible using the array-based ultrasound and photoacoustic imaging method. As demonstrated in the 2D photoacoustic image, 3D photoacoustic images also indicate that photoacoustic signals were generated mainly from the retinal pigment epithelium and the iris. Moreover, because the size of porcine eye is similar to a human eye, the imaging results can be used to estimate the feasibility of using the suggested method to clinical applications. Therefore, the results imply that the array-based combined ultrasound and photoacoustic imaging method can be applicable to noninvasively assess human eyes in real-time.
Although photoacoustic imaging is able to detect the pigment layer of the retina, the FOV of photoacoustic imaging is significantly limited compared to that of ultrasound imaging. This is because a large number of photons are absorbed and attenuated in the anterior compartments of the eye, including the iris, and thus a limited number of photons are delivered through the pupil to the retina. However, as suggested in Fig. 4, a wider FOV can be achieved if the imaging probe is tilted around the eye. Figure 5(a) presents ultrasound, photoacoustic, and combined images at the tilting angles from -40 degrees to 40 degrees along the lateral direction. In the photoacoustic images, it is obvious that the location of photoacoustic signal generation in the retina changes as the angle varies. To reconstruct the location of the retina with the increased FOV, the photoacoustic signals from the retina at all angles were merged after angular compensation and are presented in Fig. 5(b). The result indicates that the FOV was significantly increased by the probe tilting method and most regions of the retina covered in the ultrasound image were able to be visualized.
Array-based ultrasound and photoacoustic imaging was verified to simultaneously display pigmentation in the porcine eye, including the retinal pigment epithelium, together with overall ocular anatomical information. Moreover, by imaging probe tilting, the photoacoustic imaging FOV was significantly enhanced and most regions of the retina covered in the ultrasound image could be detected. The ultrasound and photoacoustic imaging results imply that the suggested method is applicable to noninvasively assess human eyes in real-time. Also, it is feasible for clinical applications by applying array-based photoacoustic imaging to clinical ophthalmic ultrasonography. As demonstrated in this study, photoacoustic imaging can compensate the defects of the current ophthalmic ultrasonography so that the combined ultrasound and photoacoustic imaging can be a great diagnostic tool for ocular injury, such as vitreous pigment, retinal tear and detachment, and choroidal rupture.