Applications of Terahertz (THz) radiation in spectral analysis [1], biology and medicine [2, 3], quality control [4], and communications [5] have spurred much interest in THz photonics. Furthermore, recent developments in THz technologies [6, 7] showed that THz waves could be a strong candidate for overcoming the obstacles associated with conventional explosives detection technologies, leading to extensive applications in security and military-related fields [7-10]. It should be noted that THz time-domain spectroscopy (THz-TDS) has been heavily utilized as the workhorse of the investigation of these capabilities of the THz regime, including the works on the detection and identification of both exposed and covered explosives through diffuse reflectance [11], investigation of the absorption spectra of numerous explosives and related compounds [12], and establishment of new spectral features within the frequency region of 3-6 THz [13, 14]. Unfortunately, raw THz data obtained from THz-TDS cannot always be used for direct explosives detection applications. One of the major difficulties is highly related to the low signal-tonoise ratio (SNR) of the system setup. Additionally, THz absorption of water vapor and the reflections from the optical components of the system setup limit accurate spectral characteristic identification and analysis of the THz spectra [15-17].
Despite its importance, signal processing techniques of THz signals has drawn little attention in literature. Especially, signal processing of THz data based on wavelet transform is known to enhance signal quality without losing the essential information as compared to conventional filtering or smoothing algorithms [18]. Although research on utilizing wavelets in THz data post processing for gas sensing [19], and imaging [20, 21] have formerly been conducted, practical application on compound plastic explosives have rarely been reported, therefore they are still at an introductory level. Moreover, analyzing the ‘recipe’ of plastic explosives is known to help determine where the explosives were originally produced [22]. Therefore, there exists a huge area left for improvement in developing an overall signal processing procedure for in situ explosives detection and component analysis [23].
In this paper, we present experimental results regarding major interests and essential factors in compound explosives detection via THz-TDS: effective denoising, temporal and spectral error handling, and practical component analysis schemes. THz spectra of Composition B-3 and Pentolite are investigated to verify the performance of the proposed procedures and algorithms on compound explosives.
Our experimental setup for THz-TDS is illustrated in Fig. 1. A Ti:Sapphire femtosecond laser is pumped by a continuous wave diode-pumped solid state laser at 532 nm wavelength. The femtosecond laser has a center wavelength of 790 nm (tunable by adjusting the slit position in the laser setup) and pulse duration of 25 fs.
The femtosecond pulse is divided into a pump and probe beam by a beam splitter. The optical pump beam (250 W/cm2) stimulates THz pulsed radiation at the emitter, which is biased with a voltage of 20 Vpp. The THz emitter is a low-temperature-grown GaAs photoconductive antenna (Tera-SED10, Laser Quantum), with a dimension of 1 inch (O.D.) and no incorporated silicon lens. The diverging THz wave is collimated and focused onto the sample and recollected onto the receiver by using four off-axis parabolic mirrors. At the receiver (1mm-thick ZnTe electro-optic crystal), the probe beam (10 W/cm2) optically gates the detection with short pulse duration compared to the arriving THz pulse duration. Simple balanced detection is incorporated with a quarter-wave plate and a Wöllaston prism. A complete temporal scan of the THz signal is enabled by discrete micro-movement of a motorized stage controlling the optical delay line. The THz-TDS system delivers a time-resolved THz pulse, where it is converted to a broadband THz spectrum via Fourier transform.
A discrete signal processing lock-in amplifier (LIA) was used for amplifying and denoising THz signals modulated by a function generator at 70 kHz. Different time constants were applied for the acquisition of different THz pulse SNR. Atmospheric attenuation was controlled by inserting dry nitrogen gas into an installable chamber which covered the THz generation and detection sections of the THz-TDS system.
Explosives samples (pentaerythritol tetranitrate; PETN, 1,3,5-trinitro-1,3,5-triazacyclohexane; RDX, and trinitrotoluene; TNT) were gently ground using a mortar and pestle to fine powder in accordance to the fact that compound explosives are made with highly explosive materials in powder form. The samples were compressed into pure pellets and compound pellets (all approximately 1 mm in thickness and 15 mm in diameter) directly using 10 tons of pressure with a hydraulic press. Two samples for compound explosives - Composition B-3 and Pentolite - were produced by mixing the powder-form PETN, RDX, and TNT with the actual concentration ratio for making the above commercial plastic explosives. A mixture of 60% RDX and 40% TNT was used for Composition B-3, and 70% PETN and 30% TNT for Pentolite, following the composition information from [9]. The mass of each pellet was approximately 180 mg.
The time-frequency localization characteristics of wavelet transform make it an effective representation of pulsed data [24]. Therefore, THz pulses, localized in both time and frequency, seem to be naturally suited to wavelet-based signal processing methods [19]. The defining equation of wavelet transform is presented as
where
Signal denoising is conducted by thresholding. In our work, we have chosen one of the most popular methods for denoising – hard-thresholding – defined by
where
Additionally, since wavelet bases closely resemble THz waveforms, it is natural to assume that wavelets will outperform the conventional techniques. The applicability of this assumption to THz pulses of explosive materials is shown in the following sections of this paper.
3.2. Wavelet Power Spectrum Estimation
The power spectrum of a THz signal
where
If
where
where
Numerical data-analysis techniques have been developed which deal with selectively choosing the wavelengths for the desired use [27, 28]. Although these methods are capable of producing a highly accurate and complex analysis, they have not been widely utilized due to computational complexity and difficulty. We have investigated a means to select wavelengths in the THz regime for improved component analysis of compound explosives pursuing simplicity and practical ease.
After obtaining the THz spectra of the explosives samples, specific wavelengths are selected for each spectrum. Because the spectrum presents unique characteristics for each material, frequency ranges with high amplitude difference between other materials are chosen. This improves the orthogonality and independence from one another, making each component of the compound explosive into a pseudo-eigenvector. Additionally, since the chosen frequency ranges naturally exclude the absorption peaks from the water molecules, a digital compensation for the atmospheric degradation of THz data takes place. These wavelength-selected-spectra are then used for the spectroscopic evaluation of compound explosives.
4.1. Temporal Denoising of THz Pulses
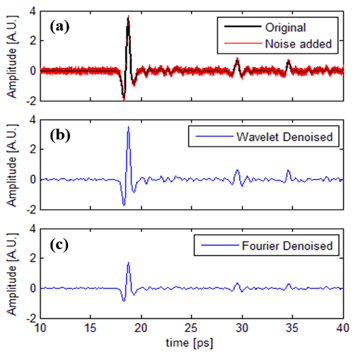
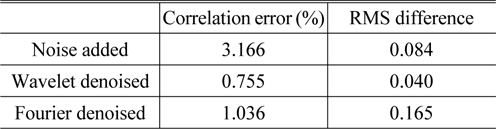
The performance of denoising via Daubechies wavelets (14 vanishing points, scale 2) [24] (by hard thresholding) was compared with that of Fourier denoising (lowpass filter with a cutoff frequency at 3 THz – spectral bandwidth of interest with a reliable SNR). A THz pulse signal of polyethylene (Sigma-Aldrich) was used for verification. A total SNR of 15 dB was computationally set with scaled additive white Gaussian noise, as shown in Fig. 2(a). Results show that noise reduction in the time-domain using wavelet thresholding (Fig. 2(b)) is superior to Fourier denoising (Fig. 2(c)). We can see from Table 1 that wavelet denoising showed approximately a 76% decrease in pulse correlation error which is significantly more effective than that of Fourier denoising, and a fourfold better pulse amplitude restoration. Correlation error is defined by
where

Correlation error and RMS difference (between the original THz pulse) comparison of the wavelet denoised and Fourier denoised pulses
Ultimately, THz pulses of PETN, RDX, and TNT were denoised via Daubechies wavelets. We could confirm that wavelet-based techniques work effectively in terms of denoising and preserving pulse information of explosive samples, as presented in Fig. 3.
4.2. Spectral Oscillation Maintenance
In Fig. 3, we can see reflected echo pulses following the primary THz pulse, resulting from the etalon effect in samples and optical components (e.g. THz emitter and detector) in the THz-TDS setup. These secondary peaks give rise to spectral oscillations in the THz spectrum. In the algorithm level, the most conventional and widely used technique to remove such fluctuations is ‘the truncating method’, in which the time-domain data is truncated with the echoes excluded. Spectral oscillation maintenance was conducted using both the truncating method and the WPSET.
The characteristic peaks in the absorbance spectra of PETN, RDX, and TNT reported in previous literature [12] and those obtained by the WPSET and the truncating method are provided for direct comparison in Table 2. From Table 2 and Fig. 4, we can see that the peak positions obtained from the two methods show difference. Although some peaks are well presented using the truncating method, the overall accuracy falls below from those of the WPSET. The second peak of RDX and the first peak of TNT could not be detected using the truncating method. On the other hand, it is clear that the WPSET not only reduced oscillations in the frequency-domain, but also facilitated accurate peak detection for the explosives samples. The obtained peak position data via the WPSET suggest its high credibility over the truncating method with regards to the accuracy, precision, and spectral resolution for component analyses of compound plastic explosives.
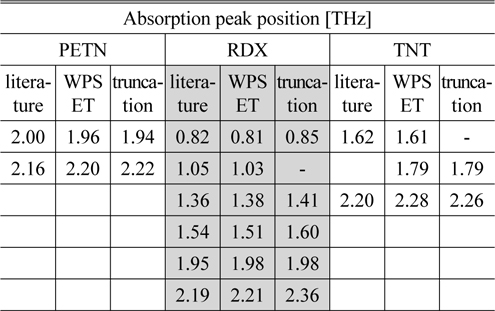
Characteristic peaks in the absorbance spectra of PETN, RDX, and TNT obtained by the WPSET, truncating method, and those reported in previous literature
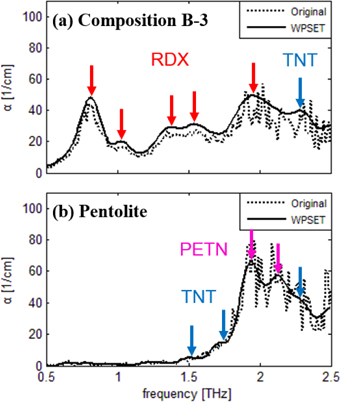
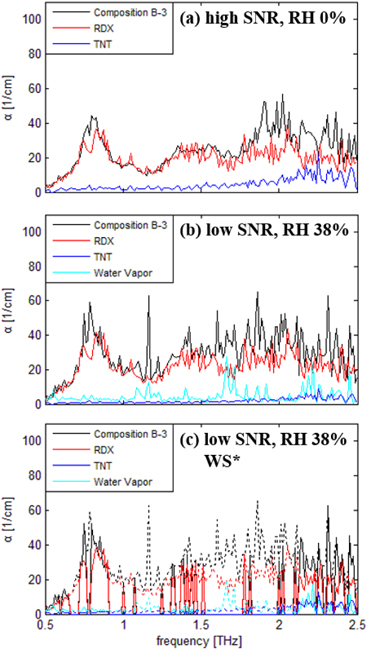
Ultimately, characteristic peaks in the THz absorbance spectra of Composition B-3 and Pentolite were identified through the WPSET, therefore providing a valuable prediction about the constituent materials. We could verify the presence of RDX and TNT from the absorbance peaks of Composition B-3 (Fig. 5(a)), and PETN and TNT from the peaks of Pentolite (Fig. 5(b)). Absorption peak positions shown in the spectra of compound explosives were in good agreement with those of pure explosives.
4.3. Component Analysis of Compound Explosives
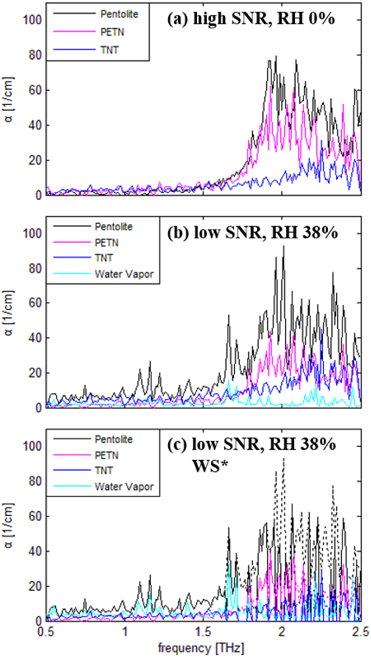
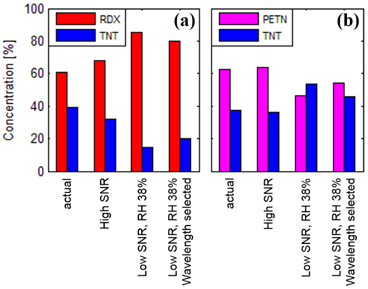
Component analyses of compound explosives Composition B-3 and Pentolite were first conducted with THz data gained in a laboratory-set fair environment. The compound explosive samples were purged in dry nitrogen for the acquisition of THz pulses without the high absorption of water vapor. Additionally, a relatively high SNR could be obtained by setting the time constant of the LIA to 1.3 s. Fig. 6(a) and 7(a) respectively illustrate the concentrations of the constituent explosive materials in Composition B-3 and Pentolite.
Analyses were conducted not only in fair settings, but also in humid and noisy conditions. A low SNR (LIA time constant of 400 ms) and relative humidity (RH) of 38% at 19.5℃ were installed to visualize detection feasibility in real outdoor environments. Figures 6(b) and 7(b) show the amount of constituent elements in Composition B-3 and Pentolite in this setting. Furthermore, wavelength-selectedspectra of the compound explosives provided more accurate component analysis results, compensating for the humid and noisy conditions (Figs. 6(c) and 7(c)).
The obtained concentration values of the constituent elements in the compound explosives are visualized in Fig. 8. We can see a huge concentration error in the humid and noisy environment, and the level of error decrease (approximately 22.7% for Composition B-3 and 48.8% for Pentolite) after wavelength selection. Table 3 shows the concentration error from the component analysis in detail.

Concentration ratio error from the component analysis results of Composition B-3 and Pentolite
We clearly presented experiment results regarding effective temporal denoising, spectral oscillation maintenance, and water vapor absorption compensation, suggesting an overall component analysis scheme for compound explosive materials. To the best of our knowledge, this is the first case where qualitative and quantitative component analyses on Composition B-3 and Pentolite were conducted. With enhanced SNR and effective peak detection via wavelet thresholding and the WPSET, straightforward spectral analyses could be conducted. Wavelength selection of each component spectrum improved the component analysis accuracy, compensating for the atmospheric degradation. This study shows the successful applicability of the proposed analysis scheme via THz-TDS to compound explosive materials. This is a dynamic field of research and further work must be done. Mathematical modeling of the THz pulse and optimized wavelength selection hold great potential for future research.