CIGS based thin-film solar cells have received much interest due to their high optical absorption coefficient, wide absorption wavelength, and high stability. CIGS solar cells have achieved the highest energy conversion efficiency compared to a-Si and CdTe based thin film solar cells, recent studies showed efficiencies as high as 20% [1 2]. To enhance light absorption in solar cells, several light trapping techniques are used, such as textured surface interfaces between multi-layers of solar cell [3], nanoparticles or nanostructures on surfaces [4], nanostructures inside an active layer [5], and others [6]. Among them, textured surfaces are inherently formed at interfaces between layers in the fabrication processes such as chemical vapor deposition (CVD), sputtering, and co-evaporation for CIGS solar cell. In the optical modeling of solar cells, the surfaces at the interfaces are generally considered flat, and hence, the scattering at the surfaces are not considered. There has been research for optical simulations of rough surfaces at amorphous Si:H solar cells [3 7]. In the case of considering both textured surfaces and incoherent nature of sunlight, however, this approach is not proper because the input light of solar cell is incoherent sunlight. Several research results for modeling incoherent or partially coherent light have been reported [8-10]. But these simulated the incoherent light only and did not consider the roughness of the surfaces. In this paper, a RCWA with Fourier analysis is presented to simulate both the textured surfaces and incoherent light of a CIGS solar cell [11 12], and is proved by experimental results to be a proper simulation method for solar cells.
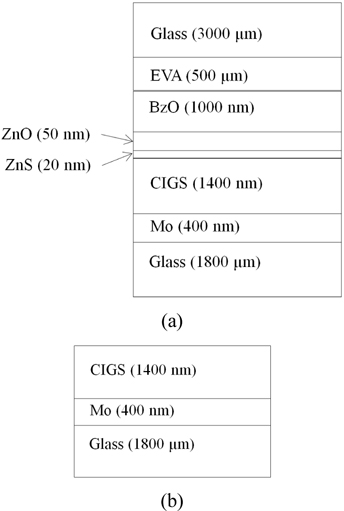
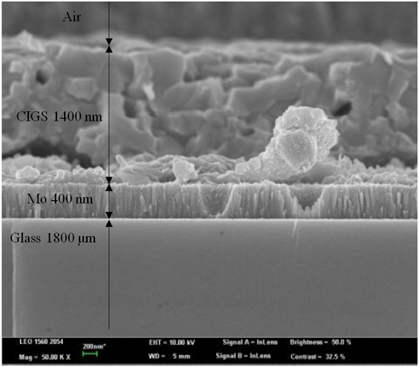
The conventional schematic of the CIGS solar cell is shown in Fig. 1(a). There are two glass cover layers at the bottom and the top of the cell, and the EVA layer is a surface flattening layer which has pyramidal surface structures to reduce the back reflection. ZnS and ZnO layers are the n-type and upper ohmic contact layers, The CIGS layer is a p-type semiconductor in p-n diode scheme, and the Mo layer is the bottom ohmic contact layer. The thickness of CIGS is the value at which the CIGS layer absorbs over 99% of the input light on our fabrication condition. But in this paper, only the textured surfaces of the CIGS layer are concerned. Therefore, as shown in Fig. 1(b), the solar cell is fabricated of three layers; bottom glass, Mo metal conductor layer, and active CIGS layer by using the co-evaporation process. The bottom glass size is 370 mm by 470 mm, and the Mo layer is deposited on the glass substrate by sputtering. The CIGS layer is grown by first depositing an (InGa)2Se3 layer and reacting it with Cu and Se. By detecting the temperature change of the substrate, the compositional control was achieved. In the presence of Se, the CIGS layer was made by co-evaporation of In and Ga. The cell is made just for measuring the optical effects of surface roughness of the CIGS layer, and hence, without the upper layers, the solar cell is not functioning, that is, no currents are made from the input light. In the experiments, only the effects of surface roughness are considered.
Figure 2 shows a SEM image of the fabricated CIGS cell of Fig. 1(b). The cell size is 370 mm by 470 mm. Due to the rough textured surfaces of the CIGS layer, the input light is scattered into the CIGS layer and the back reflection becomes lower than that of the flat surfaces.
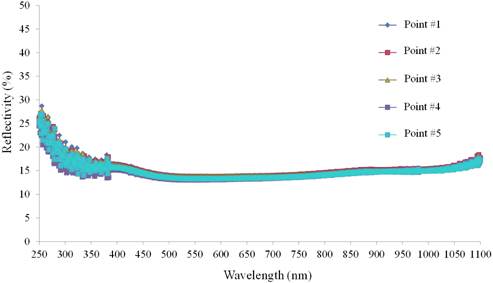
The reflection spectra are measured at five points of the CIGS cell using a UV/VIS spectrometer (Perkin Elmer’s Lambda 35), in which an integrating sphere is used to collect the reflected light, and are shown in Fig. 3. The five points are selected over whole area of the cell but near the center rather than the edges. The transmission through the cell is negligible due to the absorption in the Mo layer. The reflection spectra of Fig. 3 show nearly the same results, and hence, in the simulations, the reflectivity of the point #1 is used to compare the calculations.
In Fig. 3, there is no sinusoidal fluctuation of the power spectrum, which is generally shown in the Fabry-Perot cavity under the coherent light input. Therefore, the incoherency should be considered to simulate the optical properties of the multilayer solar cells which have Fabry-Perot cavities. To verify the effect of the incoherency and the textured surfaces, in the simulation, the RCWA method and Fourier approach are used [10 11].
In the simulation of the CIGS cell, both TMM and RCWA methods are used. TMM method [6-8] is a very simple and fast algorithm with the capability of modeling incoherent light, but cannot deal with non-flat structures such as gratings, nanostructures, and rough surfaces. RCWA method, however, can simulate the light scattering from the non-flat objects in the layered structures [11], and hence, RCWA is a proper simulation method for the incoherent light and for the textured surfaces of the CIGS solar cell due to its faster calculation algorithm compared to FEM (finite element method) and FDTD (finite difference time domain). RCWA method can calculate the diffracted waves through the Fourier modal analysis. To calculate more diffractive waves, the number of Fourier modes should be increased. But the more Fourier orders are considered, the more computing power is needed. The numbers of the Fourier mode and the staircase are set to 100 and 200, respectively, which are large enough to obtain accurate results. The Fourier order 100 means that there are 201 Fourier modes that are numbered as -100, -99, , -1, 0, 1, , 99, 100. In the RCWA simulation, the rough surface thickness is set to 200 µm and divided into 200 staircases, so each staircase has a thickness of 1 µm. If we use more layers over 200, then we would need more computing power, however, the accuracy might be saturated, and hence, 200 is a proper value for the staircase approximation. At each layer of the rough surface, the CIGS has different width and the 201 diffracted (or scattered) modes are calculated. The parameters for RCWA simulation are specified in Table 1. The periodic boundary condition is used because the horizontal dimension of the cell (370 mm by 470 mm) is much larger compared to the vertical dimension (µm order except for the glass substrate). The simulation program was coded using the MATLAB parallel computing toolbox and a high computing power workstation with 8 cores and 128 GB RAM was used.
[TABLE 1.] Parameters for RCWA simulations
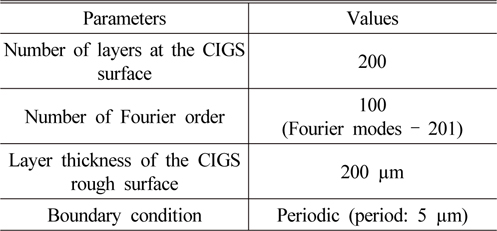
Parameters for RCWA simulations
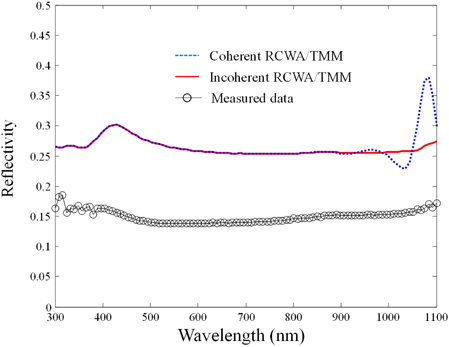
In the simulation, based on the previous research [10], the incoherent calculations were performed by using the results of the coherent RCWA simulation. For the incoherent input light, the coherence time is set to about 0.02 - 0.04 ps from the black body radiation cases [13], having a value similar to that of sunlight. Figure 4 shows the simulation results for the three-layer CIGS cell of Fig. 1(b). The simulation result of the RCWA and TMM assuming coherent light input becomes incorrect compared to the experimental results when the wavelength of light is larger than 900 nm. The fluctuations of coherent RCWA/ TMM cases are induced by the interferences due to the Fabry-Perot cavities in the layers of the cell. The incoherent simulation shows the reflection spectra well matched compared to the experimental results in view of spectral shape in longer wavelength. But the reflectivity of the simulation is about 10% higher than that of the experiment over the whole wavelength region. The lower reflectivity of the experiment might results from the textured CIGS surface. The scattering at the rough surface causes the lower reflectivity of the cell.
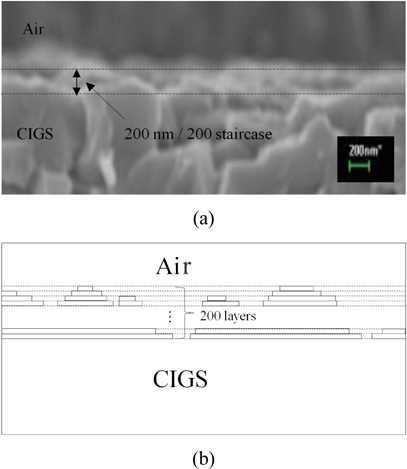
To simulate the effect of the textured surface, the surface of the CIGS is modeled into multiple layers with stepwise approximations as shown in Fig. 5. This kind of modeling textured structures into a multi-layered staircase approximation may result in calculation error. But with a sufficient number of layers and the Fourier order, the calculation error can be lowered enough to use this method.
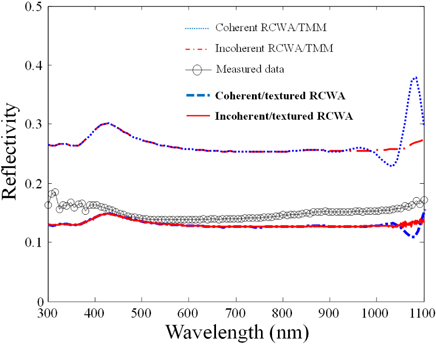
The optical constants of CIGS such as absorption coefficients and refractive index are from Ref. [14]. Due to the high surface roughness of CIGS, optical constants cannot be obtained exactly by the ellipsometer measurement. Because of the lack of the lab facilities for the exact measurements of CIGS according to Ref. [14], the optical constants of Ref.[14] are used in this simulation, which results in differences in the reflection spectra between the measurements and the simulations. Figure 6 shows the reflection spectra of the incoherent and textured CIGS simulation compared with the measurement results and other simulations.
From Fig. 6, the simulation considering both textured surfaces and incoherency shows well-matched results with the experiments. The simulation results only with incoherency show about 10% higher reflectivity than that of the experiment and the simulation only with textured surface shows Fabry-Perot fluctuation at long wavelength domain, which is not shown in the experiment. Therefore, the simulation considering both incoherency and textured surface is a proper method for modeling solar cells.
In this paper, several optical modeling methods of a CIGS solar cell were considered. To obtain the exact properties of a CIGS solar cell, both the incoherency of the sunlight and the roughness of the surfaces between each layer should be considered. The stepwise approximation of RCWA with Fourier analysis is shown to be a proper candidate for CIGS modeling by the experimental and simulation results. In the case of nanostructures inside the solar cell, the proposed method can be used due to its fast calculation algorithm and capability of handling incoherency and the textured surface.