With the population explosion, associated with increasing industrialization and urbanization in the last few decades, the study of ecology has gained importance, evolving as a separate discipline. During the last three decades, the research in this field has gained momentum due to the occurrences of natural calamities in addition to the focus on climate change. Researchers are trying to find the causal relationships among different environmental factors and are addressing different issues to tackle them in future.
Ecology is the study of interactions between organisms and their environments (Stiling, 1999). Ecology is an interdisciplinary field that includes Biology and Earth Sciences. To expand the scope of the field, ecology deals with the relationships between air, land, water, animals, and plants, usually of a particular area, or their scientific study. The rationale for taking up this field is that ecology is a rapidly advancing field that evolves almost every day with new concepts, new areas of scientific focus, and innovative technologies. One more reason is that, unlike disciplines in the humanities, in ecology the issues are similar across the world (with every country facing issues that can be compared), enabling a true comparison of participation of international communities of researchers. The literature of ecology is neither precisely located nor rigidly defined. A possible bibliographic means of capturing the literature of ecology is through journal articles which are the most vital mode of communication among scientists (Thanuskodi & Venkatalakshmi, 2010). Realizing the importance of this area of research, the present study attempts a bibliometric depiction of three leading journals in ecology, namely,
Pritchard (1969) explained the term bibliometrics as “the application of mathematical and statistical methods to books and other media of communication.” Sengupta (1985) stated that bibliometrics studies lies between the broader areas of the social sciences and the physical sciences. Borgman (1989) indicated the scope of bibliometrics by mentioning that scholarly communication can be studied by bibliometric methods using one or more of three theoretical variables: producers of communication, artifacts of communication, and communication concepts. Feather and Sturges (1997) reported that ‘bibliometric’ refers to the study of the use of documents and patterns of publication, by means of mathematical and statistical methods. Bibliometrics can be divided into ‘descriptive’ and ‘evaluative’ approaches, both of which can, in turn, be further divided by ‘productive count’ (geography, time, and discipline) and ‘literature count’ (references and citation).
There are several studies analyzing the contribution of different journals in the field of ecology. A study conducted by Liao and Huang (2014) laid stress to the fact that aquatic ecosystems were ecologically important but continuously threatened by a growing number of human induced changes, and evaluated the research trends of ‘aquatic ecosystems’ between 1992 and 2011 in journals of all subject categories of the science citation index and social sciences citation index.
The study of Parker et al. (2013) examined the publication and citation patterns of the world’s most highly cited environmental scientists and ecologists, inquiring into their levels of scientific productivity and visibility, examining relationships between scientific productivity and quality within their research programs, and considering how different publication strategies contribute to these distinctive successes. The paper concluded that highly cited researchers were also highly productive, publishing on average well over 100 articles each. Additionally, articles published by this group were more highly cited on average than articles published in premier generalist journals like
Goodland (1975) worked on the tropical origins of ecology. Arunachalam and Manorama (1988) analysed the standards of Indian ecology journals. Budilova et al. (1997) conducted scientometric analysis of publications from the journals
The review revealed that there were not many studies in the area of ecology literature, especially in more than two journals or cumulative journal studies. Hence this paper attempts to study the research trends in ecology literature in the selected three ecology journals.
The purpose of the present study was to examine the quantitative growth of literature in the field of ecology during 2003-2012 from three journals covering the authorship pattern, authors’ collaboration, applicability of Lotka’s law, authors’ dominance, subject-wise distribution, institution-wise distribution of contributors, and geographical representation of publications.
The following two hypotheses were cast: that research trends in a dynamic scientific discipline like Ecology change over the course of a decade, reflecting the fluctuations in the field based on the issues prevailing during the period and also based on the priorities of the funding agencies; and multiple authored publications would be more in number than single authored ones.
The analysis included three chosen journals in the field of ecology listed below. The choice of these journals was based primarily on impact factor (impact factor is the average citation rate of a journal’s articles). The three journals were identified on the ISI Web of Knowledge℠ in the Journal Citation Report® under the Subject Category Section ‘Ecology’ with the 2012 impact factor and sorted by 5-year impact factor in decreasing order. (Journal Citation Report® - journal performance metrics offer a systematic, objective means to critically evaluate the world’s leading journals.) To strengthen the data fruitfully, personal interaction with domain experts in ecology was also conducted. The following are the journals undertaken for the study:
1. Ecology Letters (John Wiley & Sons Ltd./Centre National de la Recherche Scientifique, France. ISSN: 1461-023X. Start year: July 1998; Frequency: 12 Issues/Year). 2. Trends in Ecology Evolution (Elsevier Science, England. ISSN: 0169-5347. Start year: July 1986; Frequency: 12 Issues/Year). 3. Annual Review of Ecology Evolution and Systematics (Annual Reviews, USA. ISSN: 1543-592x. Start year: 1970; Frequency: 1 Issue/Year).
The keywords used were “Ecology Letters or Trends in Ecology & Evolution or Annual Review of Ecology Evolution and Systematics” as search terms in the field of “Publication Name” and the time period was limited to 2003-2012 (10 years). A total of 2,946 records were retrieved. Once a marked list of papers was created, the resulting export file was processed by HistCite™ (Bibliometric Analysis and Visualization Software developed by Garfield et al., 2006) in accordance with the stated objectives.
6. BIBLIOMETRIC INDICATORS AND LOTKA’S LAW
Bibliometric indicators are the principal tools for measuring research output, while providing a very good tool — contrary to popular belief — for research conducted by other types of actors. For this reason, they deserve a place in scientific and technological directories (Bradford, 1934).
Collaborative Index (CI) is the number of authors per paper, as first given by Lawani (1980). Let the collection A be the research papers published in a discipline or in a journal during a certain period of interest. In the following, we write
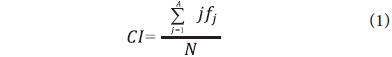
Where, fj = number of papers having j authors in collection A N = total number of papers in A. N = Σ jfj A = total number of authors in collection
As a measure of mean number of authors, although CI is easily computable, it is not easily interpretable as a degree. Moreover, it gives a non-zero weight to single authored papers, which refers to no collaboration (Karpagam et al., 2012).
Degree of Collaboration (DC) is a measure of proportion of multiple authored papers derived by Subramanyam (1983) as,

Where, DC = degree of collaboration Nm = Number of multi authored publications Ns = Number of single authored publications
6.3. Collaborative Coefficient
DC does not differentiate among levels of multiple authorships. Collaborative Coefficient (CC) was designed to remove the above shortcomings pertaining to CI and DC by Ajiferuke et al. (1988). CC is used to measure the extent and strength of collaboration among the selected three ecology journals. It can be expressed mathematically as:

Where, fj = Number of j authored papers N = total number papers A = Greatest number of authored papers
Lotka (1926) published his pioneering study on the frequency distribution of scientific productivity. Lotka’s law is one among the three classic laws of bibliometrics, used to test the regularity in the publication activity of authors of scientific literature.
It states that, “the number (of authors) making n contributions is about 1/n2 of those making one; and the proportion of all contributors that make a single contribution is about 60 percent”, which means that out of all the authors in a given field, 60% will have only one publication, 15% will have two publications, and 7% of authors will have 3 publication and so on (Rowlands, 2005). In other words, within a particular topic, for every 100 authors whose contribution is single article, there will be 25 authors with two articles, 11 authors with three articles, etc. The generalized form of Lotka’s law can be expressed as

Where y is the frequency of authors making
According to Pao (1985), the following procedure should be followed in studying the application of fit of Lotka’s law to a given data sample.
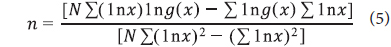
The first step in the application of Lotka’s law is to determine the value of ‘

Where, N = number of pairs of data considered, x = 1, 2, 3…. xmax X = logarithm of x, i.e. number of articles Y = logarithm of y, i.e. number of authors
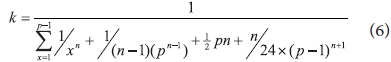
The value of k, which is the theoretical number of authors with a single article, is determined from the following formula:

Here
The analysis of the data was done with a view to measuring the growth of literature over the years, authors’ productivity, subjects, institutions, and country-wise distribution of papers in the selected three journals, namely,
7.1. Growth of Ecology Literature
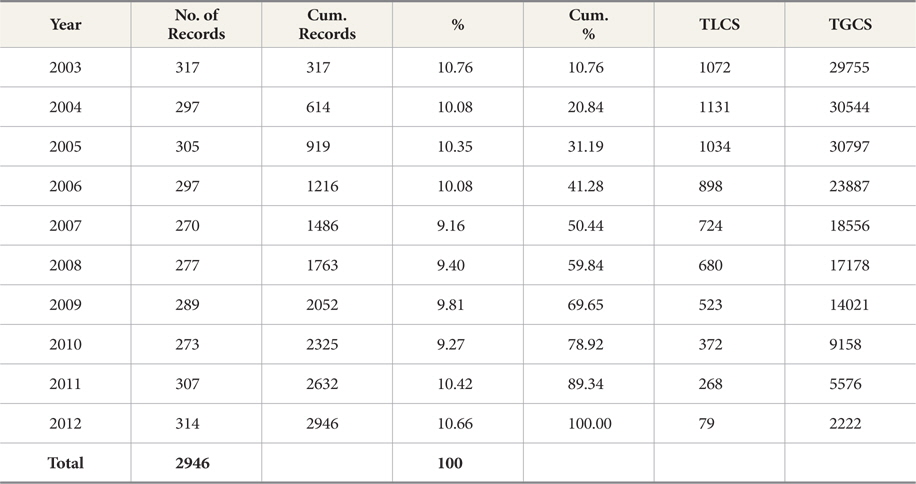
Table 1 presents the results of cumulative publications of the three journals. It was observed that the growth trend was linear. Fluctuations in publication patterns of ecology literature were noticed throughout the period of study. However, the highest number of publications was recorded in 2003 while the lowest was in 2007. The reason could be the frequency of journals, as there is an inconsistency in the number of issues published (Table 2). Another possible reason could be the shift in research focus from the field of pure ecology to applied specific research areas. Such changes in priority areas are discussed later in the paper.
[Table 1.] Cumulative distribution of ecology literature for the three selected journals

Cumulative distribution of ecology literature for the three selected journals
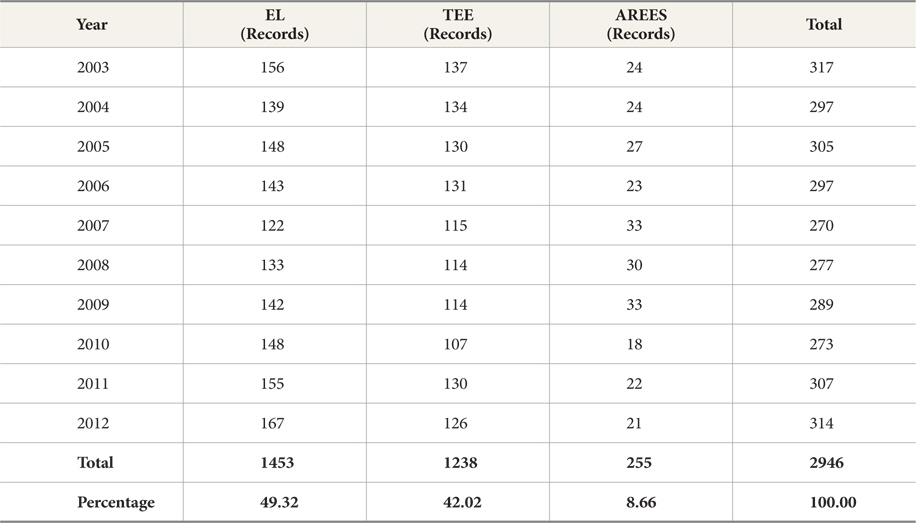
[Table 2.] Year-wise distribution of articles in the three selected ecology journals

Year-wise distribution of articles in the three selected ecology journals
HistCite™ calculates the total local citation score (TLCS) and the total global citation score (TGCS). TLCS is the number of times a paper is cited by other papers in the local collection, which in the study is the citation scored by the collection of 2946 papers in the three journals. TGCS is the number of times a paper is included in the collection cited in WoS.
The journal-wise total research productivity of ecology journals for the years 2003-2012 is presented in Table 2. It was observed that
Analysis of collected data showed that the literature on the subject ‘ecology’ was published in nine different forms
7.2. Authorship Pattern and Collaborative Measures in Ecology Literature
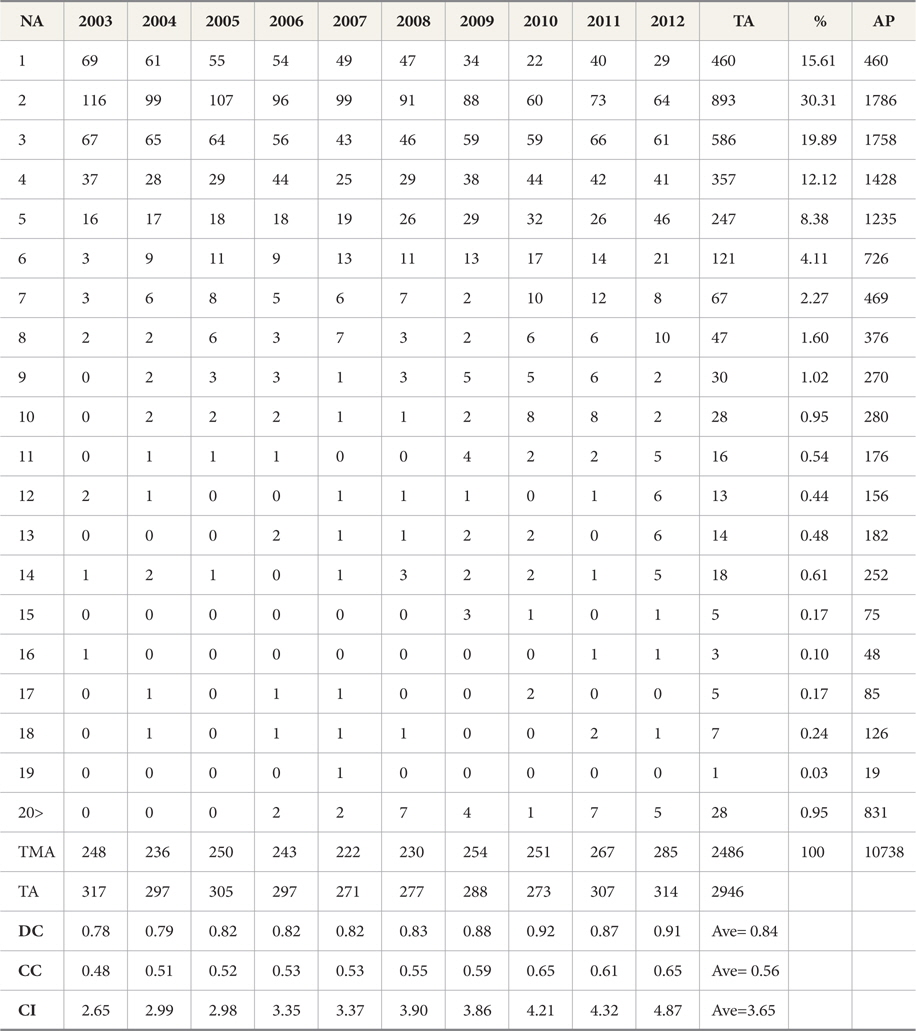
Collaborative research can be effectively measured from the number of authors in papers. Such studies can be conducted to understand global trends, national trends, or trends in different subjects. However, the extent of collaboration may not be revealed from the citations. Efforts in this direction have been made by Ajiferuke et al. (1988) who attempted to define ‘good collaboration’ measurers. With a view to identifying the extent of research conducted by individuals in collaboration with each other, the number of authors mentioned in the papers was counted and analysed. Table 3 gives the distribution of articles on the basis of authorship pattern (cumulative) of the three journals. Multiple authorship was dominant in the present study (Saravanan et al., 2012) which indicates that researchers normally prefer co-operative and collaborative works (Parker, 2013). The other factors such as nature of the project, magnitude of instrumentation, popularity, and the rate of expansion of the area of science may also affect this tendency. It was found that two authored papers (30.31%) were followed by three authored papers (19.89%), while the contribution of sole-authored papers (15.61%) was low. In essence, this shows a clear trend towards multi-authored papers (84.39%). This proves that our second hypothesis of “Multiple authors are predominant over single authors” is valid.
[Table 3.] Authorship pattern (cumulative) of the three ecology journals

Authorship pattern (cumulative) of the three ecology journals
The Degree of Collaboration (DC) was almost uniform through the years studied (standard deviation <0.05) while the Collaborative Coefficient (CC) (average 0.56) and the Collaborative Index (CI) (average 3.65) were more variable as evident in Table 3. The average DC 0.84 indicates that collaboration was high among the authors in the journals under study. The CC is increasing year to year which shows the increase in the productivity of multi-authored papers.
The role of funding agencies was also assessed as this may significantly affect the course and discipline of research. The National Science Foundation, USA had funded many of the research works that were carried out in the journals during the study period.
7.3. Most Productive Authors and Lotka’s Inverse Square Law (Cumulative of Three Ecology Journals)
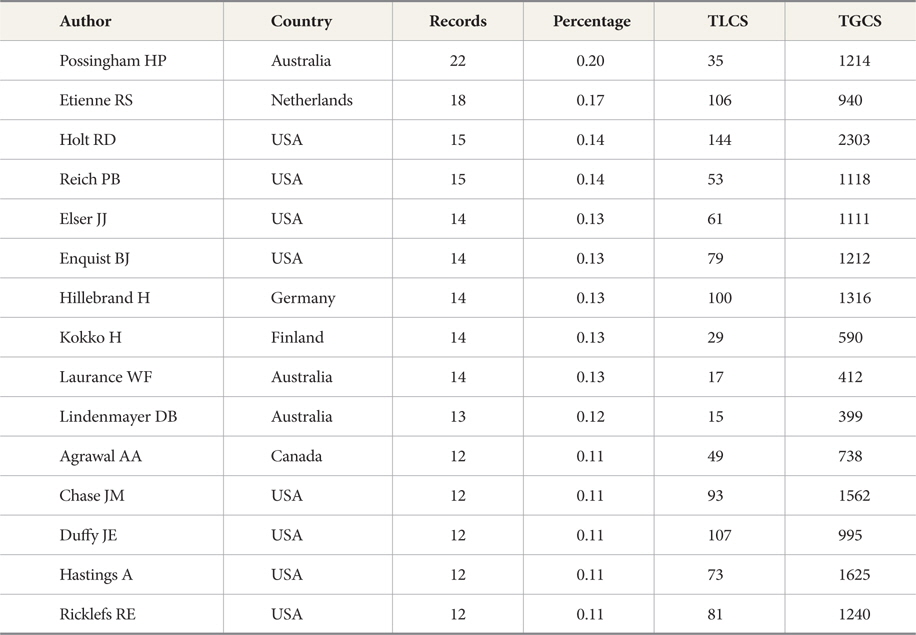
Author productivity is a measure for ranking authors according to their publication output. From 2003 to 2012, 2,946 papers were published by 6,697 authors in the three selected journals. Table 4 shows the top 15 most productive authors during 2003-2012. Among the top 15 authors who contributed to the three journals, 8 were from the USA, 3 from Australia and one each from the Netherlands, Germany, Finland, and Canada. The highest records were for H.P. Possingham with 22 (0.20%, 35 TLCS and 1214 TGCS). The other most productive authors, in decreasing order, are also provided in Table 4.
[Table 4.] Top productive authors vs. citations (first 15 authors)

Top productive authors vs. citations (first 15 authors)
The productivity of the paper contribution of the selected three ecology journals was verified to find the conformity with Lotka’s inverse square law using Pao’s (1985) method. This was done using equations (4-5) to know the values of ‘
Here ‘
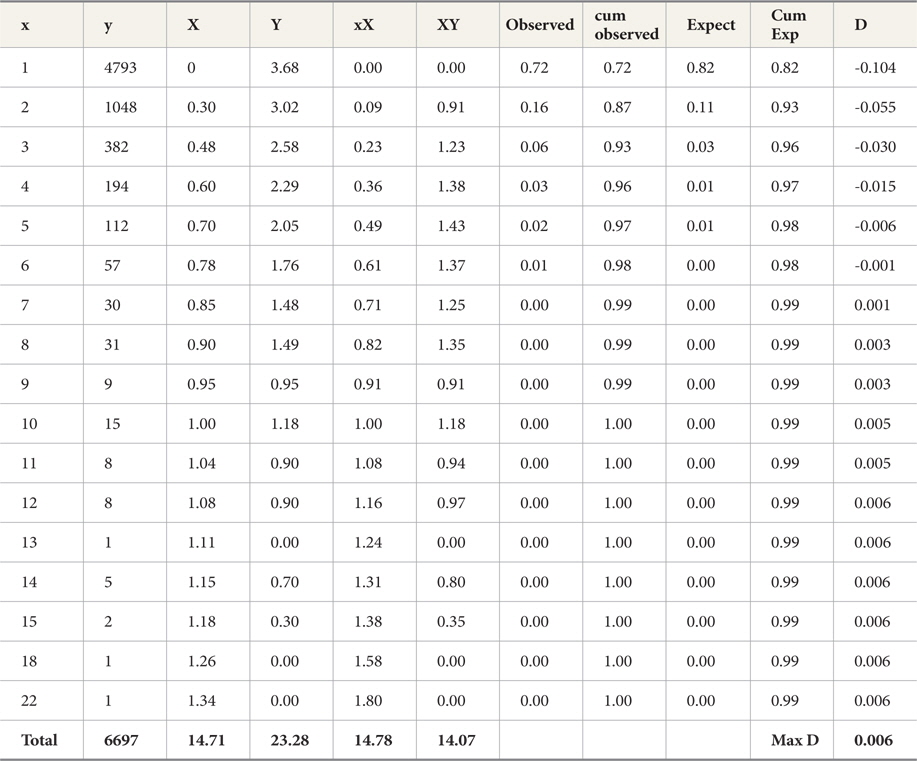
K-S test on observed and theoretical distribution of authors (cumulative of three ecology journals)
7.4. Subject-wise Contribution of Ecology Literature
The purpose of subject wise analysis is to identify the performance of researchers in various subject headings in ecology and its sub-fields. We have used Library of Congress Subject Headings along with three of our domain experts in ecology, and grouped the subject ecology in to 25 disciplines during the study period. The subject-wise analysis was carried out in accordance with Budilova et al. (1997).
To analyze the changes in the focus areas of publications in ecology, we sub-divided the study period into two blocks of five years and extracted the number of publications and their percentages, journal-wise, for the three studied journals (Table 6). We observed a decrease in publications in all the three journals in the disciplines of Movement, Interactions & Behavioural Ecology, Physico-Chemical Ecology, Soil Ecology, and Biogeography, while increase in publications was observed in the disciplines of Freshwater Ecology, Arid Zone Ecology, Fire Ecology, and Forest (Plant) Ecology. The total output of 2,946 subject keywords was classified and as expected the highest contributions were in the disciplines of Biodiversity and Evolutionary Ecology in the selected three ecology journals in the 2003-2007 block, while in the 2008-2012 block the highest contributions are from Biodiversity and Movement, and Interactions & Behavioural Ecology in the selected three ecology journals.
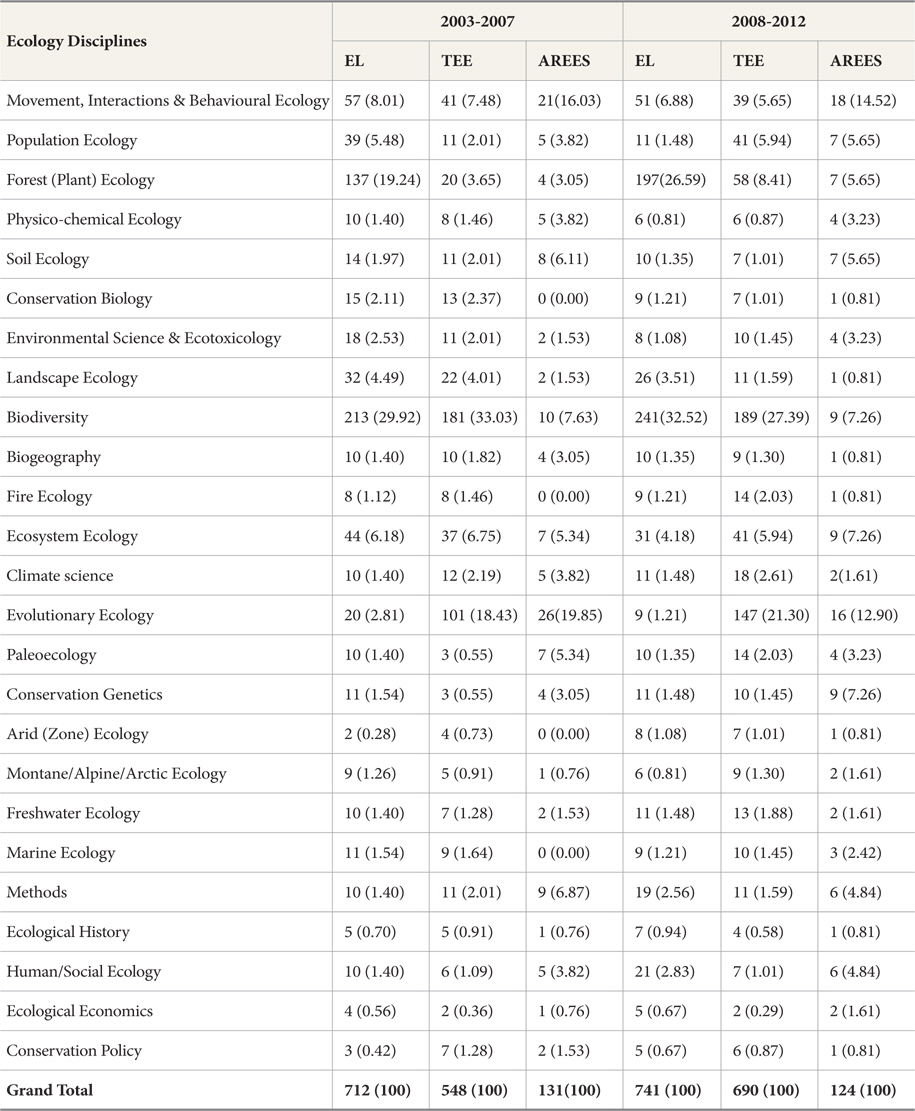
Discipline-wise publications and their percentages (in parentheses), journal-wise arranged in two blocks of 5 years (2003-07 and 2008-12)
7.5. Institution-wise Distribution of Ecology Literature
Analysis of references reveals that most of the research works in ecology were being pursued in universities and other higher educational institutions. Research institutes/laboratories were more active in the field of ecology. 2,946 papers were published in the journals during 2003-2012 with contributions from 7,536 institutions. The University Calif. Davis, USA was the topmost contributor in the list (Table 7) with 130 papers (1.73%, TLCS 561 and TGCS 12027), and remaining institution names with records are given below.
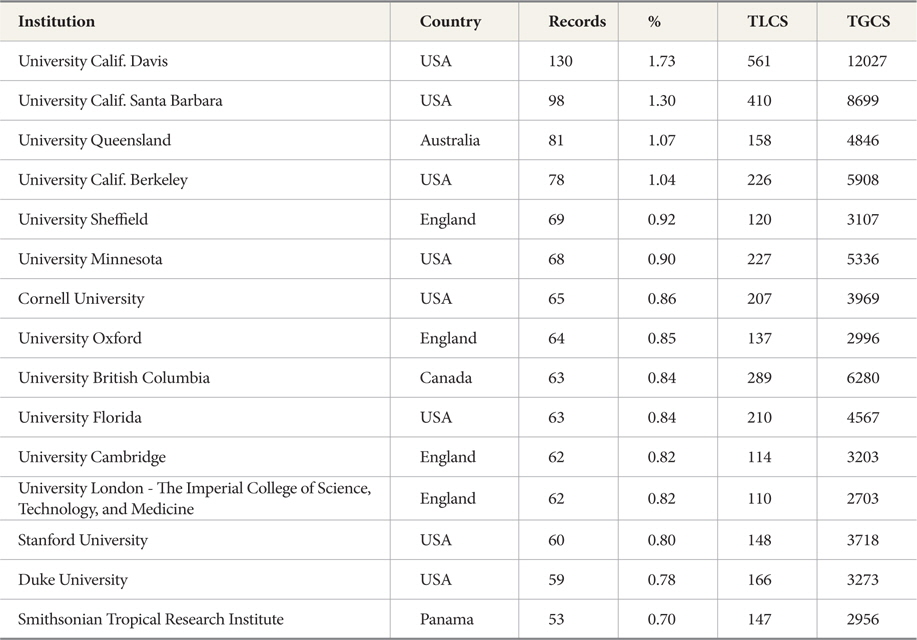
Institution wise distribution of contribution (Cumulative of three ecology journals) (first 15 institutions)
It is evident that American and British institutions contributed to 80% (12 out of 15 institutions) of the publications. It is of significance that ecologists have accepted that most of the impact of environmental and ecological damages will be felt higher in Africa and South Asia; no institutions from this region were listed in the top fifteen. In the Geographic distribution of articles (Table 8) the same trend was observed, though China occupies the 15th position.
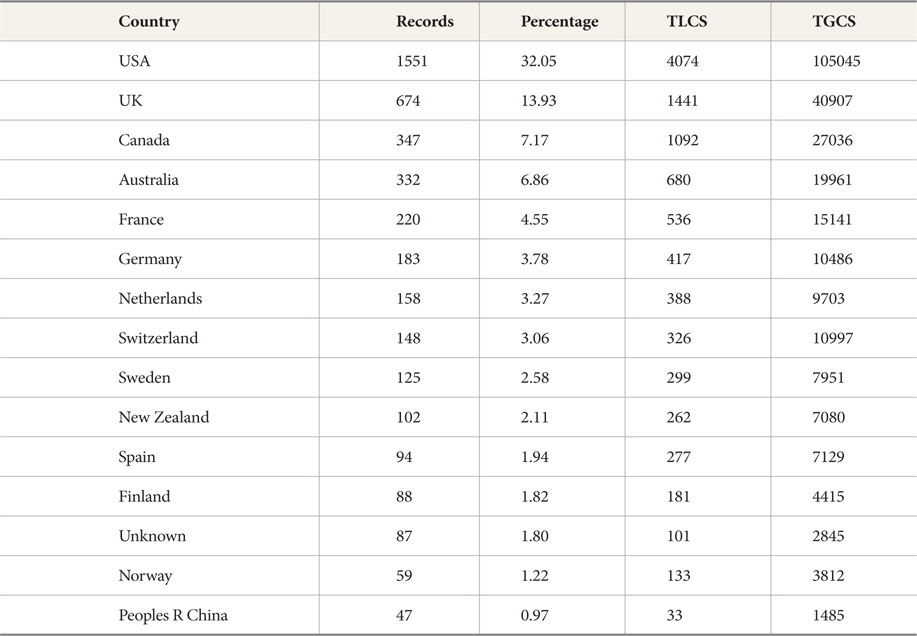
Geographical distribution of contributions (Cumulative of three ecology journals) (first 15 countries)
7.6. Geographical Distribution of Ecology Literature
Geographical analysis of papers revealed that during the period of study contributions from the selected three ecology journals numbered 2,946 from 82 countries (Table 8). The USA (1,551 papers, 32.05%, TLCS 4074 and TGCS 105045) has come in the top position followed by the UK. In another work by Biradar and Mathad (2000) the USA also has occupied the first position nation-wise in terms of papers. Nearly 90% of the publications have been contributed by authors from 15 countries; none of these countries is from the third world, clearly indicating the dominance of advanced countries in carrying out ecological research. We attribute this to better infrastructure, laboratory, and library facilities in the advanced countries. Language barriers do not seem to be an issue here as we can see that not all the countries in the list are English speaking (of course in many of the publications, collaborations and joint authorship would have included native English speaking persons). Though the third world countries are endowed with rich traditional knowledge, unfortunately such knowledge has not been translated into scientific outputs.
7.7. General Observations on Ecology Literature
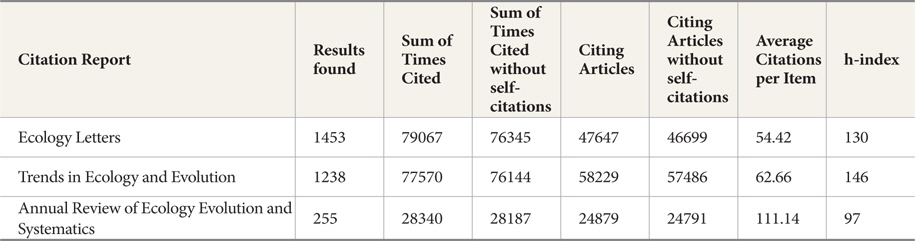
A general picture of the selected three ecology journals from Web of Science® is given in Table 9. A reference to a text or part of a text identifying the document in which it may be found, or the format of such a reference—which would typically include the author, title, and bibliographic description of the document—is called Citation. The method of calculating the citation rate that is followed by Web of Science® is accomplished by counting the number of references to the cited journal, but treating duplicate references from the same source article as only a single citation link.
[Table 9.] General observations on ecology literature in three ecology journals

General observations on ecology literature in three ecology journals
‘h-index’ is an index that quantifies both the actual scientific productivity and the apparent scientific impact of a scientist. Hirsch (2005) postulated that “[a] scientist has an index h if h of his or her Np papers has at least h citations each and the other (Np –h) papers have less than h citations each. The value of h is equal to the number of papers (N) in the list that have N or more citations” (Dhiman, 2012; Liao & Huang, 2014).
In Table 9,
This paper examines the authorship pattern, Degree of Collaboration, Collaborative Coefficient, Collaborative Index, and the Conformity of Lotka’s law in the present data set. The present work has taken up a detailed analysis of 2,946 papers from ecology literature over a ten year period (2003-2012) based on three leading journals, viz.,
The first hypothesis was tested with our findings as shown in Table 6 and the hypothesis was found to be validated. The trends did change remarkably, as also the thrust areas, within a time span of ten years. This is understandable as researchers in scientific disciplines tend to follow the issues that are in focus during a given time period. We feel that with advances in and easier access to communication facilities, the public becomes increasingly curious about many of the newer issues and developments, and these lead to more and more questions that have to be answered by the scientists. This process is dynamic, resulting in shifting of preferences for disciplines. While this is true for a few disciplines, biodiversity has remained the chief focus, indicating that this discipline has continued to be a highly-studied one all through the ten-year period. This is because studies on floral and faunal diversity are essential to understanding the life processes in both disturbed and undisturbed areas, hence finding its relevance in every possible situation.
Though the domain experts are in a better position to orient the subjects studied and the broad themes addressed, we understood, on interaction with experts, that scientists now need to focus more in the areas of climate change and pollution control. With more industrialisation and urbanisation, which lead to depletion and degeneration of natural landscapes and generation of by-products that may harm the globe in the longer run, focus may shift towards studying their effects and tackling them effectively. Both climate change and pollution control, in addition to the ever-required studies on biodiversity, do offer areas of future focus.
The first caveat of our work is that this study may not be completely indicative of current trends in the robust field of ecology, as the entire scope is restricted to the selected journals. There are many other journals dedicated to specific areas of the field, which may, when considered in totality, provide different results. Yet the work provides a reasonable glimpse of the works in the field of ecology, using reputable journals indicating the direction in which the field is trending. It will be interesting to replicate this work in a few years from now, incorporating more journals, to observe the changes in publication patterns in this discipline. It must be stressed that the discipline and topic studied during the period for the three journals (which can be extended to any publication in any discipline) will follow the course of the funding agency and the parent organizations.
The authors are convinced that the trends evinced in such findings would broadly reflect trends in the dynamic discipline of ecology.