The pioneering work of Trentini [1] and further research by James et al. [2] stimulated extensive study on the technique of producing a high-gain planar antenna using a simple source placed between the ground plane and a partially reflective surface (PRS). This technique has overcome several difficulties related to the narrow bandwidth and low antenna efficiency of patch array antennas, particularly when implemented at millimeterwave frequencies [3,4]. Applications of this type of antenna, including high-speed wireless local area networks, satellite reception, and various point-to-point radio links, have attracted much interest in recent years with regard to use in the upper microwave, millimeter-wave, and even terahertz regions [5-12].
The operating principle of this type of antenna can be explained in two ways: it is due to the resonant response of the Fabry-Perot-like cavity formed by the PRS and the ground plane, or it is due to the generation of a leaky wave. The gain and bandwidth depend on the reflection (amplitude and phase) from the PRS, as well as the distance from the ground plane. When the patch dipole is combined with the frequency selective surface (FSS), the input impedance of the patch dipole is changed and the resonance frequency of the composite cavity antenna is lowered. Achieving the best possible performance in terms of maximum gain, impedance and gain bandwidth requires careful frequency tuning of the composite cavity antenna. An exhaustive overview of the theory, design, and practical applications of these cavity-type antennas can be found in [13]. A recent review has described the research progress of Fabry-Perot resonator antennas based on different viewpoints and models of analysis [14], but few papers have focused on optimizing the common bandwidth, i.e., the overlapping frequency range between the impedance bandwidth and the 3-dB gain bandwidth, in a Fabry-Perot cavity resonator antenna. So-me papers obtained broad impedance bandwidth and broad 3-dB gain bandwidth separately. However, due to the mismatch of these frequency ranges, the common bandwidth effectively became narrower.
In this paper, we present the design of a cavity antenna with a broad common bandwidth that uses a Fabry-Perot resonance made of a ground plane and a thin PRS consisting of a twodimensional circular hole array. The antenna structure is designed for the
II. DESCRIPTION AND MODELING OF THE STRUCTURE
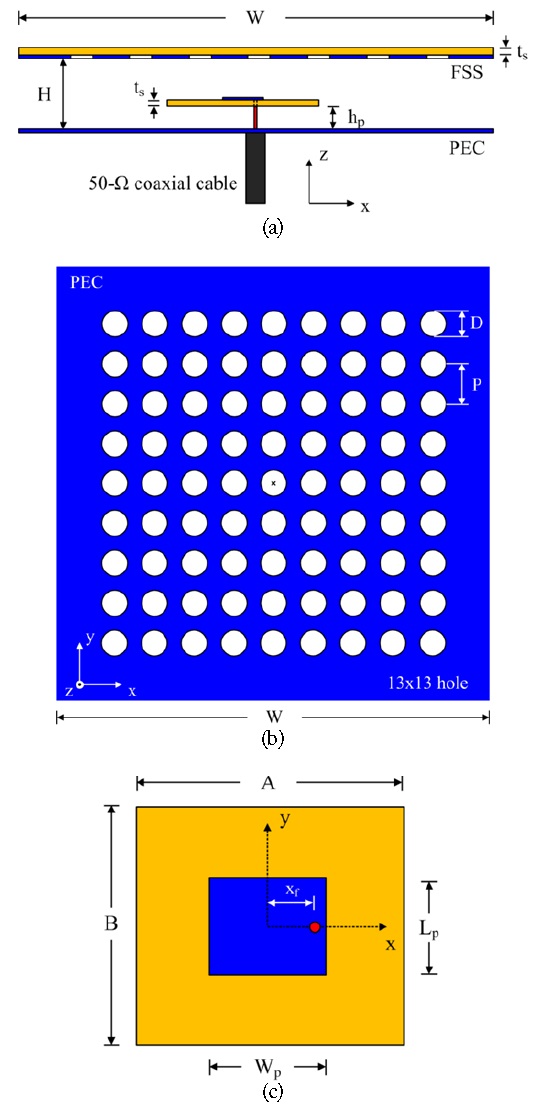
Fig. 1 shows the geometry of the proposed Fabry-Perot cavity antenna. The antenna can be considered as a parallelepipedal flat structure with a square base with 12 cm sides, which is approximately 5.8 λo at 14.4 GHz where λo is free space wavelength. The cavity is bounded by a ground plane and a PRS, where the ground plane acts as a perfect mirror and the circular hole array acts as a partially reflecting mirror. The cavity is filled with a foam whose permittivity is close to one; this ensures the spacing between these two mirrors. The thickness of the foam or the cavity height is denoted as
The PRS is realized with a circular hole array made of 13 × 13 elementary cells. The circular hole has the advantages of simplicity, unpolarized sensitivity, and increased degree of accuracy in lithography process, especially at high frequencies. In addition, this inductive FSS allows to design on a very thin and low permittivity substrate as a dielectric-free FSS which reduces either the dielectric substrate effects or the cost of a mask market production, particularly in the space applications [15]. The circular hole array is a bi-periodic array, where the periodicity and hole diameter are designated as
An electromagnetic simulation was performed using CST Microwave Studio (CST MWS; Computer Simulation Technology AG., Darmstadt, Germany) to analyze the characteristics of the proposed antenna. The transmission characteristics were first studied for a unit cell model consisting of a half-wavelength resonator, a single circular hole supported by RO4003 substrate, and a ground plane. The structure was modeled as an infinite array in the CST MWS by utilizing CST’s full Floquet mode implementation to simulate a single unit cell of the FSS. The periodic unit cell boundary condition is applied, which virtually repeats the modeled structure periodically and infinitely in two directions. The transmission behavior and the resonance frequency can be easily predicted by this simplified model, which is excited by a normal incident plane wave. The reason is that the beamwidth of the antenna is directly linked with the angular selectivity of the structure illuminated by a plane wave under the incident angle
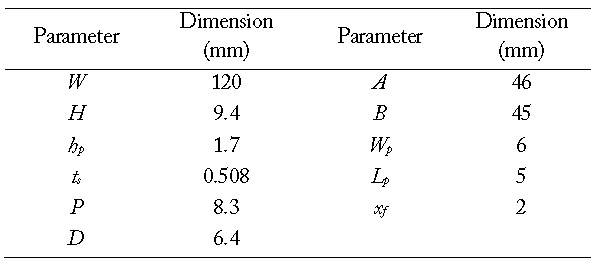
[Table 1.] Design parameters of the proposed antenna for optimum performance

Design parameters of the proposed antenna for optimum performance
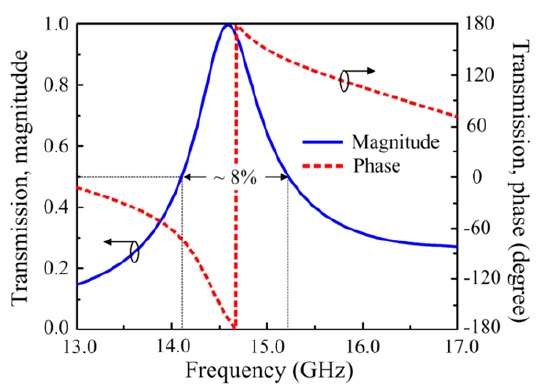
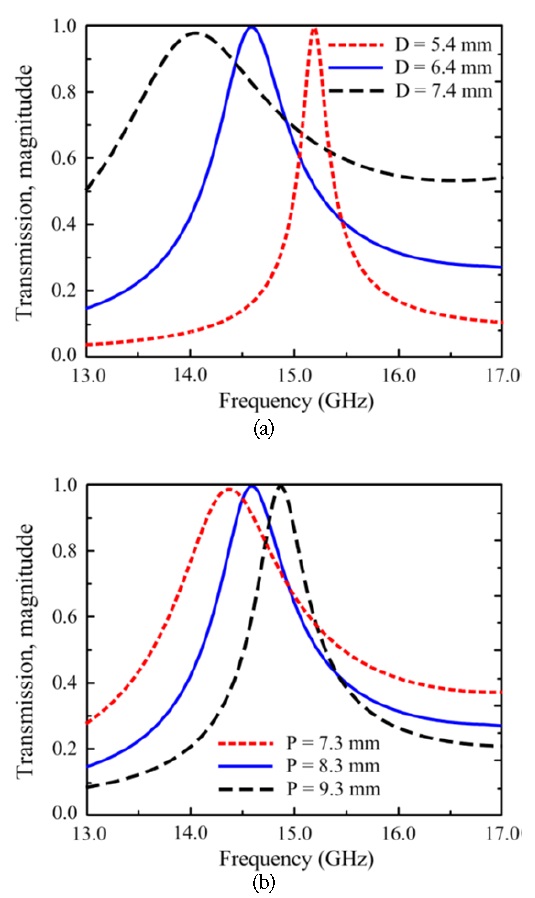
Fig. 2 shows the transmission of the cavity as a function of the hole diameter and hole array periodicity. The resonant frequency and the bandwidth of the unit cell are controlled by the hole diameter and periodicity. The larger hole diameter resulted in a decrease in the resonance frequency while the larger periodicity resulted in an increase in the resonance frequency. Wider transmission bandwidths can be obtained at the lower frequencies; however, the transmission magnitude is reduced. Fig. 3 shows the transmission magnitude and phase of the optimized unit cell. This result indicates that transmission is maximum at a resonant frequency and the resonant frequency is near the frequency of 180o transmission phase, i.e., 14.6 GHz in the present case. The proposed FSS-patch composite antenna can be used in the present North America
After optimizing the parameter of the unit cell and the distance between the FSS and ground plane, the predicted transmission bandwidth at half-maximum is approximately 8%, i.e., from 14.1 to 15.2 GHz. Therefore, the proposed antenna has satisfied the transmission bandwidth requirement. In addition, the required minimum gain of about 20 dBi has also been satisfied owning to the low quality factor (Q) of the FSS screen.
After optimization of the transmission characteristic of a resonator based on the unit cell model, a FSS structure was designed on top of the patch and the ground plane. The reflection coefficient, input impedance, and gain of the antenna at resonance were studied and analyzed. In the design, two parameters-the distance,
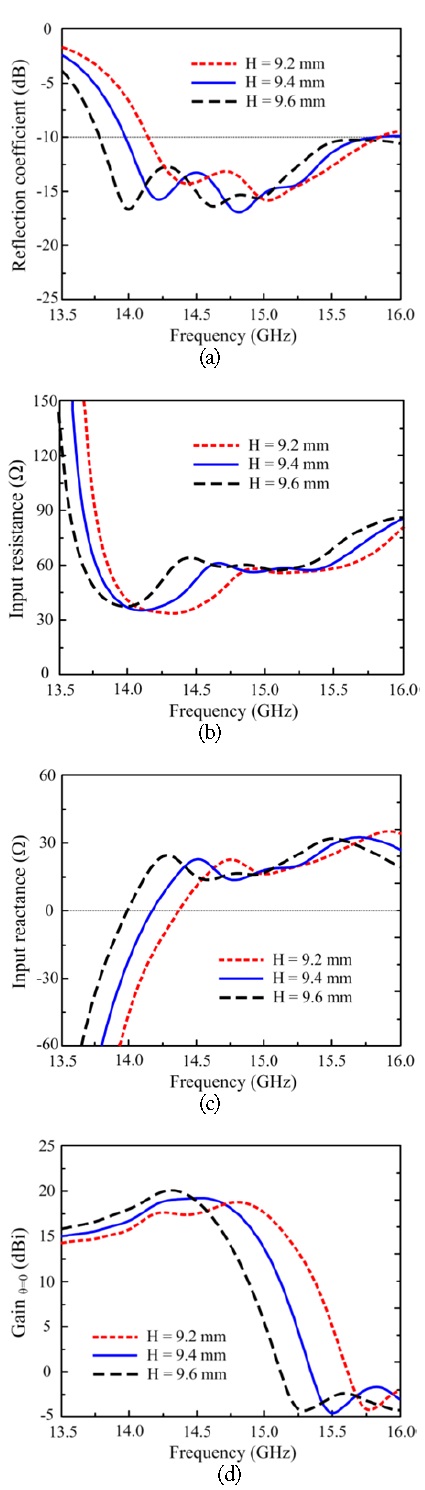
Fig. 4 shows the antenna characteristics with respect to the cavity height
[Table 2.] Impedance and gain bandwidths of the antenna for different H values
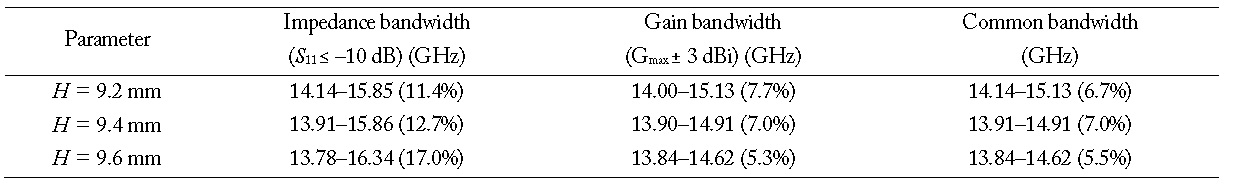
Impedance and gain bandwidths of the antenna for different H values
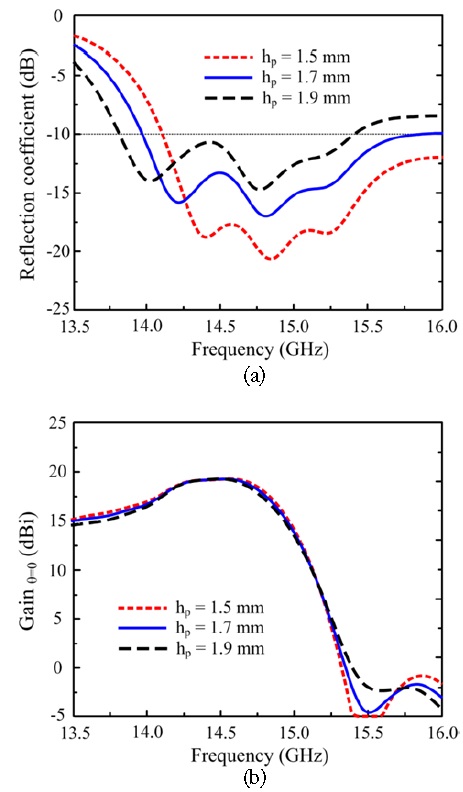
Fig. 5 presents the reflection coefficient and gain characteristics with respect to the distance between the feeding patch and the ground, or the patch height. As the patch height,
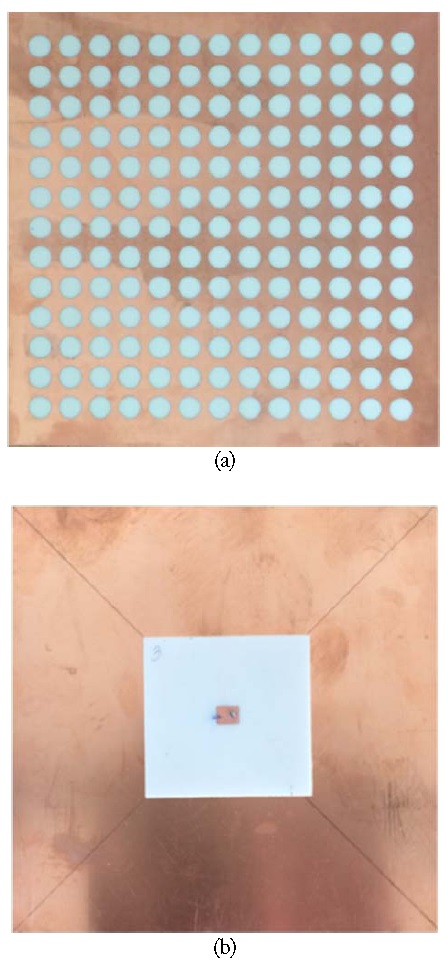
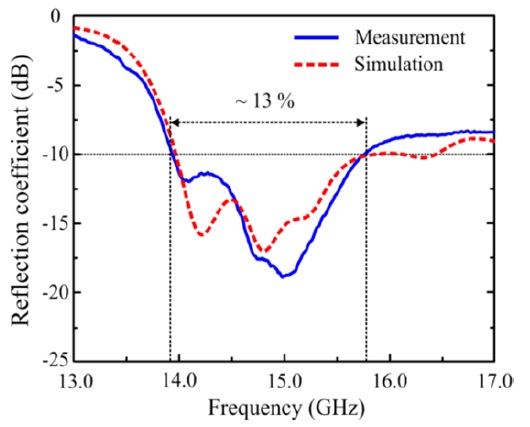
Fig. 6 shows the photographs of the fabricated antenna. The performance of the antenna was measured using an Agilent PNA N5232A network analyzer. Fig. 7 shows that the measured reflection coefficient is close to the simulated one. A measured impedance bandwidth of about 1.9 GHz (13.9–15.8 GHz) was obtained for VSWR≤2, which corresponds to a fractional bandwidth of approximately 13% for the center frequency of 14.85 GHz.
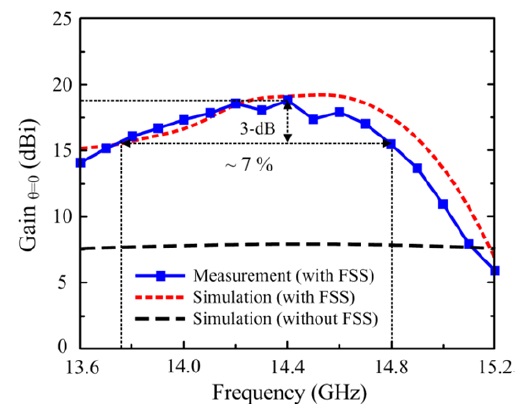
Fig. 8 shows that the measured gain was also close to the simulated one. A measured 3-dB gain bandwidth of about 1.0 GHz (13.8–14.8 GHz) was obtained, corresponding to approximately 7% for the center frequency of 14.4 GHz. In conjunction with the impedance bandwidth, a common bandwidth of approximately 6.3% (13.9–14.8 GHz) was achieved for the proposed Fabry-Perot cavity antenna. The measured maximum gain of the proposed antenna was approximately 18.5 dBi at 14.4 GHz, which is about 0.7 dB lower than the simulated value. In addition, a frequency shift was observed in the high frequency region. These slight discrepancies are attributed to two factors: First, the exact permittivity of the foam is not known. Second, the foam thickness is not perfectly constant and equal to 9.4 mm, as expected in the simulation.
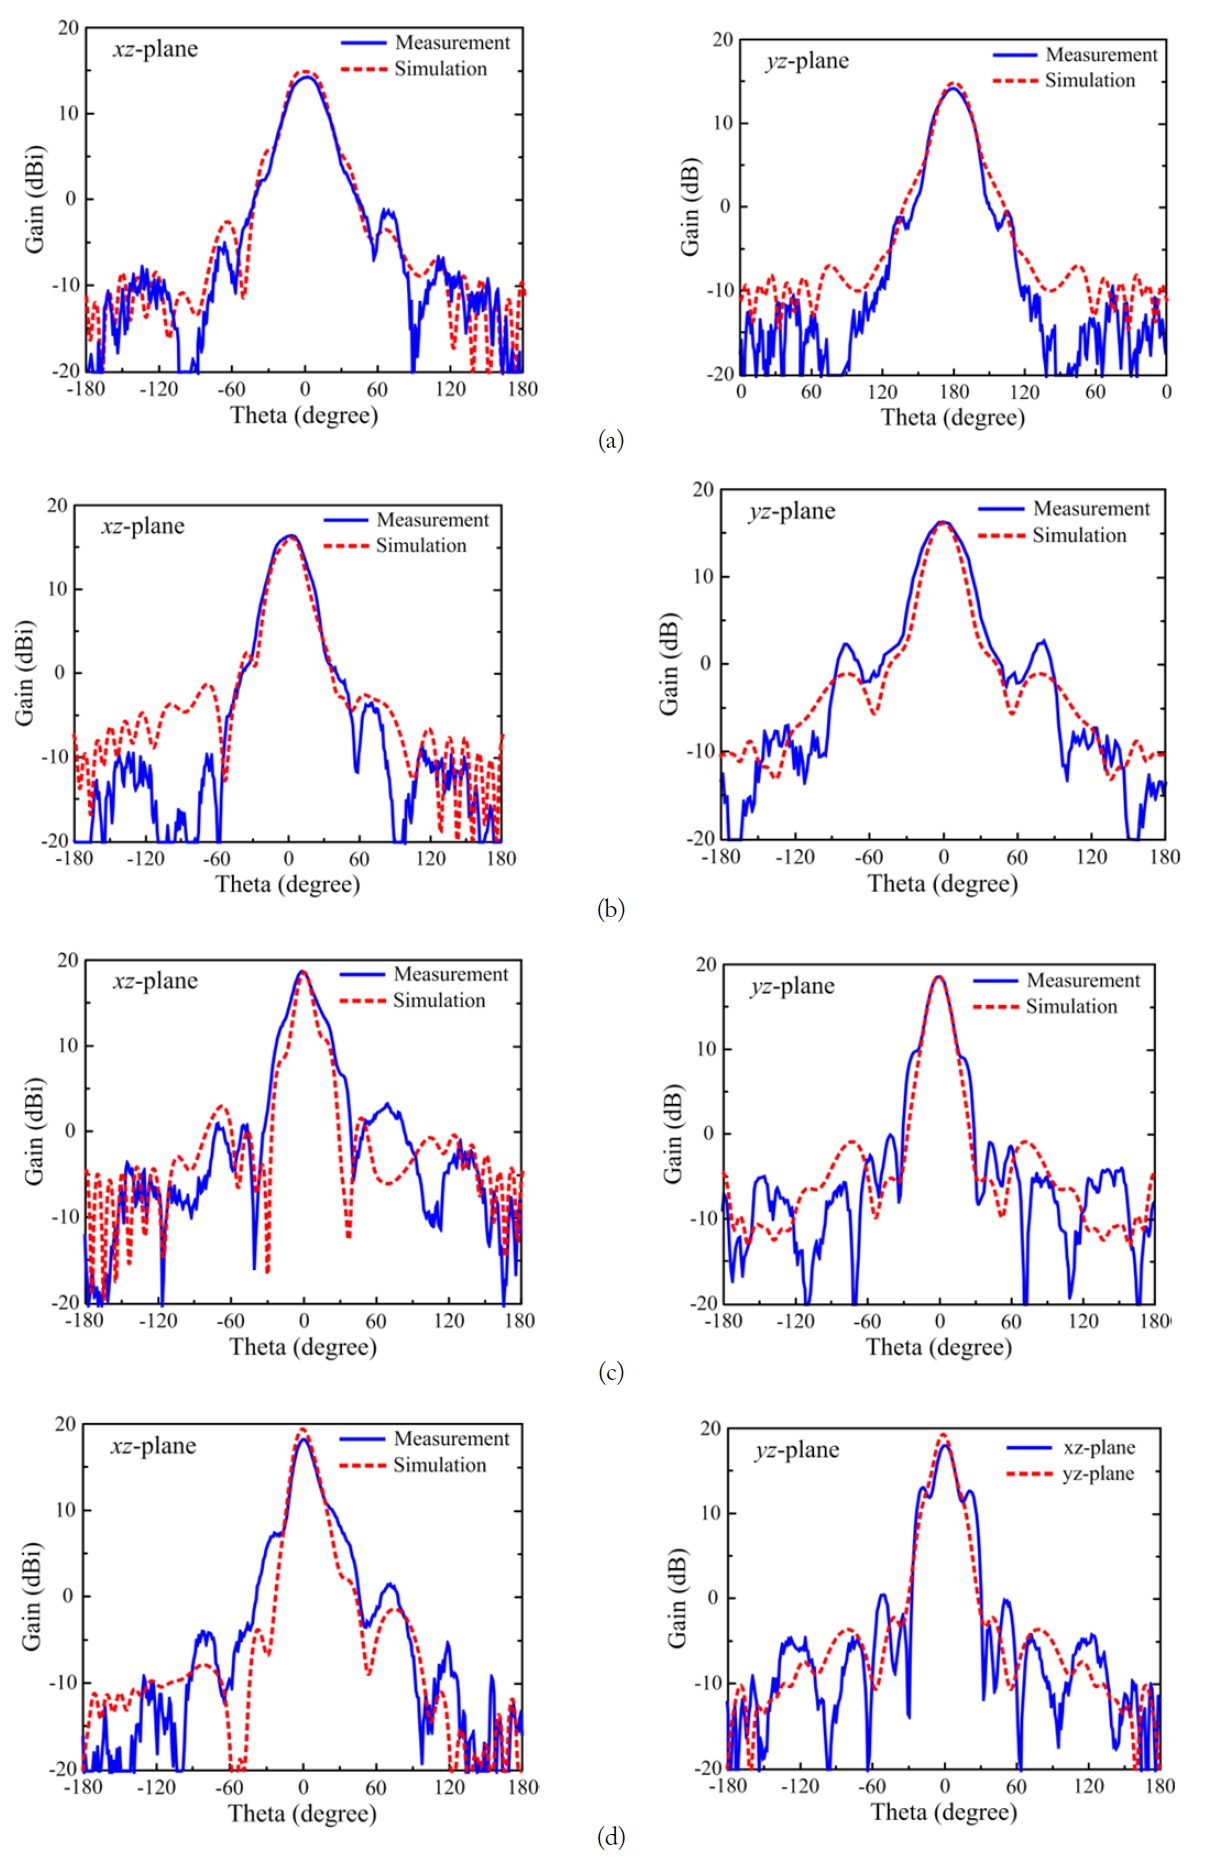
The radiation patterns in the
We presented a low-profile, broad common bandwidth, high-gain antenna using Fabry-Perot cavity resonance for